Aircraft - Design Elements
Aircraft - Design elements libraryThe vector stencils library Aircraft contains clipart of aerospace objects, transportation vehicles, office buildings, and ancillary facilities for ConceptDraw DIAGRAM diagramming and vector drawing software. Use it to draw aerospace and transport illustrations. This design elements library is included in Aerospace and Transport solution from Illustration area of ConceptDraw Solution Park. The Aircraft library contains 19 images:
|
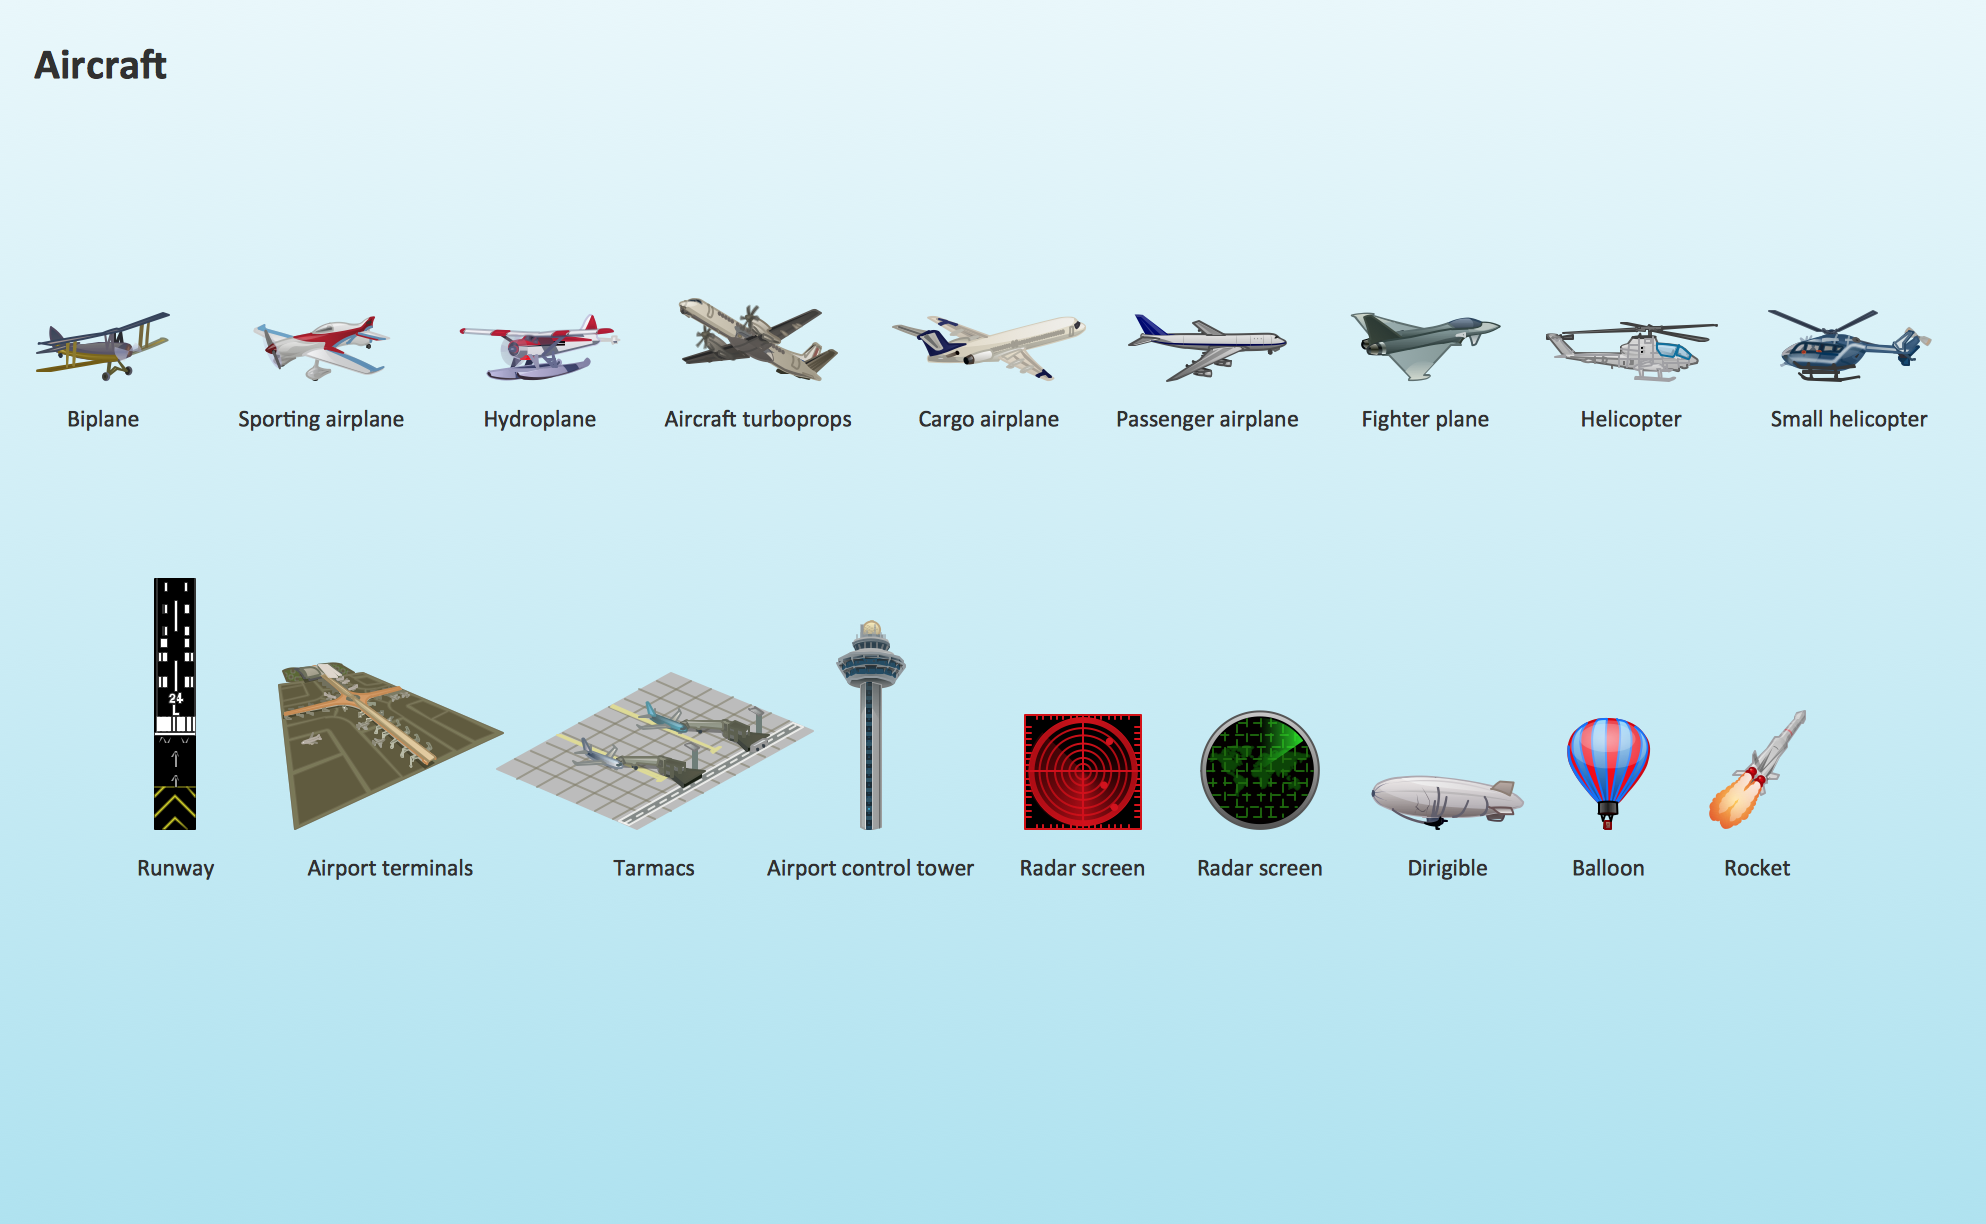
Pic.1 Aircraft - Design Elements
See also Samples:
- Illustration - Aerospace and Transport
- Illustration - Artwork
- Illustration - Audio, video, media
- Illustration - Business and finance
- Illustration - Computers and communications
- Illustration - Manufacturing
- Illustration - Nature
- Illustration - People
- Illustration - Presentation clipart
- Illustration - Safety and security
- Science & Education — illustrations
TEN RELATED HOW TO's:
The ConceptDraw vector stencils library Cisco Telepresence contains videoconference equipment symbols for drawing the computer network diagrams.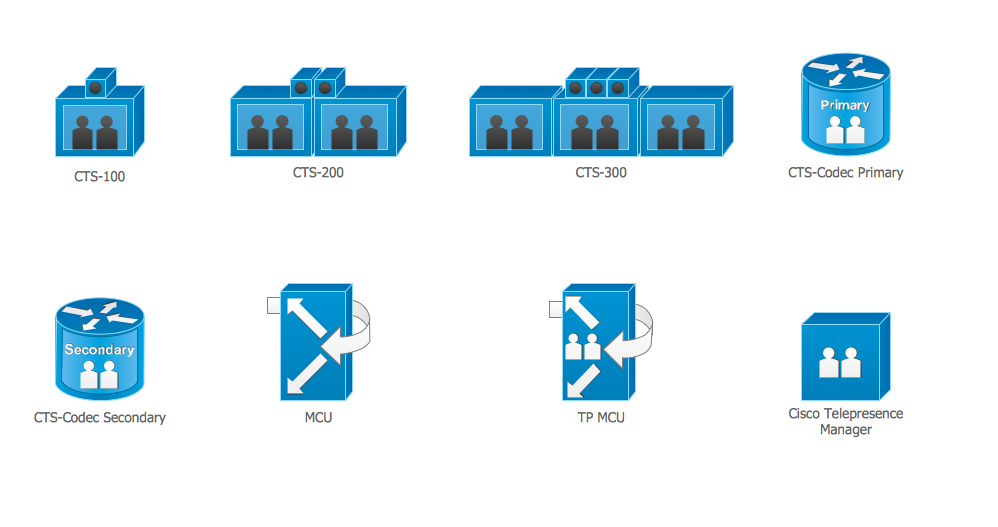
Picture: Cisco Telepresence. Cisco icons, shapes, stencils and symbols
Related Solution:
The use of the special software with Plant Design Solutions is a real help for effective creating the Plant Plan, Plant Layout Plan, Process Plant Layout, Plant Design. ConceptDraw DIAGRAM is the best diagramming and vector drawing software. It offers the Plant Layout Plans Solution from the Building Plans Area for achievement this goal.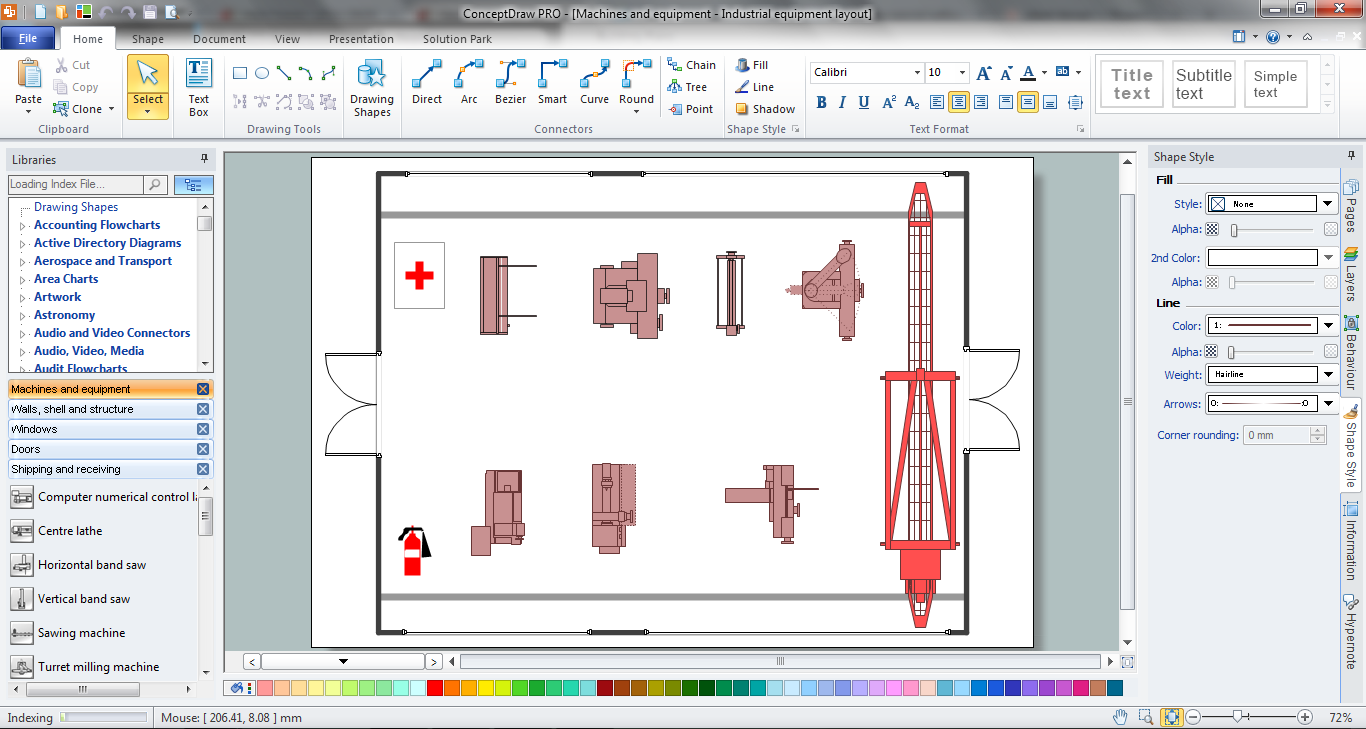
Picture: Plant Design Solutions
Related Solution:
Business and Finance solution from Illustration area of ConceptDraw Solution Park - use it to quick draw illustrations, diagrams and infographics for your advertising and marketing documents, presentations and websites.
The vector clipart library Advertising includes 8 concept images.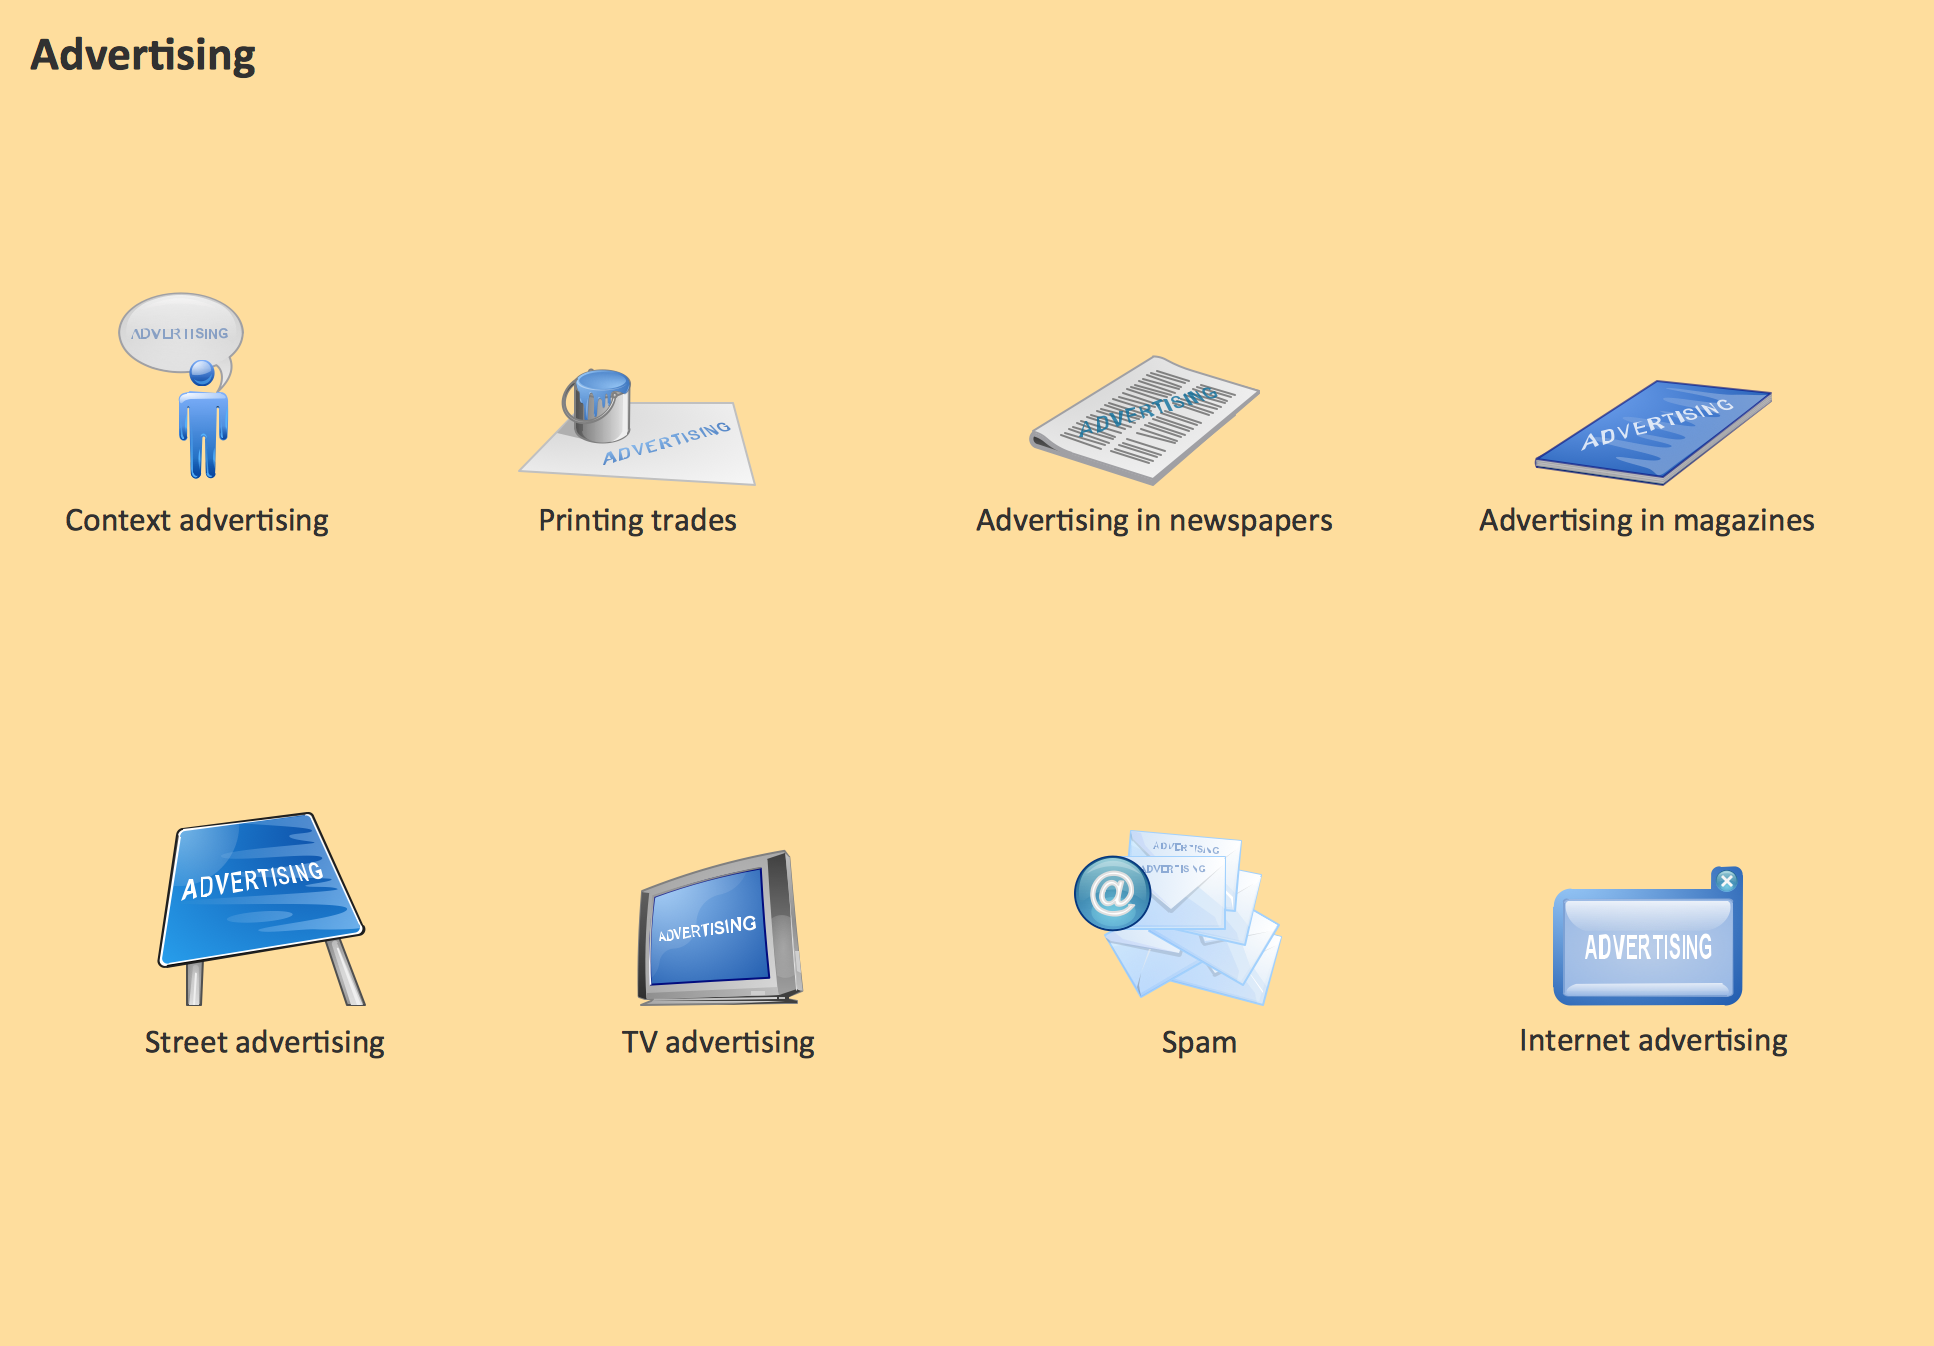
Picture: Advertising - Design Elements
Related Solution:
ConceptDraw DIAGRAM diagramming and vector drawing software offers a Cooking Recipes solution from the Food and Beverage area with wide capabilities for fast and easy design pictorial, bright and inspiring illustrations for various recipes - daily, holiday and party recipes, for pictorial representation dishes in menus of restaurants and cafes, for designing cookbooks, menu sets, food posters and promo materials.
Picture: Party Recipes
Related Solution:
A Flow Map is a type of thinking maps, which help organize and understand information easily. Use ConceptDraw DIAGRAM software to ✔️ create a Flow Map of any degree of complexity in a few minutes, ✔️ display the interrelated information, ✔️ structure information sequentially or chronologically, ✔️ represent manufacturing or engineering processes
Picture: Flow Map: A Step-by-Step Guide
Related Solution:
The following examples cctv network were created in ConceptDraw DIAGRAM diagramming and vector drawing software using the Audio, Video, Media Solution. Using this easily customizable cctv network template you can represent any existing cctv network.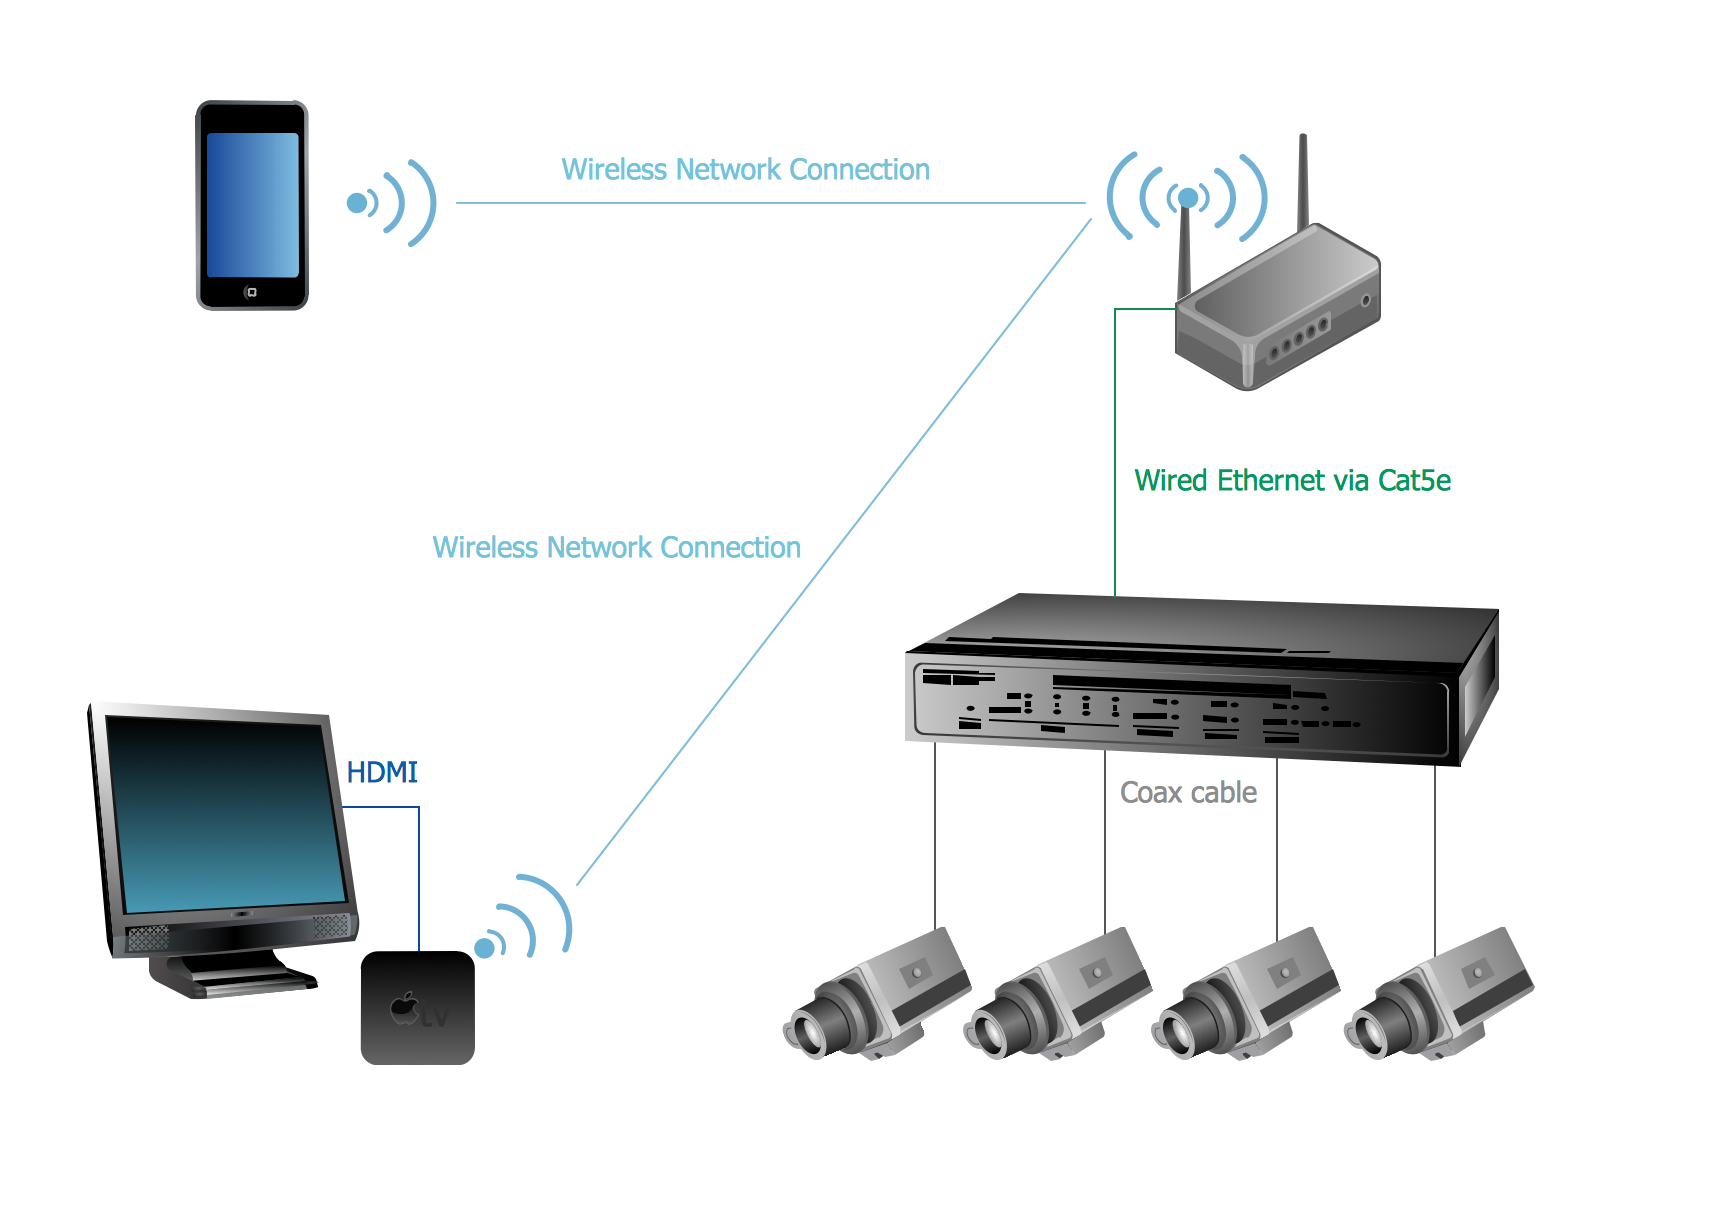
Picture: CCTV Network Example
Related Solutions:
If you need to pull together a quick marketing drawing, you'll find elements, samples, templates and libraries with vector clip art for drawing the Marketing Illustrations.
These symbols and signs you can use in your design for Strategic Marketing, Graphic Design, Inbound and Content Marketing, Social Media, Lead Generation, Email Marketing and Automation, CRM implementation and Integration and more.
Picture: Marketing - Design Elements
Related Solution:
In general, you can use any icons to represent network equipment on a diagram. However, there are some icons, for instance, Cisco icons, shapes, stencils and symbols, that are recognizable worldwide. Using those icons you can create Cisco network topology diagrams in minutes and share them anywhere.
The icons depicting Cisco network equipment are recognized and generally applied as standard images for designing network diagrams. They are free to used , but can not be reworked. Cisco network diagrams are created to depict how signals processed on the network equipment and end-user computers and how data transfer through LAN or WLAN between nodes. The vector graphic library of ConceptDraw CISCO Network Diagrams solution includes about 90 icons of Cisco network equipment for designing computer network diagrams with ConceptDraw DIAGRAM.
Picture: Cisco Network Topology. Cisco icons, shapes, stencils and symbols
Related Solution:
These vector illustrations and cliparts are created for drawing the Project management Illustrations and contain plenty of project management design elements. The clipart library Project management includes 35 icons.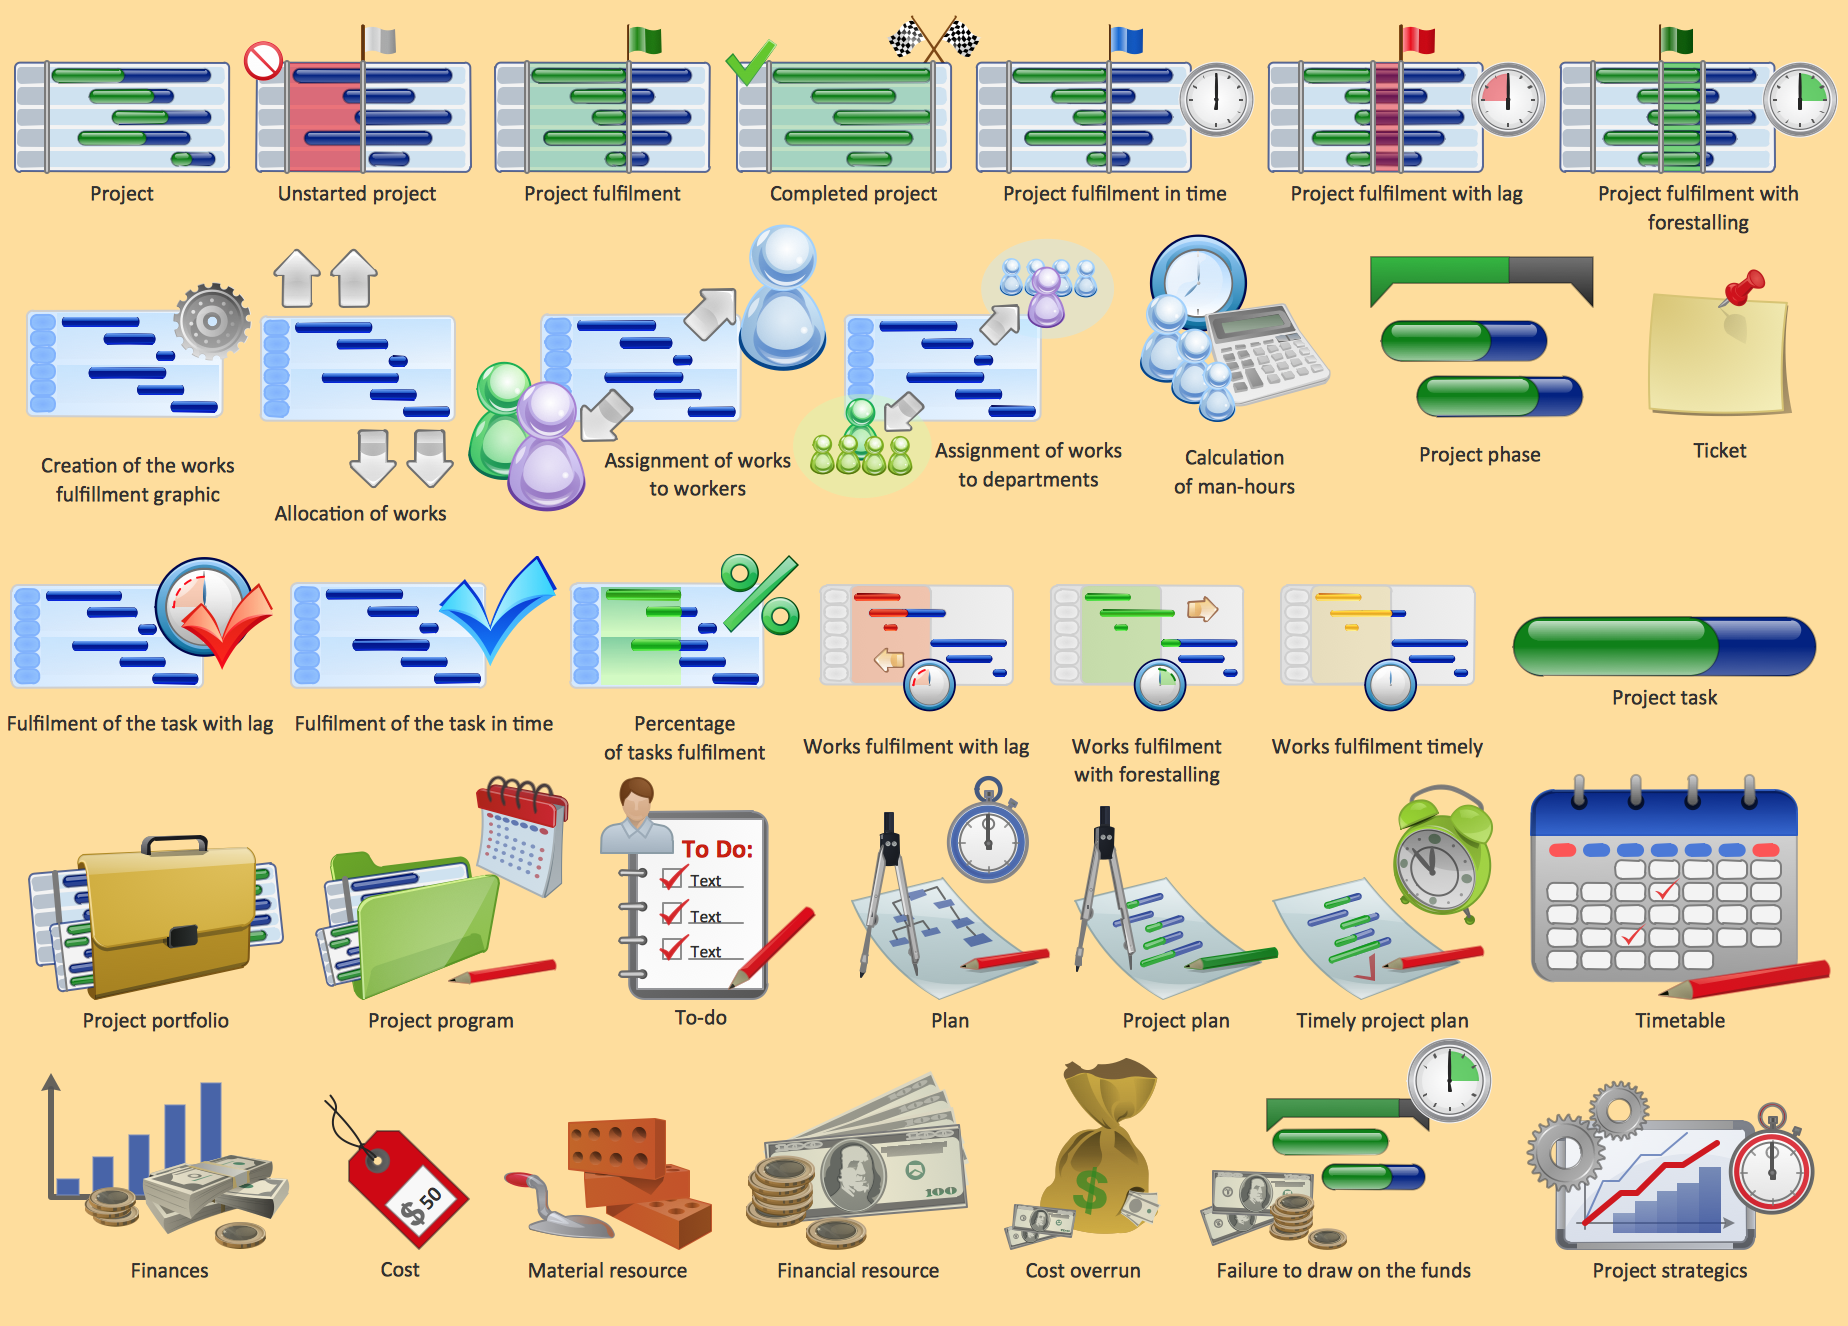
Picture: Project management - Design Elements
Related Solution:
Communication is the main challenge and the key success factor for organizational project management in company with remote projects. Communicating visually via Skype you bring all projects together to achieve corporate goals.
Picture: Remote Projects in Corporate Strategy
Related Solution:
ConceptDraw
DIAGRAM 18