
Example 2. Active Directory Domain Services Diagram
This Active Directory Domain Services diagram (AD DS) was created in ConceptDraw DIAGRAM using the predesigned vector objects from the Active Directory Diagrams Solution libraries. An experienced user spent 10 minutes creating this sample.
The active directory diagrams designed with ConceptDraw DIAGRAM are vector graphic documents and are available for reviewing, modifying, converting to a variety of formats (image, HTML, PDF file, MS PowerPoint Presentation, Adobe Flash or MS Visio), printing and send via e-mail in one moment.
TEN RELATED HOW TO's:
When talking about engineering, one should define all the terms used, so anybody could understand the topic. Typical network glossary contains definitions of numerous network appliances, types of networks and cable systems. The understanding of basic is crucial for server management, network administration and investigating problems.
The network glossary defines terms related to networking and communications. The most of glossary items has their visual representation in ConceptDraw DIAGRAM libraries of the Computer Network Diagrams solution. This illustration presents a local area network (LAN) diagram. It designed to show the way the interaction of network devices in a local network. The diagram uses a library containing symbols of network equipment, connections and the end-point devices such as network printer, hubs, server, modem and finally computers (PC, mac, laptop). This diagram depicts a physical LAN topology.
Picture: Network Glossary Definition
Related Solution:
ConceptDraw DIAGRAM diagramming and vector drawing software extended with Cisco Network Diagrams Solution from the Computer and Networks Area is the best for creating Cisco Network Diagrams thanks to numerous predesigned Cisco network icons.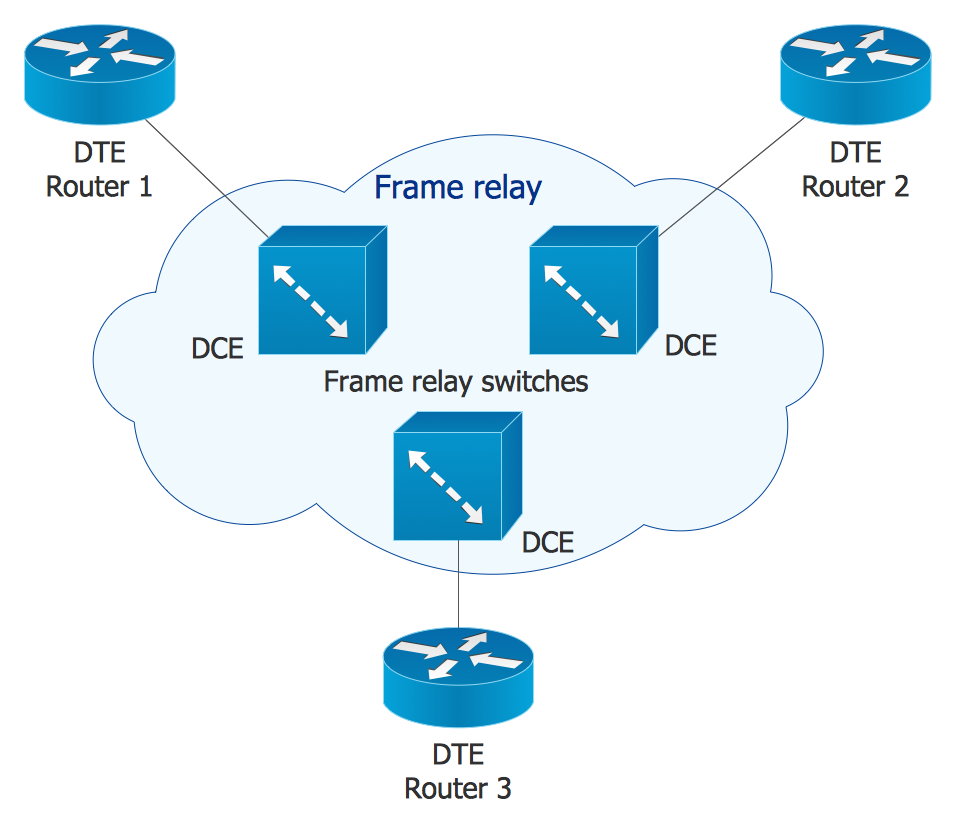
Picture: Cisco Network Icons
Related Solution:
While creating flowcharts and process flow diagrams, you should use special objects to define different statements, so anyone aware of flowcharts can get your scheme right. There is a short and an extended list of basic flowchart symbols and their meaning. Basic flowchart symbols include terminator objects, rectangles for describing steps of a process, diamonds representing appearing conditions and questions and parallelograms to show incoming data.
This diagram gives a general review of the standard symbols that are used when creating flowcharts and process flow diagrams. The practice of using a set of standard flowchart symbols was admitted in order to make flowcharts and other process flow diagrams created by any person properly understandable by other people. The flowchart symbols depict different kinds of actions and phases in a process. The sequence of the actions, and the relationships between them are shown by special lines and arrows. There are a large number of flowchart symbols. Which of them can be used in the particular diagram depends on its type. For instance, some symbols used in data flow diagrams usually are not used in the process flowcharts. Business process system use exactly these flowchart symbols.
Picture: Flowchart Symbols: Meaning and Examples
Related Solution:
A Storage area network (SAN) is a dedicated network that provides access to data storage and operations only on the block level. SAN usually has own network of storage devices/elements and disk arrays that are connected with each other and to a remote data-sharing network. SANs are widely used for enhancing the storage devices (optical jukeboxes, disk arrays, tape libraries) that are accessible for networked servers.
This example was created in ConceptDraw DIAGRAM using the Computer and Networks Area of ConceptDraw Solution Park. It shows the hybrid of Storage area network (SAN) and Network Attached Storage (NAS) technologies.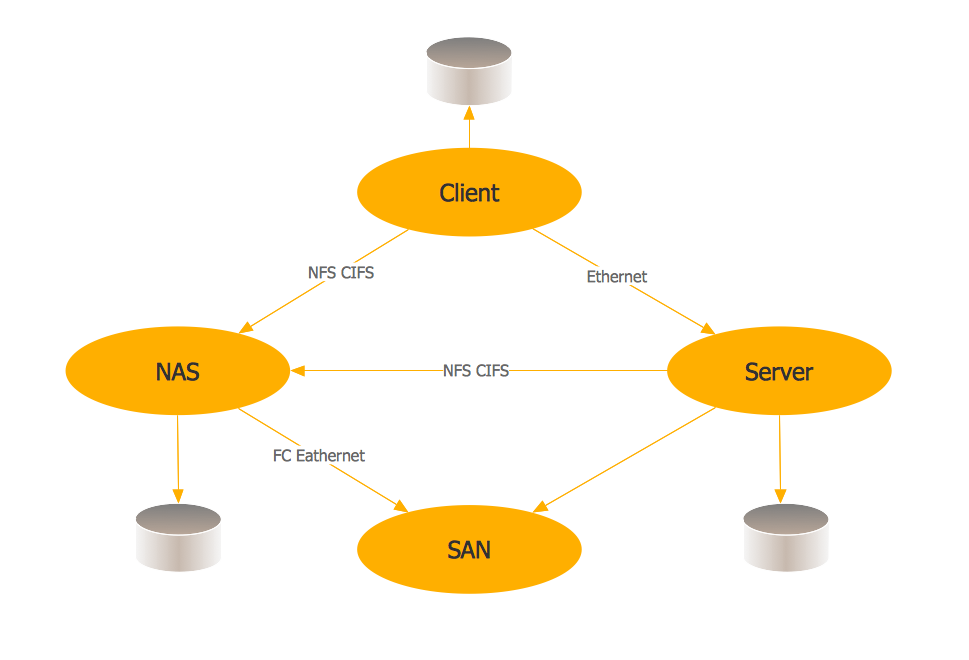
Picture: Storage area networks (SAN). Computer and Network Examples
Related Solution:
Designing a workspace or office involves careful consideration of form and function. Conceptdraw offers you all nessesary office design elements in one library. Combine, match, design and create!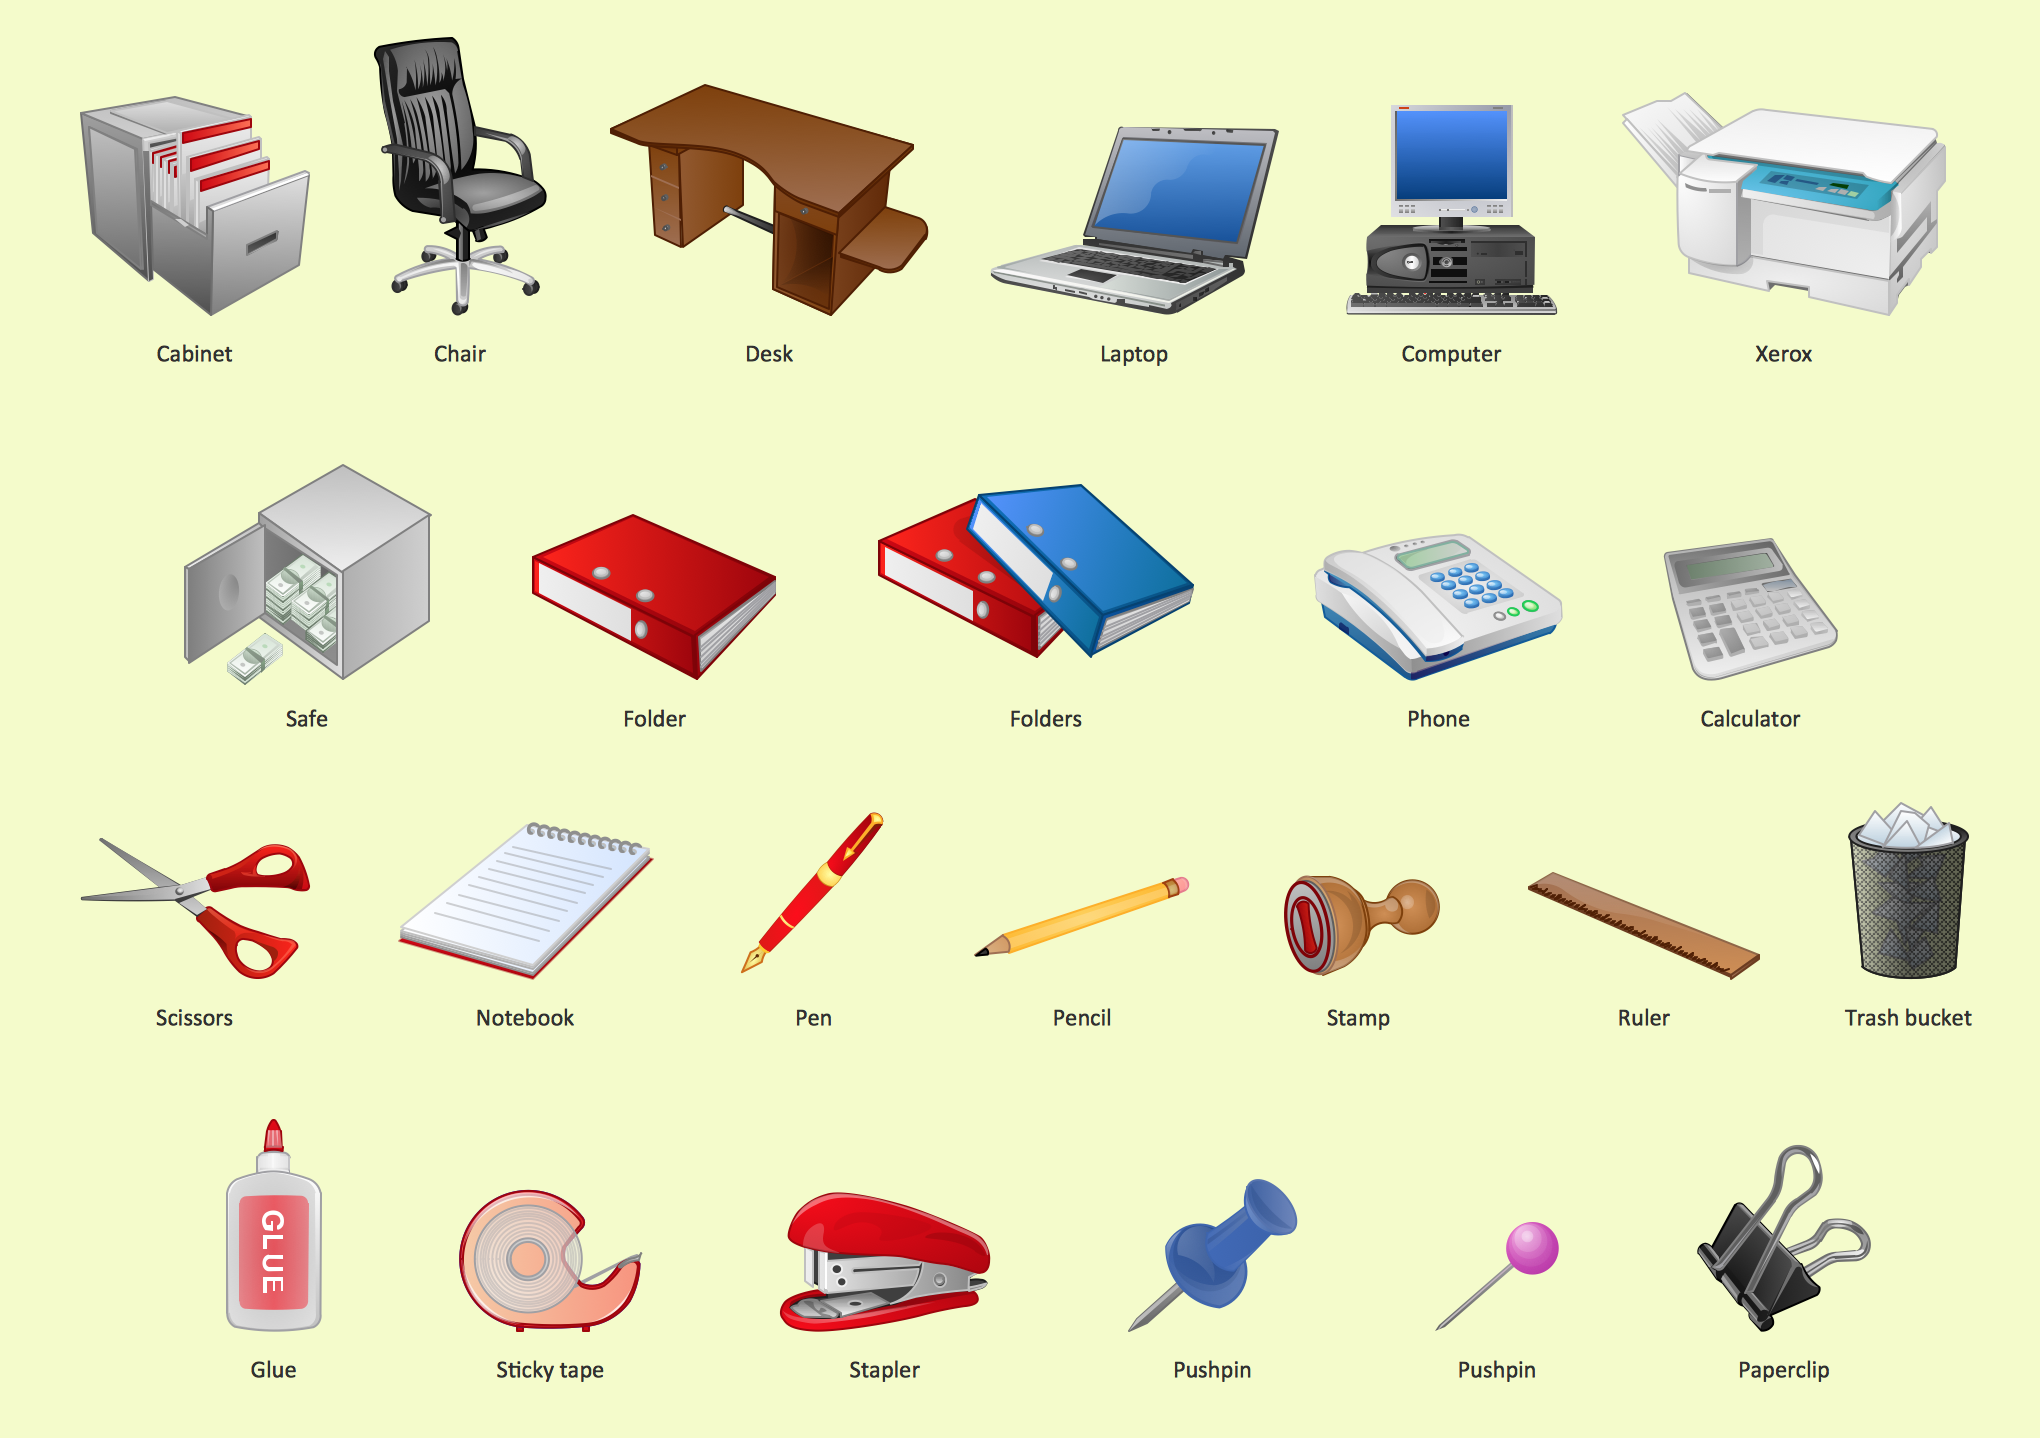
Picture: Office - Design Elements
Related Solution:
Visio Files and ConceptDraw. ConceptDraw DIAGRAM is compatible with MS Visio.VDX formatted files.VDX is Visio’s open XML file format, and it can be easily imported and exported by ConceptDraw DIAGRAM.
Picture: Visio Files and ConceptDraw
The VMware vNetwork Distributed Switch (vDS) is the new virtual switch (vSwitch) with vSphere 4 that extends the set of features of the VMware vNetwork Standard Switch (vSS). The VMware vSS is the base-level virtual networking alternative that extends the capabilities, configuration and appearance of the standard vSwitch in VMware ESX 3.5 to ESX 4.0 and vSphere 4.
This example was created in ConceptDraw DIAGRAM using the Computer and Networks Area of ConceptDraw Solution Park and shows the VMware vDS network diagram.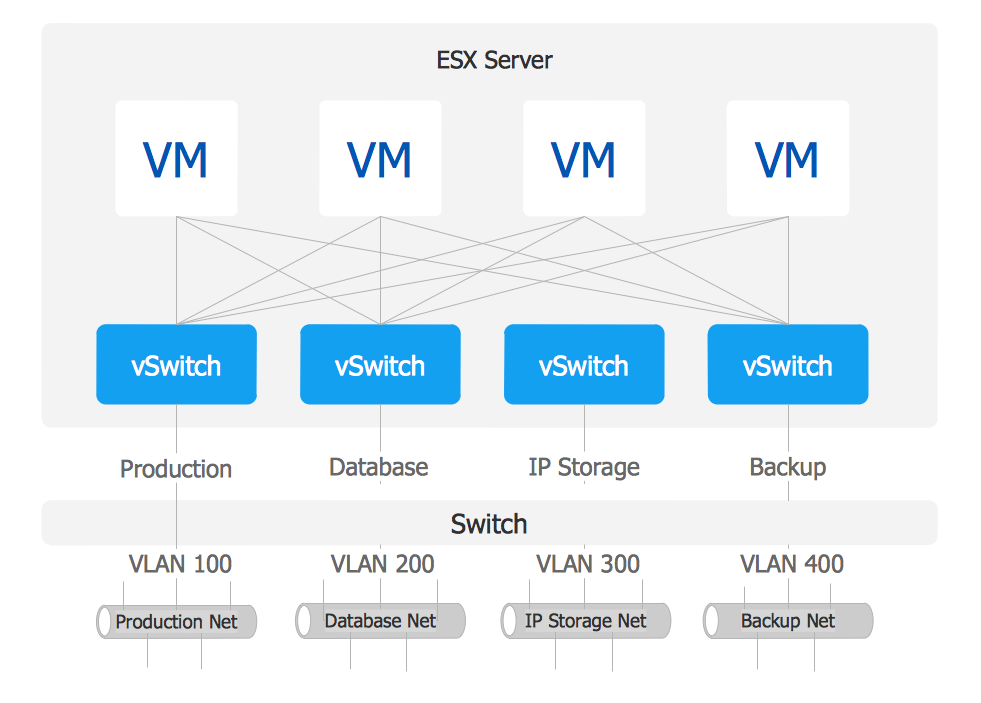
Picture: VMware vNetwork Distributied Switch (vDS). Computer and Network Examples
Related Solution:
For documenting the Cloud Computing Architecture with a goal to facilitate the communication between stakeholders are successfully used the Cloud Computing Architecture diagrams. It is convenient and easy to draw various Cloud Computing Architecture diagrams in ConceptDraw DIAGRAM software with help of tools of the Cloud Computing Diagrams Solution from the Computer and Networks Area of ConceptDraw Solution Park.
Picture: Cloud Computing Architecture Diagrams
Related Solution:
Creating a detailed network plan can cause a lot of headache to an unexperienced user. And it is worth mentioning that ConceptDraw DIAGRAM is a decent tool for creating a network diagram, a tool that is easy-to-use. To get an accurate diagram use the vector shapes from the special libraries that represent workstations, network appliances, wiring systems and connect them with smart-connectors, just as simple as that.
This communication network diagram displays the way different components of a computer network communicate with each other. When representing network information, such as depicting all the equipment in a large network, it is helpful to make visual representation. Network diagram provides an easy way to show the way the connections between an equipment in a large network. This diagram of a communication network depicts a network composed of three sub-networks. It uses a network equipment symbols to represent the different devices that make up a network communication including routers, Ethernet devices and end-point equipment.
Picture: ConceptDraw DIAGRAM Network Diagram Tool
Related Solution:
Are you sure that the process of creating the Cisco network diagrams is very complex? Verify back with the help of ConceptDraw DIAGRAM software extended with Cisco Network Diagrams Solution from the Computer and Networks Area. All powerful drawing tools, each Cisco icon, template, sample will be very helpful for you.
Picture: Cisco Icon
Related Solution:
 Active Directory Library
 Active Directory Sites and Services Library


