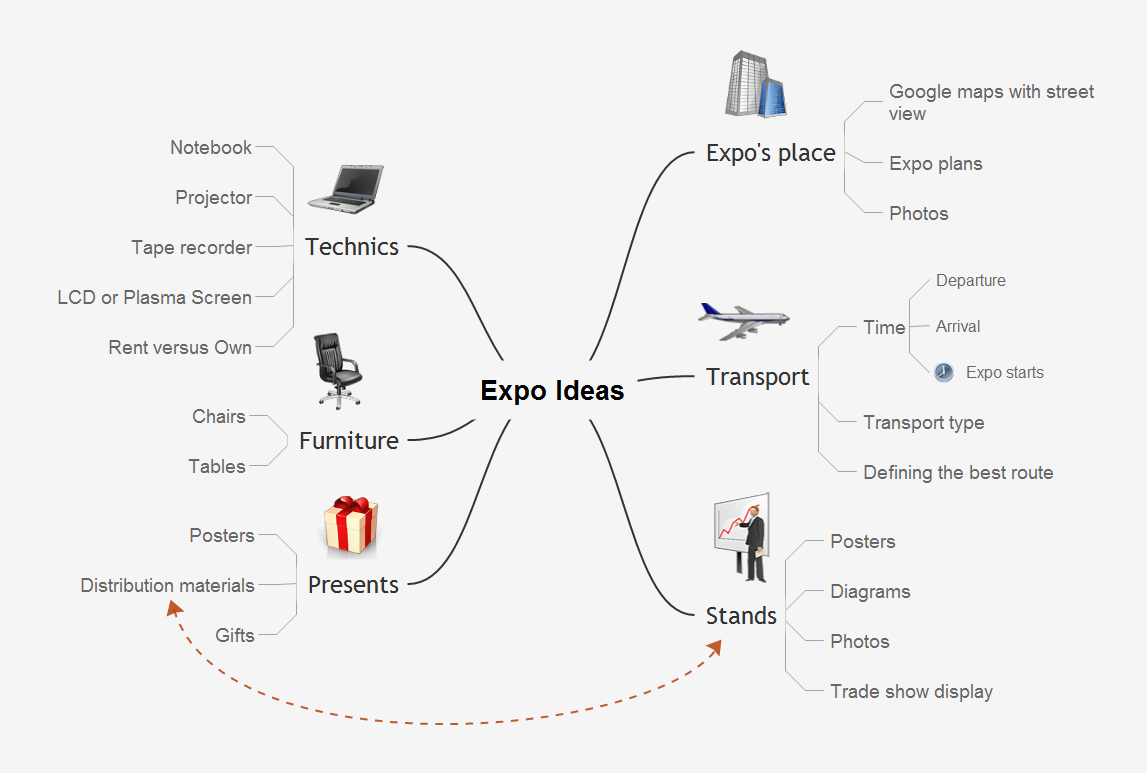
Sample 1. Mind map presentation - Expo ideas.
Presentation Exchange solution extends ConceptDraw MINDMAP software with the ability to import presentations from Microsoft PowerPoint, as well as enhancing its existing presentation capabilities.
With the Presentation Exchange solution you can easily extract the content from a PowerPoint presentation to see how it all fits together in a single view. You can review slide content, see how the slides support one another, and refine the story.
EIGHT RELATED HOW TO's:
ConceptDraw MINDMAP software is an advanced tool for creating presentations. You can effectively generate, change, and update your presentation for demonstrating results of your work.
Picture: Demonstrating Results
Related Solution:
ConceptDraw PROJECT is simple project management software for planning projects, it include tools for planning project objectives. This type of project planning software intended for professional who use project terms daily. CoonceptDraw PROJECT can be used as customer project management software to keep on track on-site operations. It often used for planning marketing activity as marketing project management software, also it used as simple project management software for software development projects.
Picture: ConceptDraw PROJECT Project Management Software Tool
ConceptDraw PROJECT is simple project scheduling software delivering the full range of classic project reports about statuses and resorces usage. Learn how features of project gantt charts works in simple ConceptDraw PROJECT scheduling software, how to export project management dashboard in excel representation.
Picture: Gantt charts for planning and scheduling projects
This sample was created in ConceptDraw DIAGRAM diagramming and vector drawing software using the Pie Charts Solution from Graphs and Charts area of ConceptDraw Solution Park.
This sample shows the Pie Chart of the approximate air composition. You can see the percentage of oxygen, nitrogen and other gases in the air visualized on this Pie Chart.
Picture: Percentage Pie Chart. Pie Chart Examples
Related Solution:
Mac compatible remote presentation, A simple way to share your presentation remotely via Skype. All participants receive presentation file.
Picture: Mac Compatible Remote Presentation
Related Solution:
ConceptDraw MINDMAP with the ability to import presentations from Microsoft PowerPoint, as well as enhancing its existing presentation capabilities.
Picture: Best Mind Mapping Program for Making Presentations
Related Solution:
Data Exchange - Tools to exchnage data files of major mindmapping software for team collaboration.
The Mind Map Exchange solution allows you to share mind maps with others who have 3rd party mind map applications.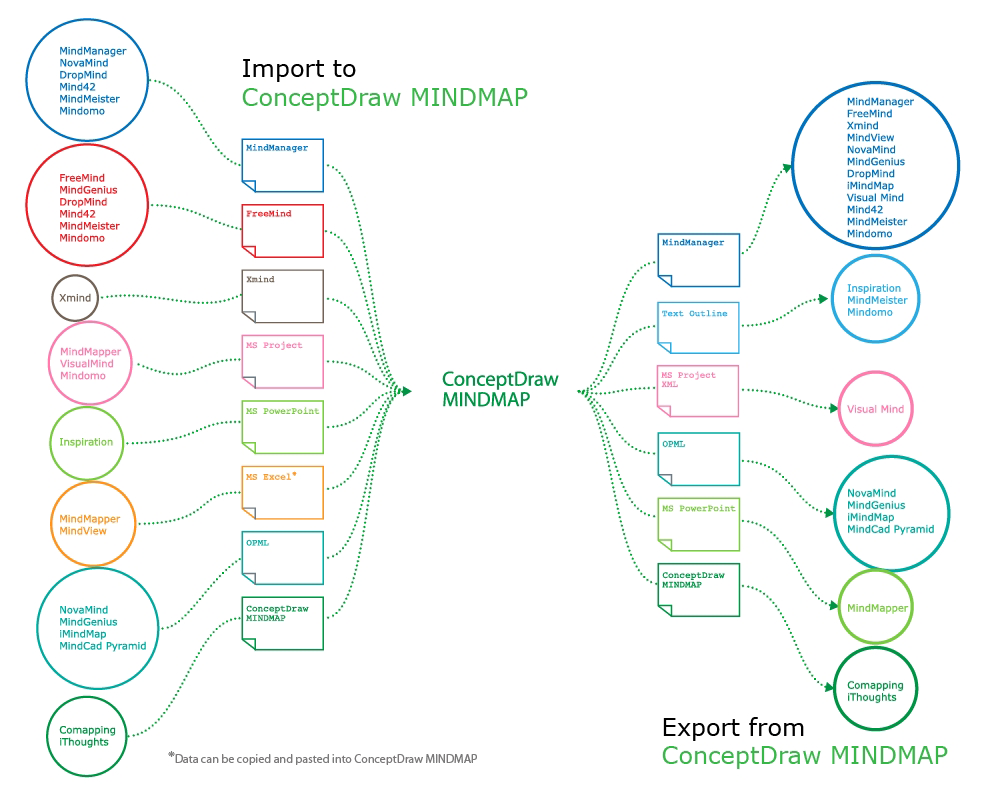
Picture: How to exchange data files of major mind mapping software?
Related Solution:
Professional Mind Mapping. ConceptDraw MINDMAP professional software to create documents. Mac and PC compatible. MS Office Exchange Solutions. Skype Collaboration. Presentation Tools.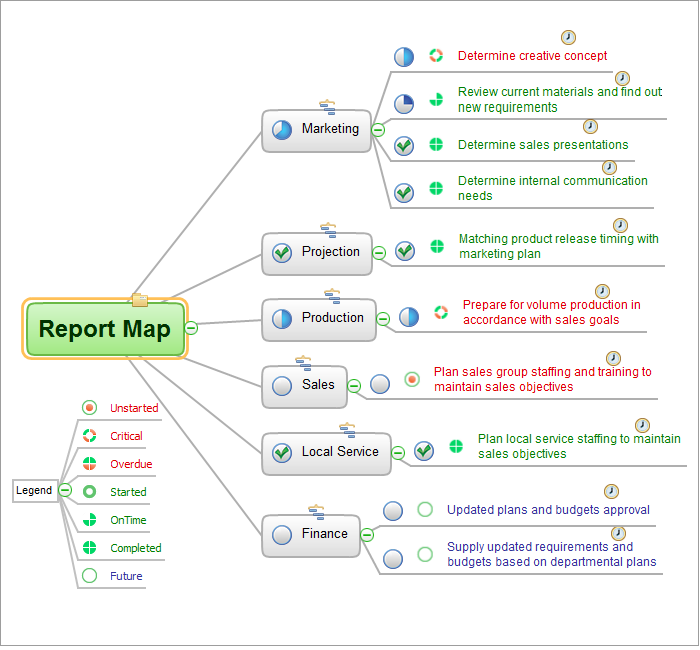
Picture: One formula of professional mind mapping :input data + output data + make great presentation
Related Solution: