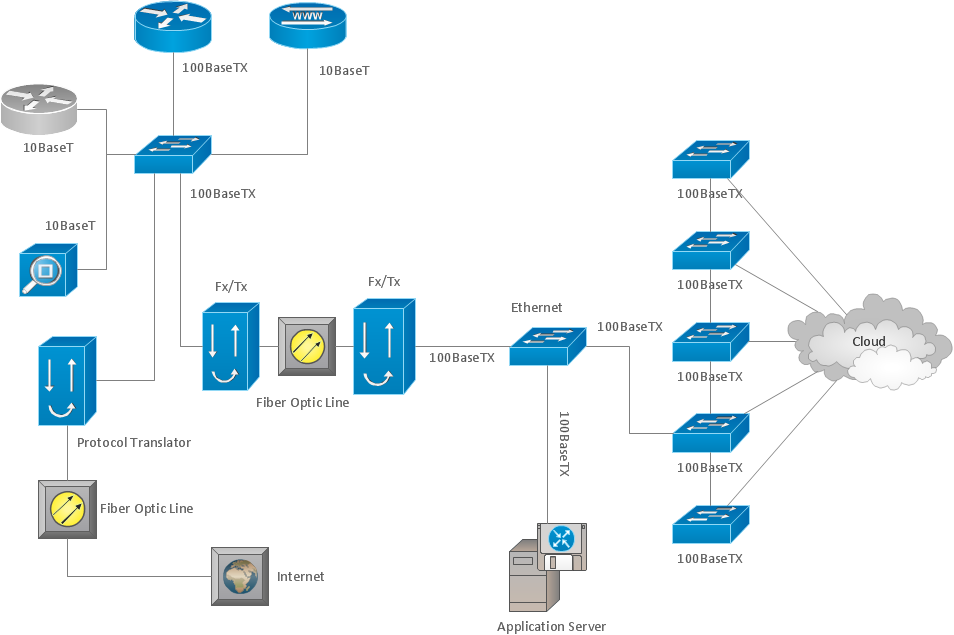
Sample 1. Network organization chart.
ConceptDraw DIAGRAM diagramming software provides vector shapes and connector tools for quick and easy drawing diagrams for business, technology, science and education.
Use ConceptDraw DIAGRAM enhanced with solutions from ConceptDraw Solution Park to create diagrams to present and explain structures, process flows, logical relationships, networks, design schemes and other visually organized information and knowledge.
TEN RELATED HOW TO's:
The metal–oxide–semiconductor field-effect transistor (MOSFET, MOS-FET, or MOS FET) is a type of transistor used for amplifying or switching electronic signals.
Although the MOSFET is a four-terminal device with source (S), gate (G), drain (D), and body (B) terminals, the body (or substrate) of the MOSFET is often connected to the source terminal, making it a three-terminal device like other field-effect transistors. Because these two terminals are normally connected to each other (short-circuited) internally, only three terminals appear in electrical diagrams. The MOSFET is by far the most common transistor in both digital and analog circuits, though the bipolar junction transistor was at one time much more common.
26 libraries of the Electrical Engineering Solution of ConceptDraw DIAGRAM make your electrical diagramming simple, efficient, and effective. You can simply and quickly drop the ready-to-use objects from libraries into your document to create the electrical diagram.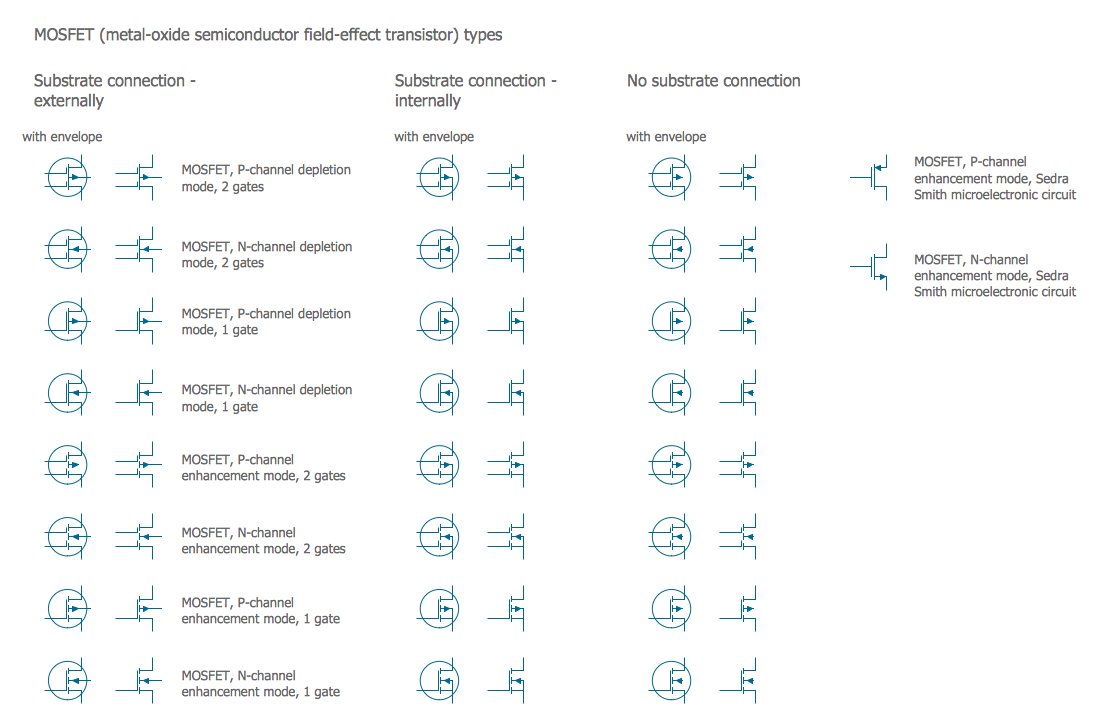
Picture: Electrical Symbols — MOSFET
Related Solution:
ConceptDraw DIAGRAM enhanced with Flowcharts Solution is the best flow chart maker online design software. Use it to ✔️ create clear and actionable Flowcharts, ✔️ improve decision-making, ✔️ enhance problem-solving in various scenarios, ✔️ enhance creativity and productivity across industries, ✔️ streamline workflows
Picture: Flow Chart Online
Related Solution:
Process flow diagram (PFD) is a type of flowchart designed for industrial engineering to show the integrity of plant equipment and operations. ConceptDraw DIAGRAM software extended with Chemical and Process Engineering solution provides powerful drawing tools and extensive features to create Process flow graphics, give an overview and document the overall processes, standardize and make their understanding simpler, improve quality control, and increase process efficiency.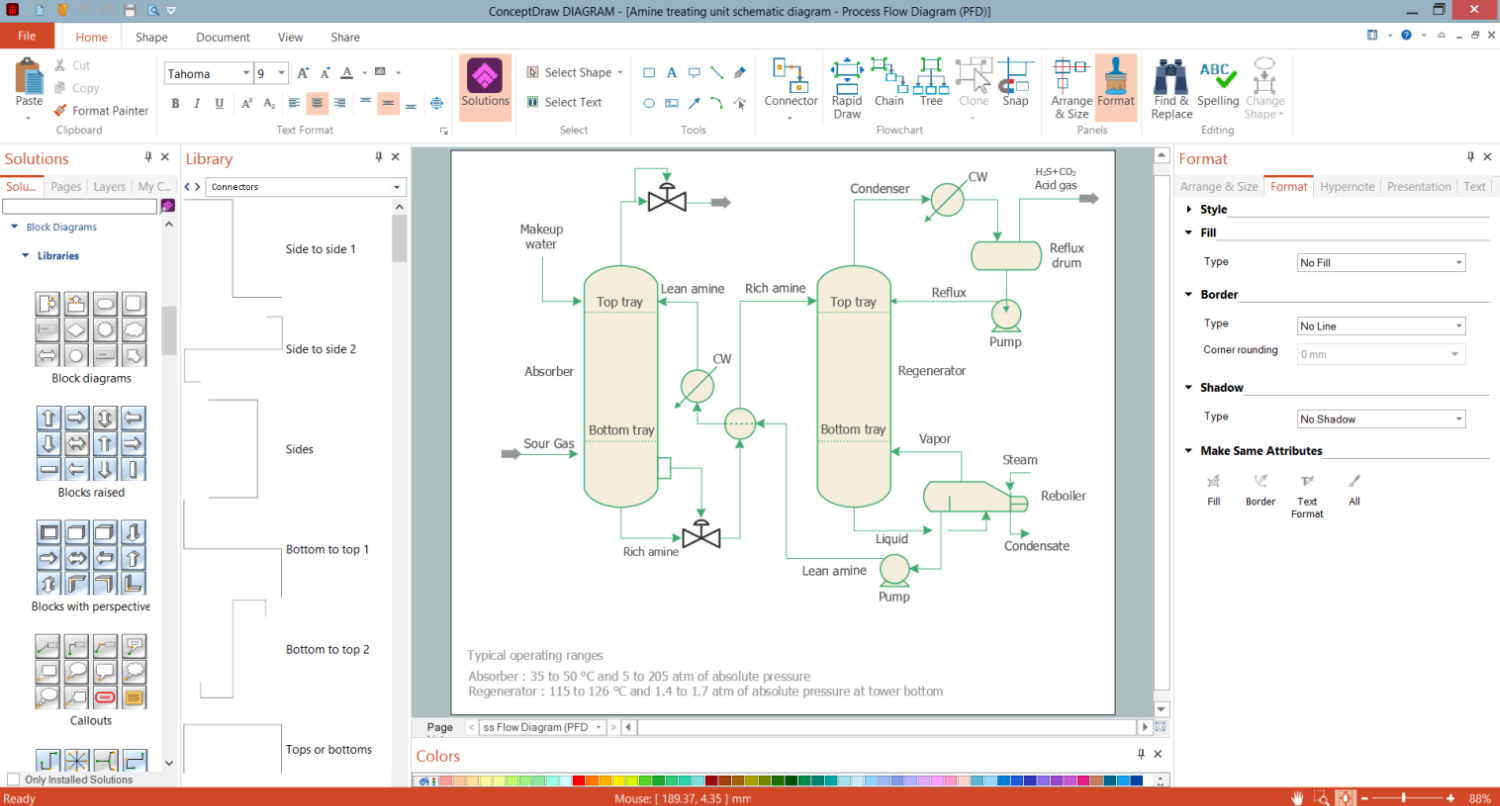
Picture: Process Flow Graphics
Related Solution:
This sample shows the Purchasing Flow Chart Diagram that displays the money flow in the carbon offset sphere. The carbon offsets are the compensatory measures that the companies make for the carbon emissions. You can see on this sample the groups that have interests in the carbon offsets and the money flow after the carbon offset vendors sold the carbon offsets.
Picture: Purchasing Flow Chart.Purchasing Flowchart Example
Related Solution:
There are a lot of tutorials that get you familiar with emergency situations. If you want to know how to create emergency plans and fire evacuation schemes then you must be concerned about safety. There is a list of rules that you should follow to set the fire safety equipment properly.
Discover this precise and accurate fire emergency evacuation plan. This sample drawing demonstrate facilities of ConceptDraw DIAGRAM together with its Fire and Emergency Plans solution. The evacuation plan is designed to provide employees and visitors with a map depicting the ways they may use to escape the building in emergency situations. The telephone sets, first aid boxes and extinguisher are also marked on this plan. The evacuation plan should contain a legend for readers. The similar plans are commonly hang on the wall on the building's floors.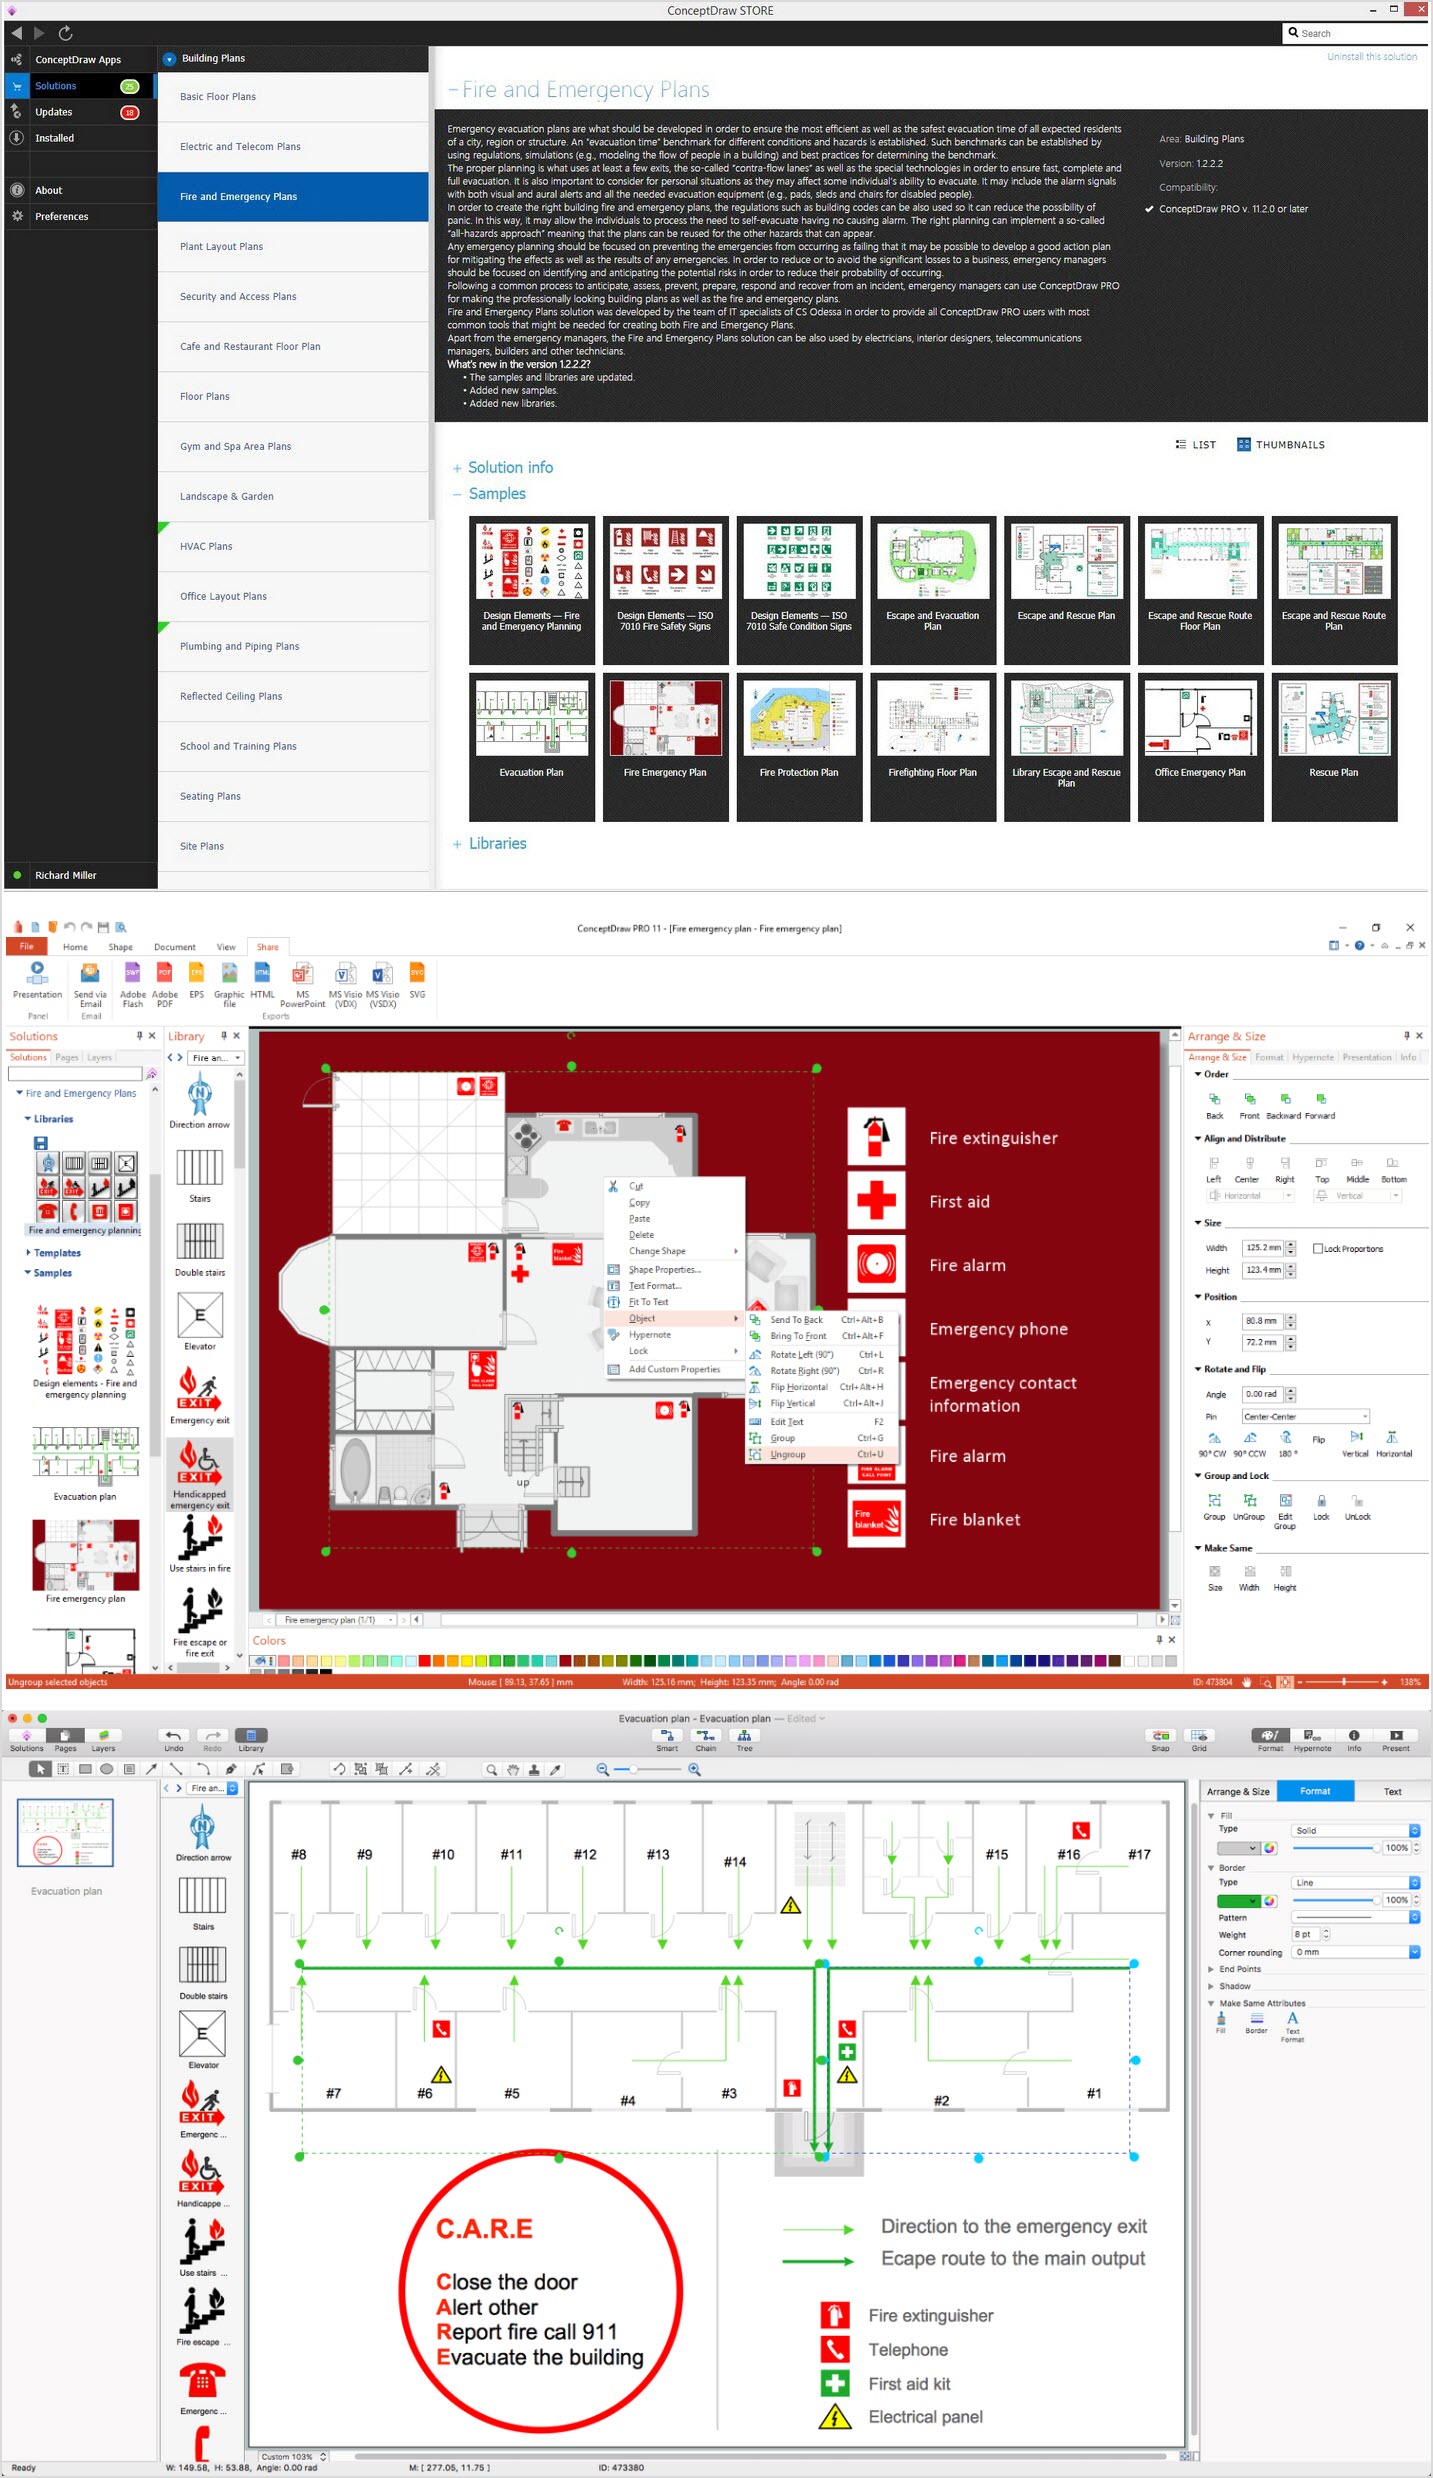
Picture: How To Create Emergency Plans and Fire Evacuation
Related Solution:
An architectural design is a technical drawing of a building. Creating of the architectural design is the important part in the architecture and building. It is a way for the architects to represent their ideas and concepts, to develop the design idea to the concrete proposal. It' very convenient for architects to create the architectural design using the computer software.
СonceptDraw DIAGRAM is a powerful CAD drawing software. Using the Floor Plans Solution from the Building Plans area of ConceptDraw Solution Park you can create professional looking architectural designs quick, easy and effective.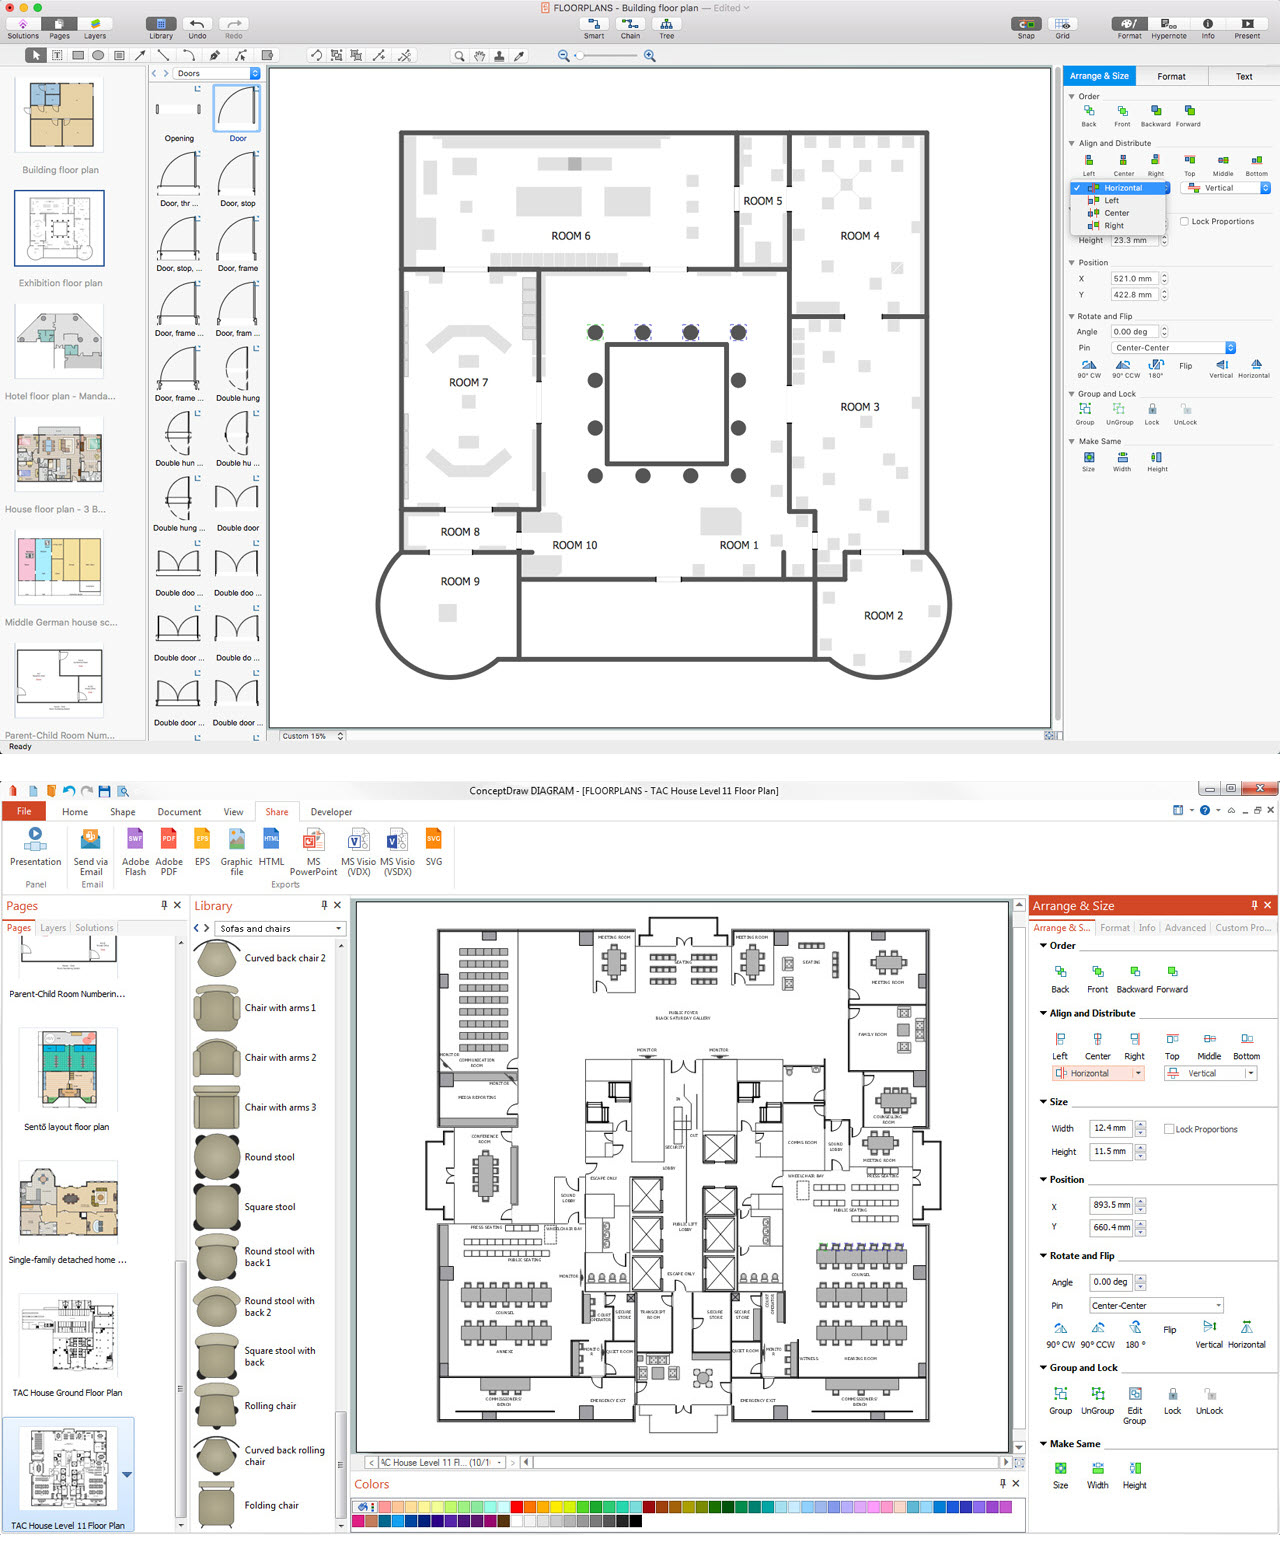
Picture: CAD Drawing Software for Architectural Designs
Related Solution:
No building project can exist without an electrical circuit map. It’s more convenient to develop electrical drawing with a proper software which would contain vector shapes and electrical symbols. This will help in the future if any problems appear.
This circuit diagram shows the scheme of a location of components and connections of the electrical circuit using a set of standard symbols. It can be use for graphical documentation of an electrical circuit components. There are many of different electric circuit symbols that can be used in a circuit diagram. Knowing how to read circuit diagrams is a useful skill not only for professionals, but for any person who can start creating his own small home electronic projects.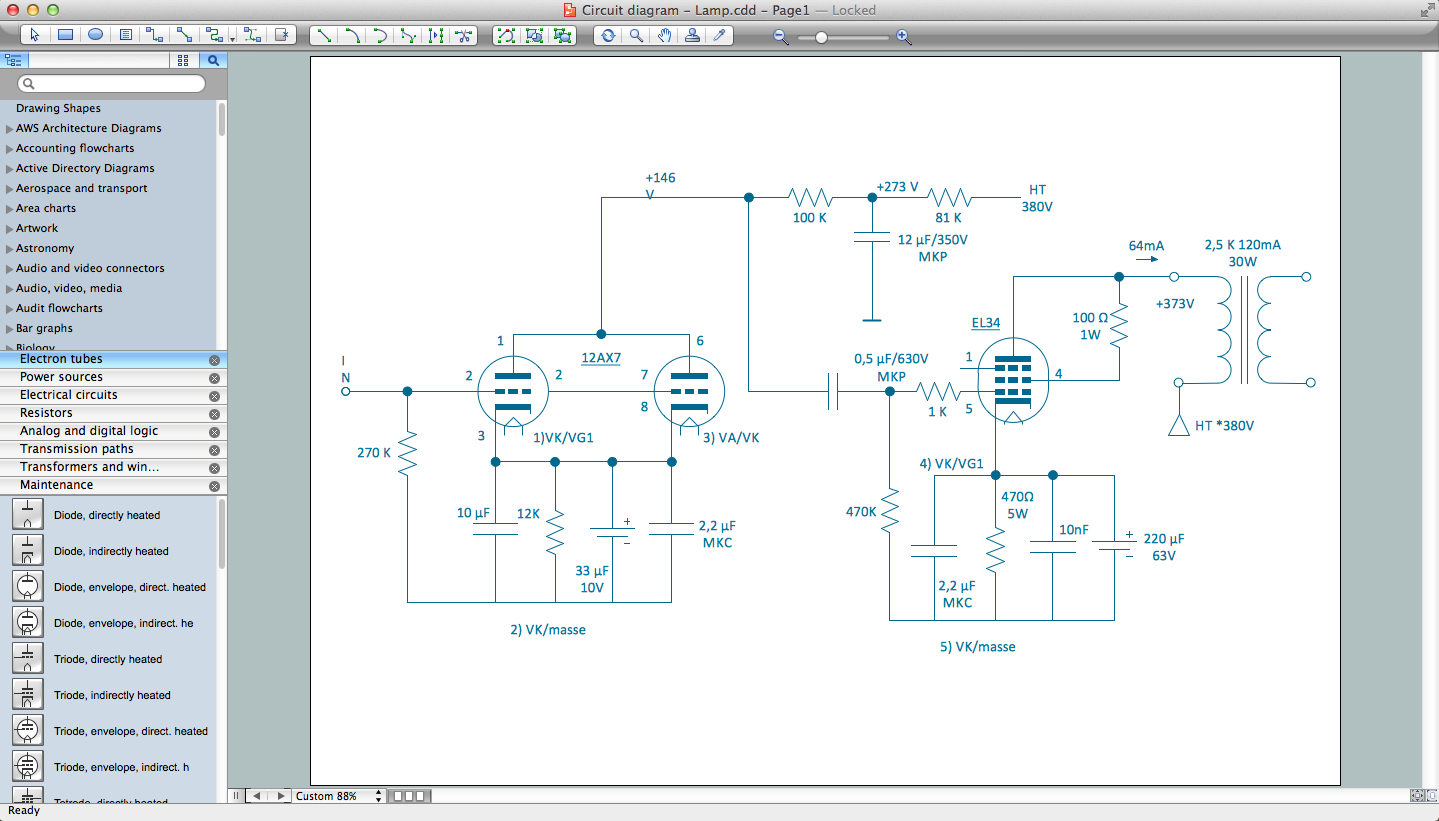
Picture: Electrical Drawing Software and Electrical Symbols
Related Solution:
Use building drawing software to develop the annotated diagrams or schematics of waste water disposal systems, hot and cold water supply systems, water lines and waste water engineering.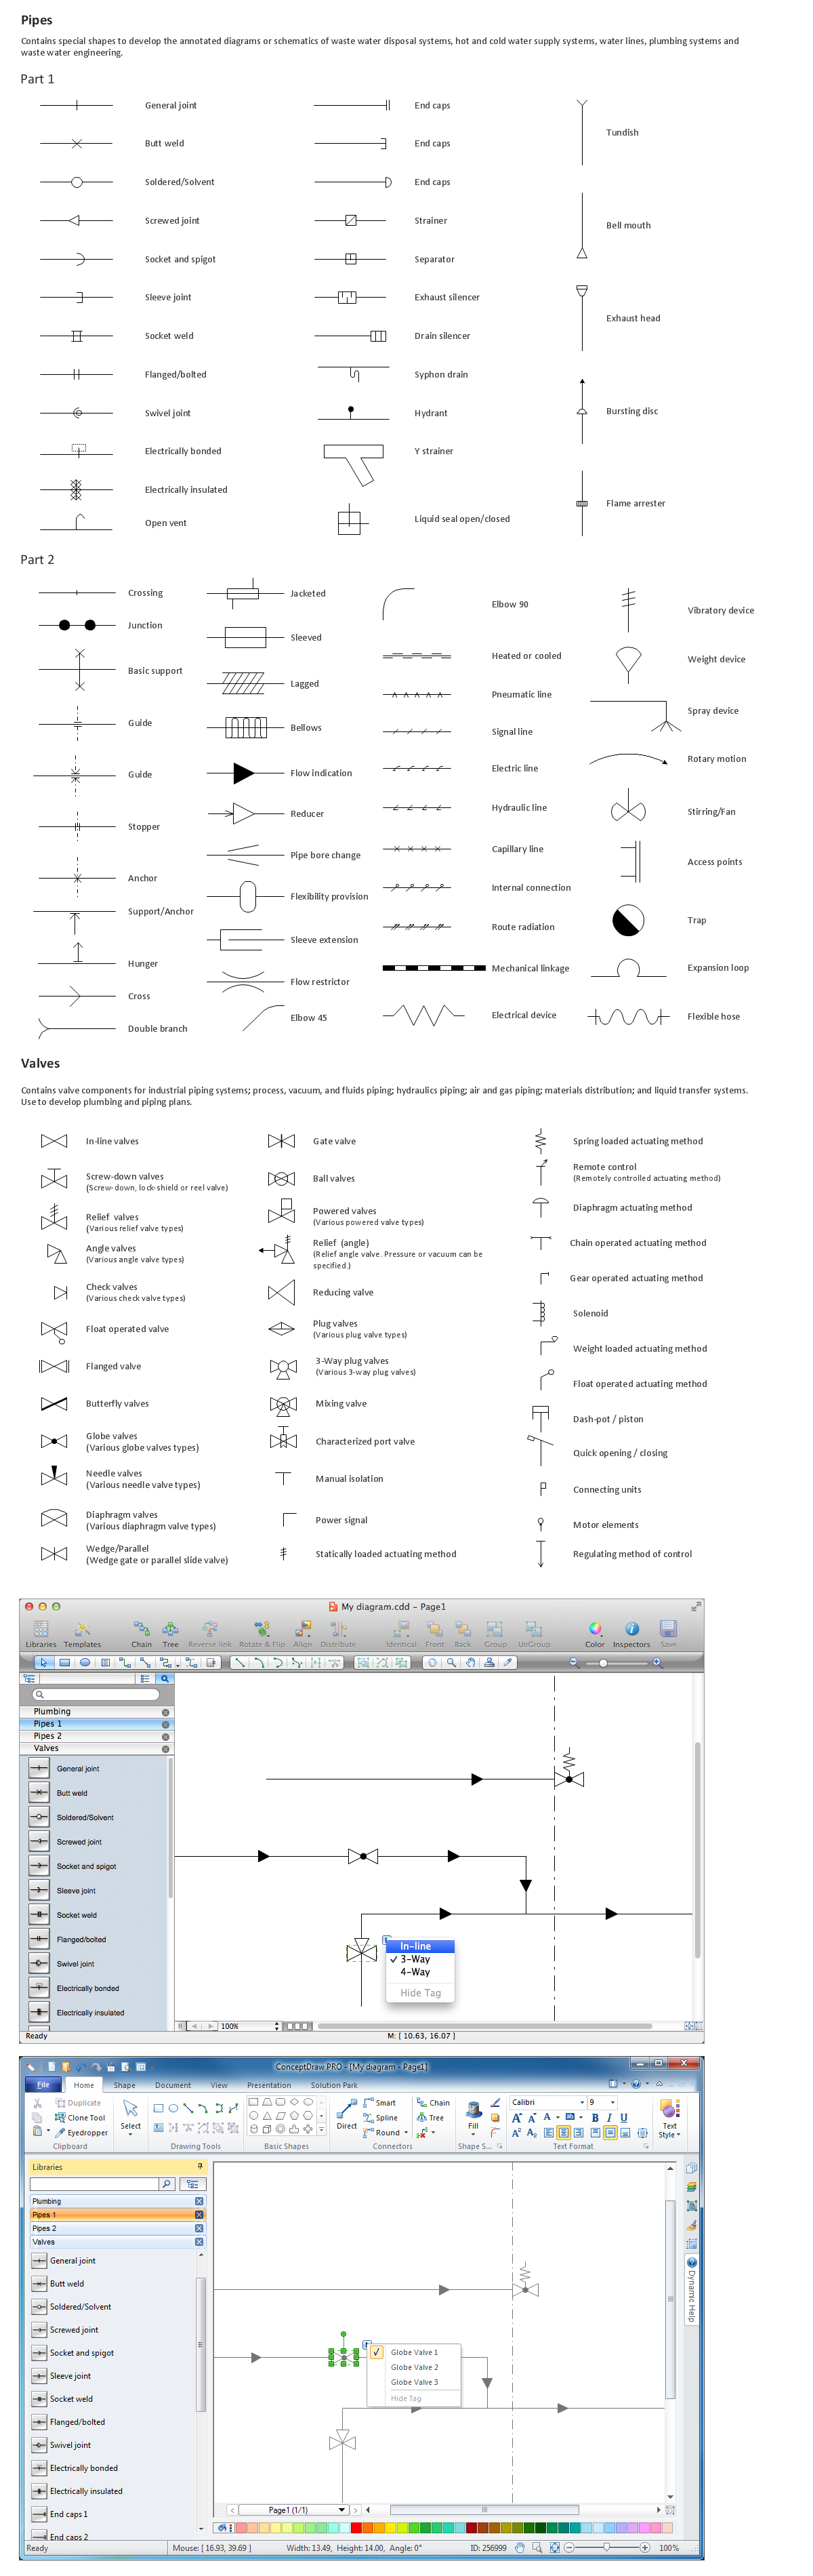
Picture: Building Drawing Software for Design Piping Plan
Related Solution:
Any building project must respond to some requirements. Moreover, finding a drawing software for developing a waste water plan is significant. Designing plumbing plans may be difficult in the beginning, but practice makes perfect.
Layout of plumbing fixtures and, kitchen equipment a is a very important part of the home's interior design. If you do not want to find out suddenly the bath in your kitchen, or stove in your bathroom, you need to pay due attention to this plan. ConceptDraw Building Plans libraries give you a number of vector objects. Using them you can quickly and professionally sketch a plan of kitchen or bathroom in proper scale and with objects depicting your desired equipment. Then your contractor never will confuse a bath with a stove and a washing machine with a toilet and your house will be really a home of your dreams.
Picture: Building Drawing Software for Designing Plumbing
Related Solution:
Video tutorials on ConceptDraw products. Try it today!
Picture: How to Draw a Bubble Chart
Related Solution: