Process Flow Graphics
A Process flow diagram (PFD) is a type of flowchart designed for industrial engineering to show the integrity of plant equipment and operations. It shows the major components of an industrial plant including principal equipment and instruments installed and a system of pipelines connecting them. Process flow diagrams are used for both large and small industry plants like power plants, oil plants, gas plants, petrochemical plants, fertilizer plants, and many others.
Currently, the list of applications of Process flow diagrams is significantly extended. They are applied in manufacturing, business, project management, chemical engineering, process engineering, and other areas. PFDs are useful to analyze, streamline, and improve business processes and construction designs. They are perfect for showing the steps of a process flow in a sequential order, documenting or modeling a process and process activities, outlining business project management tasks that need to be performed, decision stages, and changes in activity depending on the decisions. The series of events, stages, decisions, and activities are linked by arrows showing the process flow and relationships between components in the corresponding sequence.
Improvement processes is crucial to achieve success in any field, improve quality, and perform work faster. Process flow diagrams help to improve processes and quality control efficiently. They are a way to understand how a process is structured breaking down it into individual understandable segments easy to analyze and predict performance.
Clarifying processes for the team is the main way to easier communication and collaboration, ensure efficiency and in-time work performance. Because unclear processes lead to disorganization, failing tasks, disunity of team members, and are the main reason for missing project deadlines. Having a PFD designed gives a team a lot of advantages, ensures a better understanding of a business process flow, who is responsible for what tasks. It gives information about deadlines, resources and dependencies, step by step clarifying what happens in the project, who each reports to and who can reach with questions. This helps to eliminate risks of missing tasks, clarify contentious issues, and achieve greater success.
Process flow diagrams help to define, standardize, analyze, or redesign an existing process, set priorities, identify and highlight the causes of problems, bottlenecks, and fatal flaws in an operation process like excessive steps, redundancies, areas of inefficiency, inconsistency, waste of resources, undefined outcomes, unnecessary steps, gaps, barriers, repetitive tasks and other reasons that slow operation. They facilitate failure analysis and help to find opportunities for work improvement and efficiency optimization.
Process flow chart is a way of systematic planning because of the graphical representation of the relationships of inputs, outputs, and tasks within a system or process in a simple, clear, and understandable way. It is an efficient tool to create better models, arrange the process, visualize steps, and clarify the working procedures for all employees, which tasks and in what order they should be completed to exclude misunderstanding.
There are created simple or complex Process flow diagrams depending on the representing process. Even the complex process is visually represented with a PFD and makes it easier to understand it simply. One differs the high-level PFDs, which outline the major steps of a process, major system components, or major blocks of activity, and detailed lower-level PFDs, which show more details on the process, all their steps. Usually, the high-level PFDs are used at the early phases of a project and the detailed diagrams are used at the stage of project implementation. The diagram can also include interconnections to other systems.
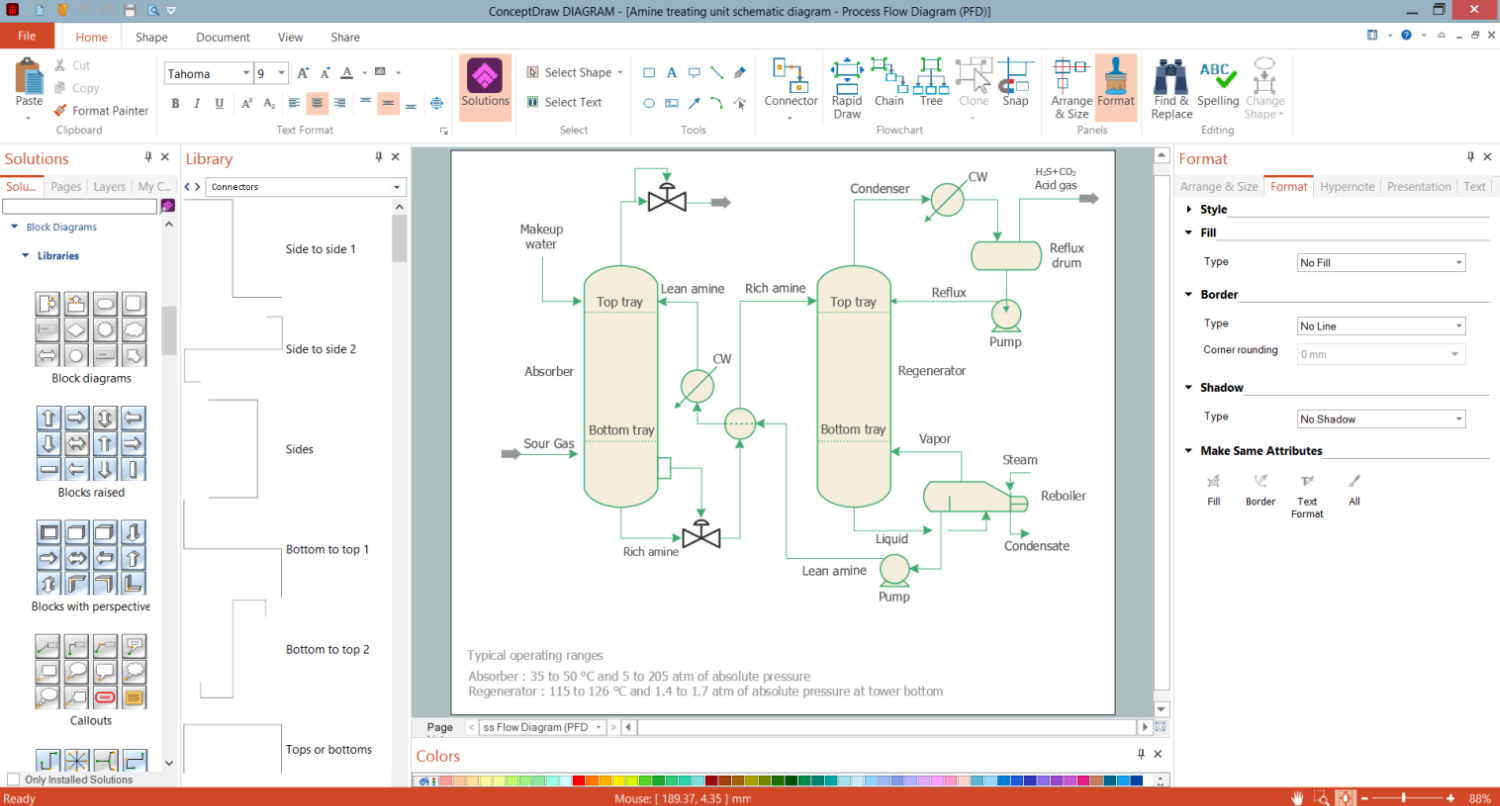
Example 1. Process Flow Graphics Design in ConceptDraw DIAGRAM
The different subtypes of PFDs include Block flow diagrams, Schematic flow diagrams, Process flow charts, System flow diagrams, Flowsheets, Piping and instrument diagrams, Top-down flowcharts, etc. Process flow diagram includes the operational data and major process parameters like temperature, pressure, density, mass-energy balance, mass flow rate, and many others. The project stages are shown in a logical sequence. Some steps happen at the same time and are parallel. The arrows are used to show the direction of the process flow. The start and end of the process should be also indicated.
The special notation with a wide set of symbols and designations is used to depict processes in the Process flow diagram. They include major equipment items such as compressors, pumps, mixers, vessels, valves, boilers, coolers, piping elements through which the process fluid or gas moves, connections, and many others. Process flow diagrams can include annotations, operating data, equipment specifications, and legend.

Example 2. Industrial Equipment Library Design Elements
ConceptDraw DIAGRAM software extended with Chemical and Process Engineering solution provides powerful drawing tools and extensive features to create Process flow graphics. Use ConceptDraw DIAGRAM to give an overview and document the overall processes, standardize and make their understanding simpler, improve quality control and training of employees, increase process efficiency, and make changes if required. It has benefits for any type of enterprise, company, department, team, etc.
Chemical and Process Engineering solution offers 8 libraries with 468 process flow design elements — industrial equipment, heating equipment, pumps, vessels, valves, fittings, and other instruments and process annotation symbols for drawing Process Flow Graphics of any kinds.

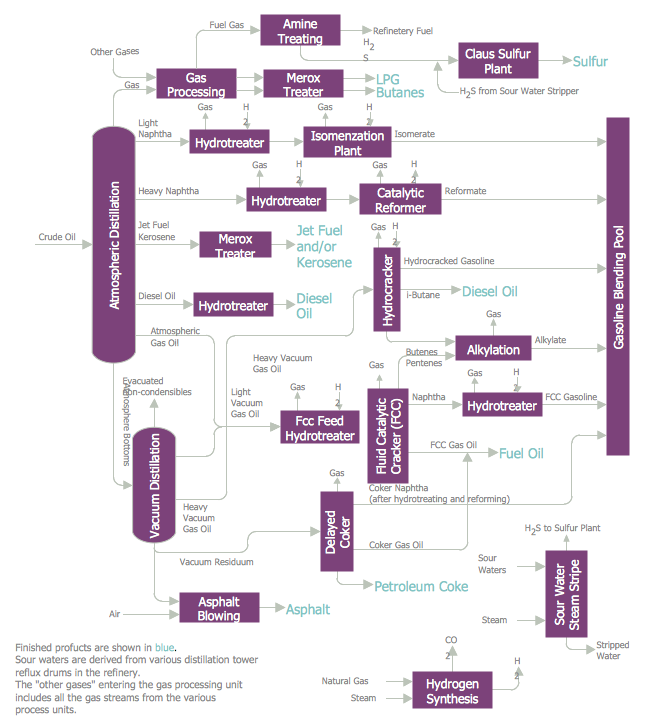
Example 3. Process Flow Diagram - Crude Oil Distillation Unit
The set of Process Flow Diagrams you see on this page was created in ConceptDraw DIAGRAM software using the Chemical and Process Engineering Solution. These samples successfully demonstrate solution's capabilities and professional results you can achieve. An experienced user spent 10-20 minutes creating each of them.
Use the Chemical and Process Engineering Solution for ConceptDraw DIAGRAM software to create your own professional-looking Process Diagrams of any complexity quickly, easily and effectively, and then successfully use them in your work and scientific activity.
All source documents are vector graphic documents. They are available for reviewing, modifying, or converting to a variety of formats (PDF file, MS PowerPoint, MS Visio, and many other graphic formats) from the ConceptDraw STORE. The Chemical and Process Engineering Solution is available for all ConceptDraw DIAGRAM users.