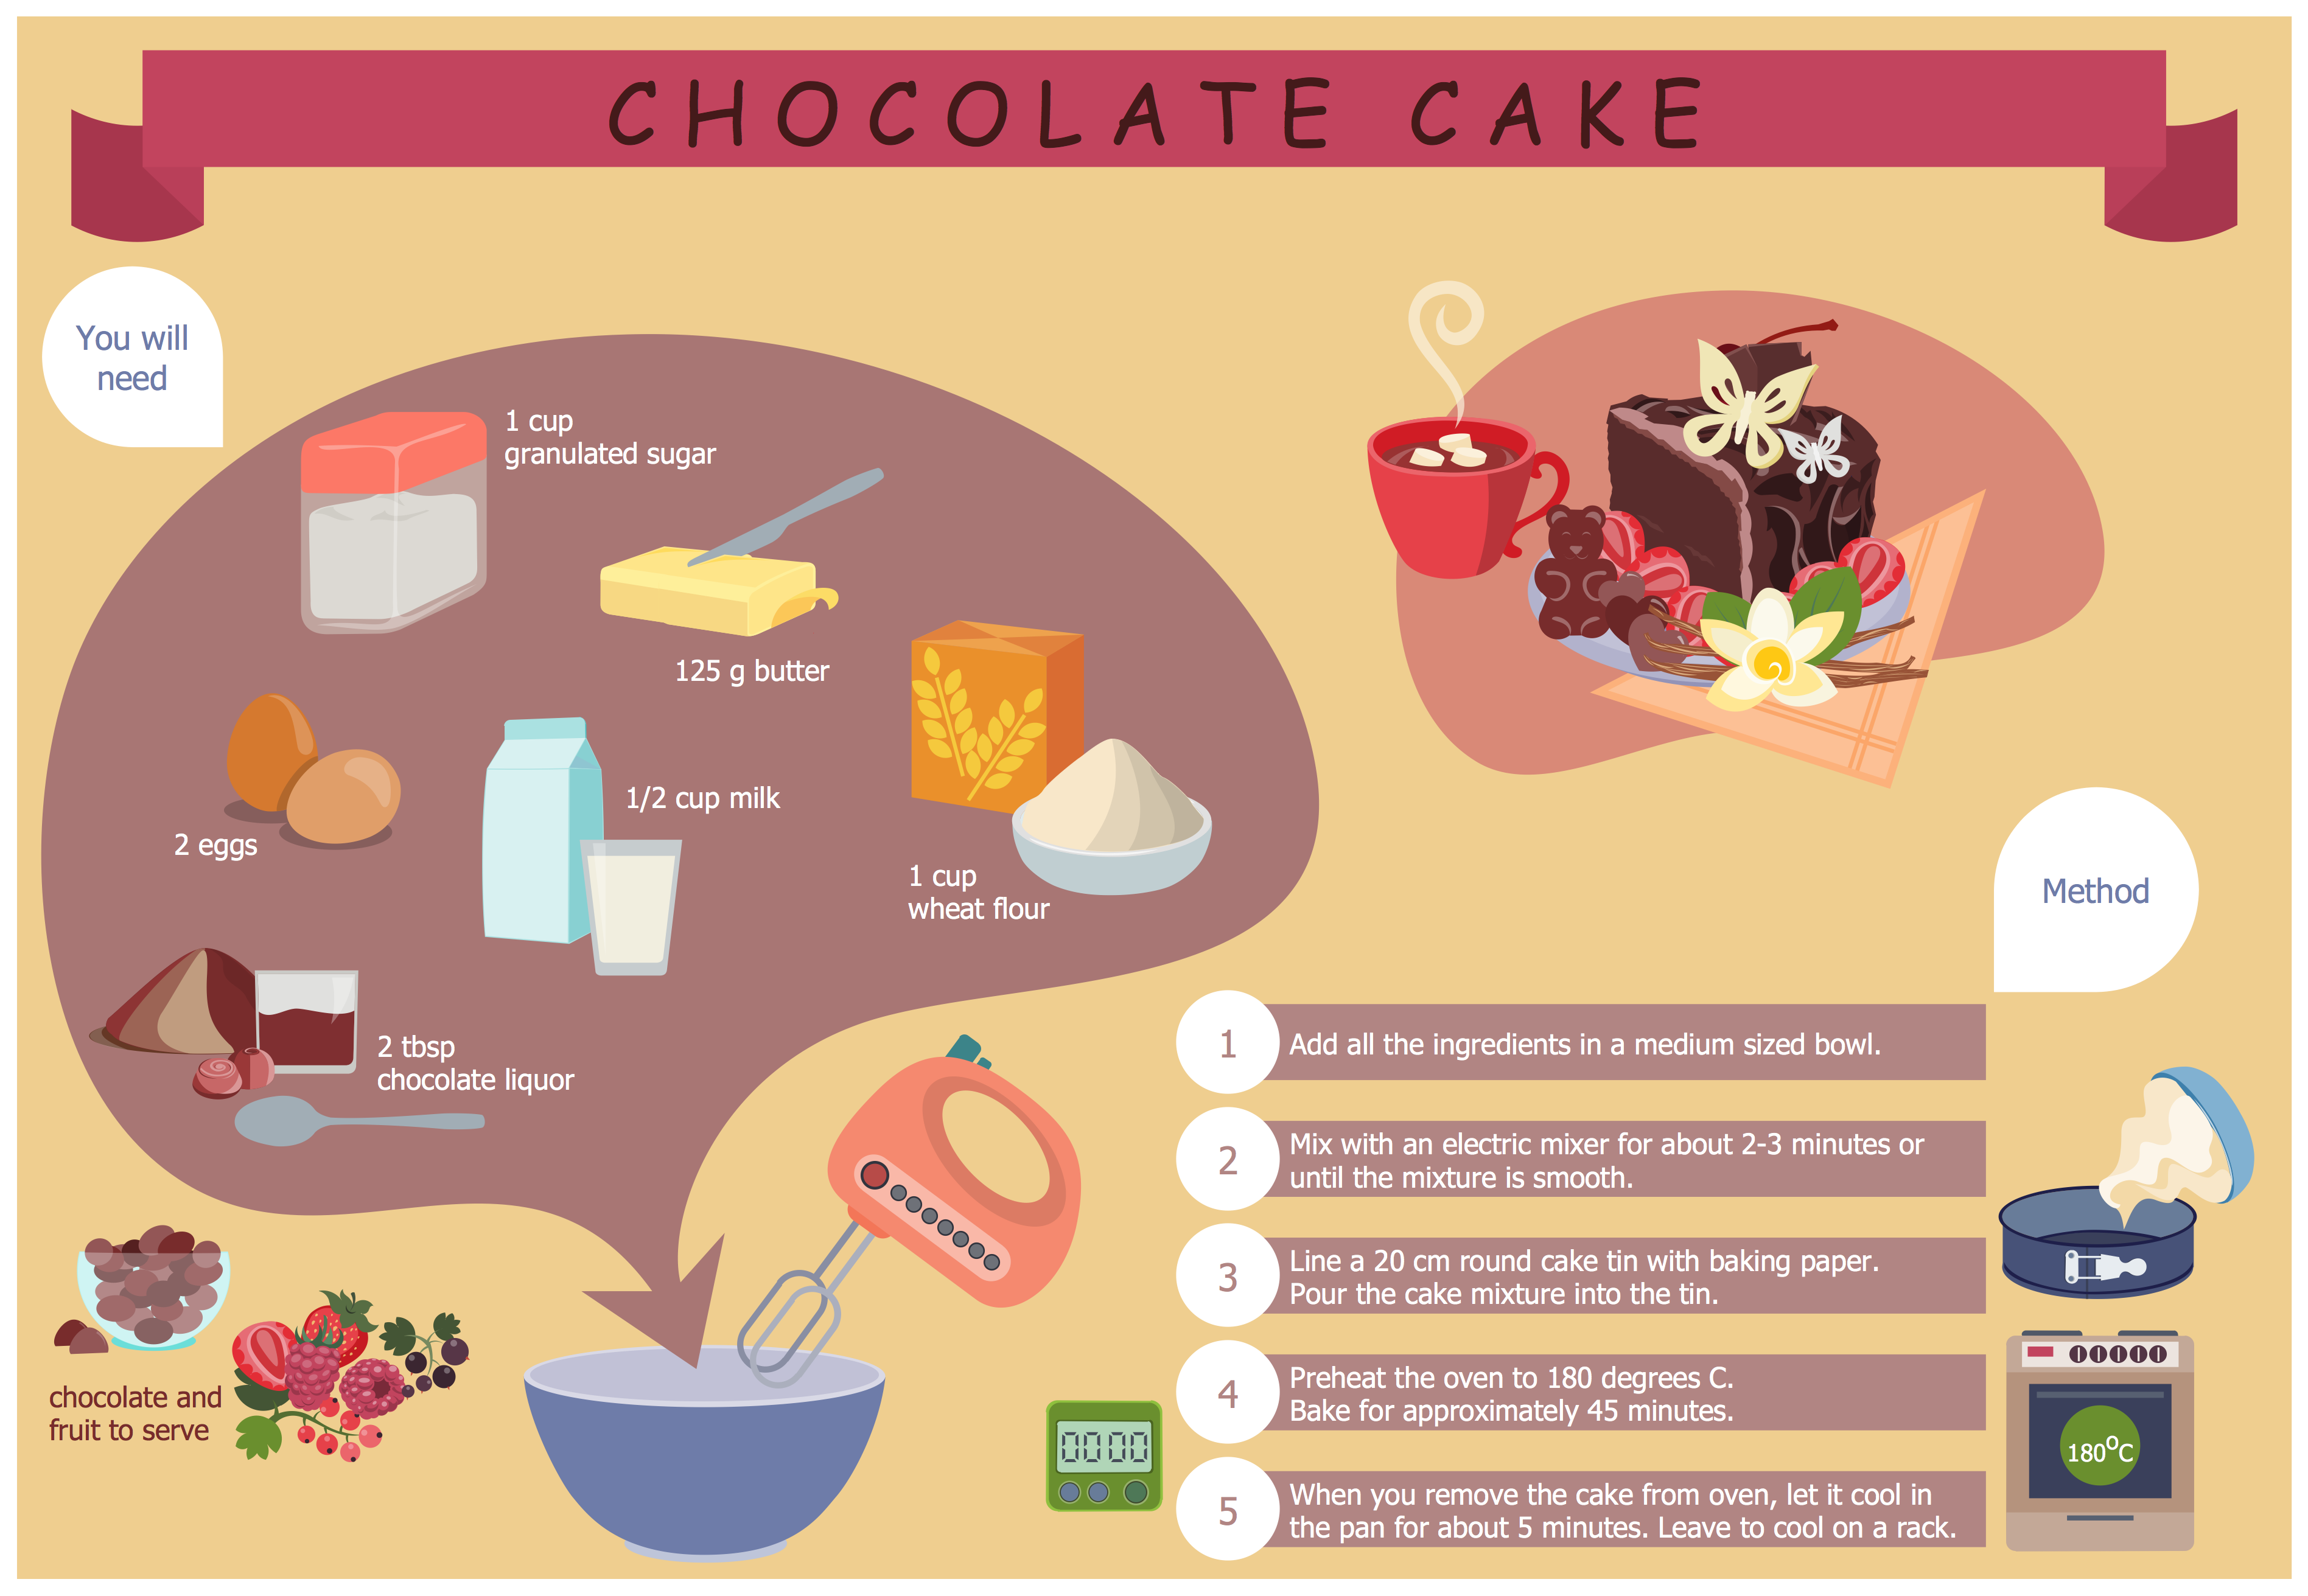
Example 1. Easy Recipes - Chocolate Cake
First of all, pay please your attention for the collection of libraries offered by Cooking Recipes Solution. It is 14 libraries with incredibly large quantity of ready-to-use objects - 565 professionally designed vector objects of foods - fish, meat, vegetables, bread, spices, drinks, delicious dishes - salads, soups, seafood, desserts, kitchen ware and cooking appliances, and many others.

Example 2. Cooking Recipes Solution in ConceptDraw STORE
Cooking Recipes Solution offers also collection of predesigned examples and samples of beautifully illustrated easy recipes. All they are represented at your disposal in Cooking Recipes section of ConceptDraw STORE.

Example 3. Easy Recipes - Veloute Sauce
The samples you see on this page were created in ConceptDraw DIAGRAM software using the Cooking Recipes Solution and demonstrate the illustrations of cooking recipes. An experienced user spent 15 minutes creating each of these samples.
Use the powerful drawing tools and vector objects from the numerous libraries of the Cooking Recipes Solution for fast and easy recipes design.
All source documents are vector graphic documents. They are available for reviewing, modifying, or converting to a variety of formats (PDF file, MS PowerPoint, MS Visio, and many other graphic formats) from the ConceptDraw STORE. The Cooking Recipes Solution is available for all ConceptDraw DIAGRAM users.
NINE RELATED HOW TO's:
When you decide to represent data without spending lots of time you can effectively generate, change, and update your presentation to best meet your needs with ConceptDraw MINDMAP.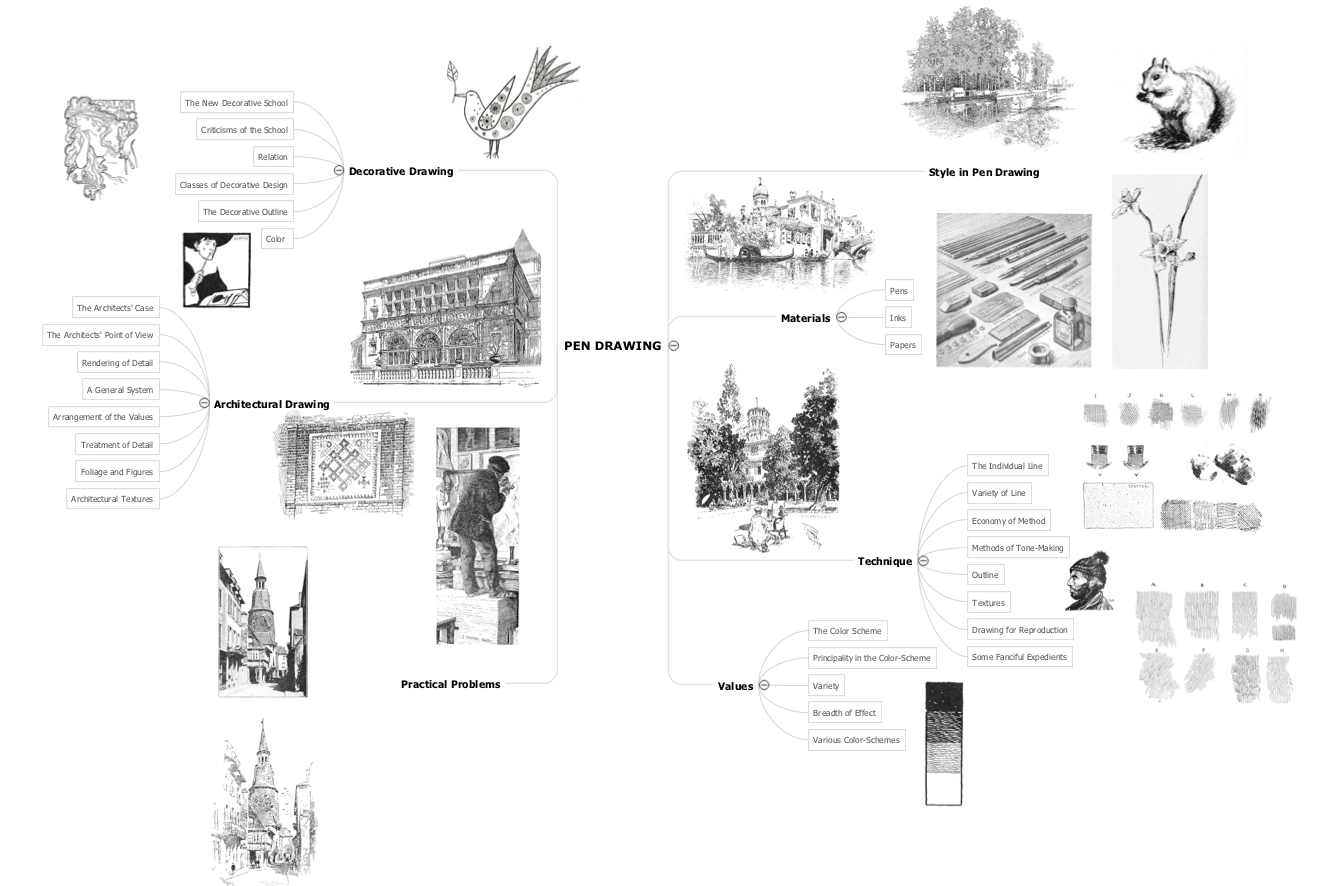
Picture: 3 Ways to Quickly Create Excellent Presentations
Related Solution:
ConceptDraw DIAGRAM is the best Value Stream Mapping software. The graphical representation of a process is a powerful tool. It helps in the diagnosis of process efficiency and allows companies to develop improved processes.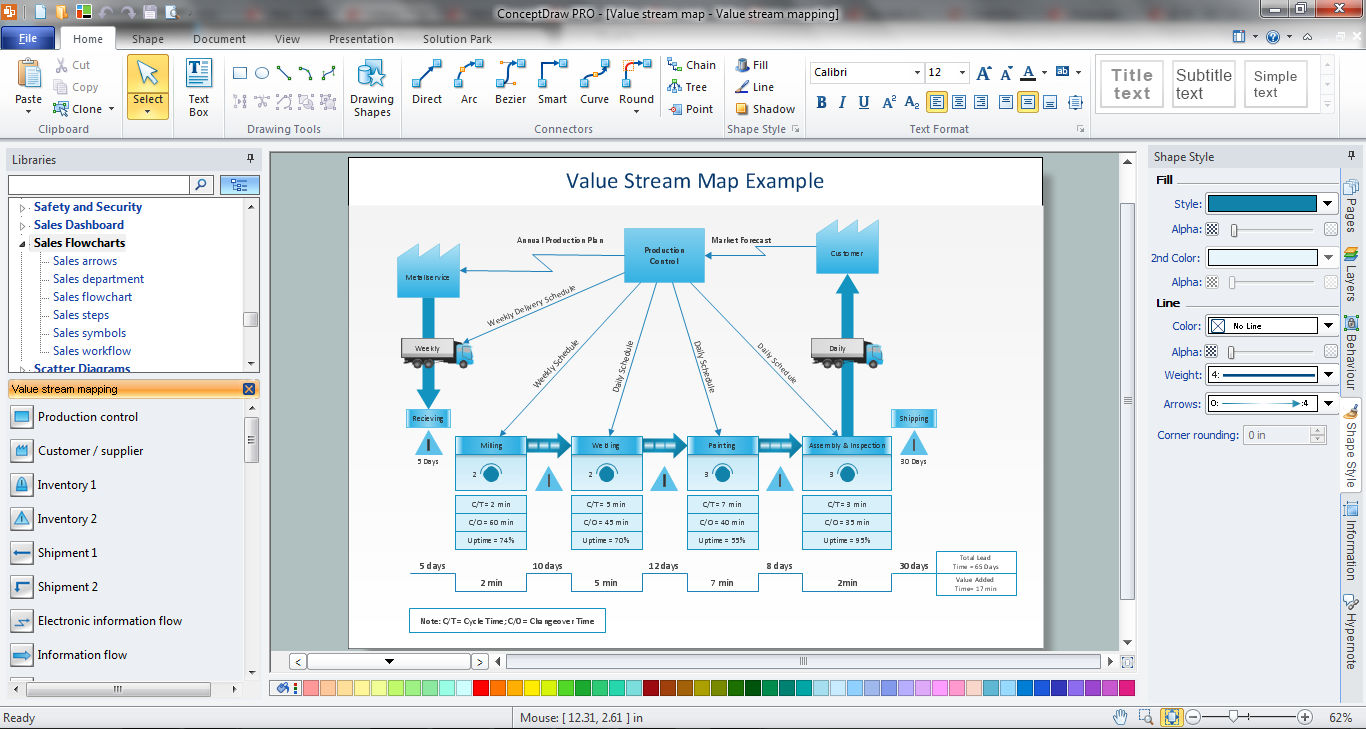
Picture: Value Stream Mapping Software
Related Solution:
High competition among the restaurants at the food court requires original design ideas. To attract visitors and increase sales are used many kinds of advertising products, brightly colored signboards, menus and show-cases, often are used the molds of beautifully decorated dishes. Now designing of colorful F&B (food and beverage) materials is easier than ever thanks to the ConceptDraw DIAGRAM diagramming and vector drawing software extended with Food Court Solution from the Food and Beverage Area of ConceptDraw Solution Park.
Picture: F&B
Related Solution:
In case you need to make a plan for your own future hotel or to do it for someone else, then you can always find the way to make such template very quickly and to have a very good looking result in the end. Whichever type of the hotels you want to illustrate in a way of a floor plan, you can always do it with ConceptDraw DIAGRAM drawing application.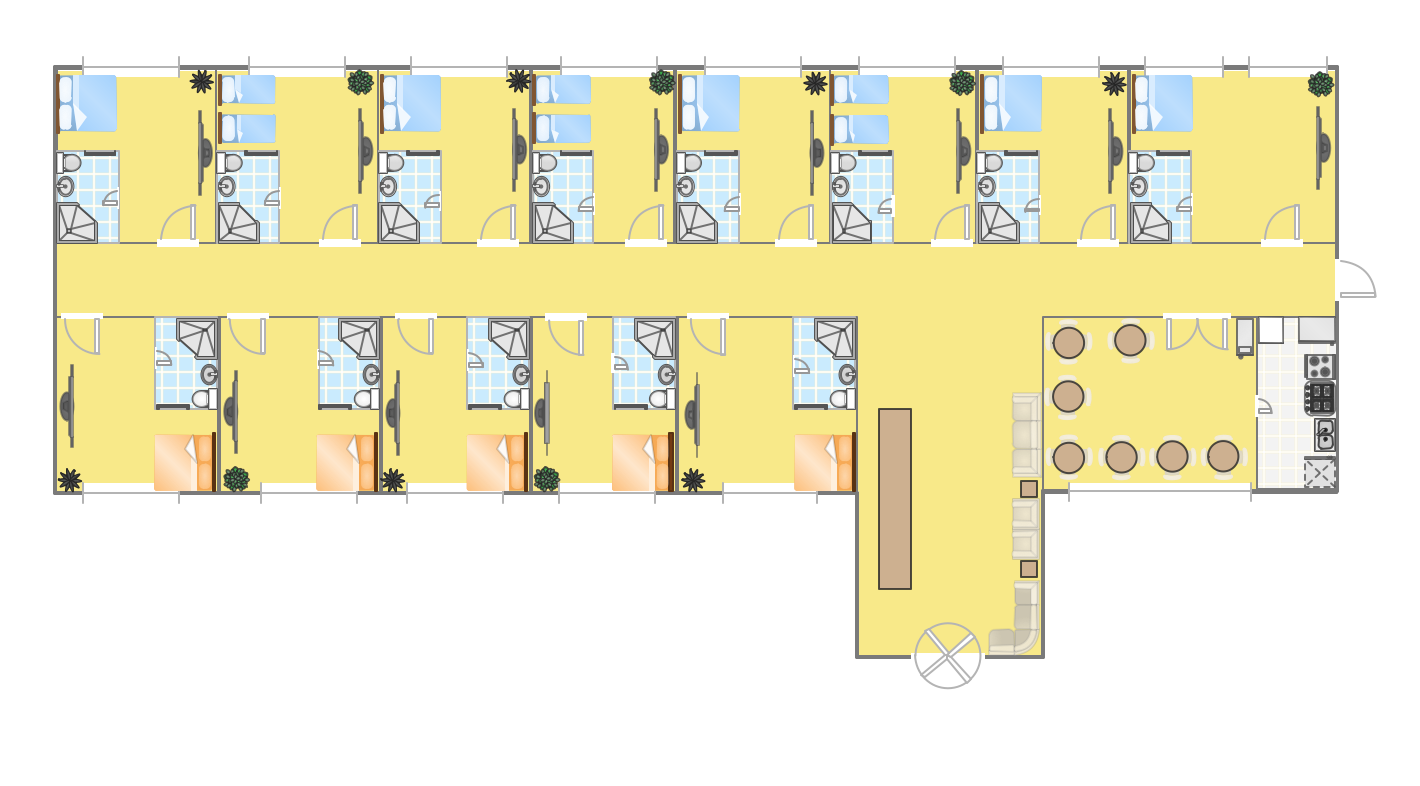
Picture: Hotel Plan. Hotel Plan Examples
Related Solution:
A family evening in a restaurant can be just charming, the problem is to find a one. If you spend an extra day to create a good restaurant floor plan, that will surely brings more clients. By the time your restaurant gets more popular, don’t forget about the quality of service.
The restaurant floor plan you see on this page was made with ConceptDraw DIAGRAM in accompanied with Cafe and Restaurant Plans solution. It introduces facilities of the solution and demonstrates the results, you can obtain if you deploy ConceptDraw tools for generating floor plans and interior designs for cafe, restaurants or other catering establishments. A little less than three hundred vector objects, and a set of built-in templates and a set of examples will maintain your creativeness.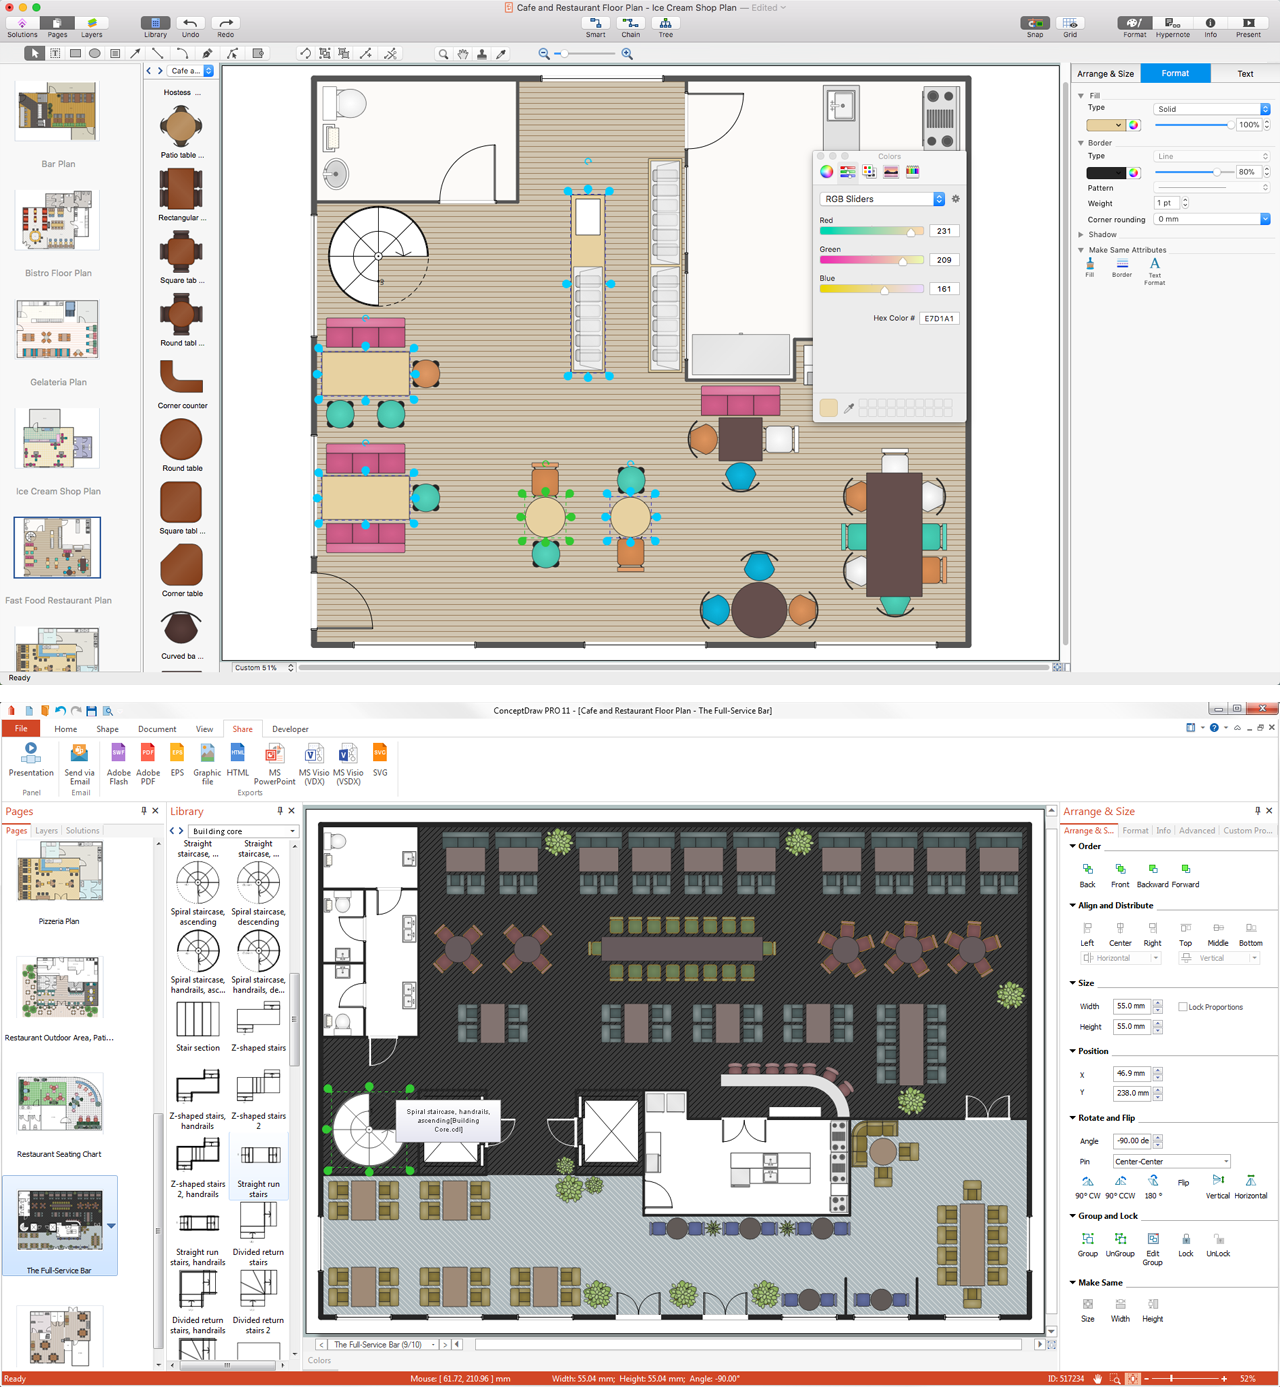
Picture: Restaurant Floor Plans
Related Solution:
Do you like the professional schemes that you can find on the Internet? Take into account that the most part of them is made using the Best Flowchart Software and Flowchart Symbols. Try you own powers in creating such diagrams!
Flowcharts are the most business diagramming tool. If you are a business manager, you can use flow chart to depict work flow in your organization, develop the effective organizational structure and present the information to investors or other stakeholders. Combining the smart management solutions with ConceptDraw DIAGRAM diagramming engine delivers the set of comprehensive flowchart tools necessary to support professionals in their creativeness and business activity.
Picture: Best Flowchart Software and Flowchart Symbols
Related Solution:
ConceptDraw DIAGRAM is a powerful software that helps you create professional and easy drawing diagrams for business, technology, science and education.
Picture: Create Sophisticated Professional Diagrams - Simply
Bubble Charts are convenient way to visualize ideas and concepts by organizing them in a hierarchy. To show the importance of ideas you can use different bubble sizes and colors. ConceptDraw DIAGRAM diagramming and vector drawing software extended with Business Diagrams Solution from the Management Area affords you the easiest and fastest way for designing professional-looking Bubble Charts.
Picture: Bubble Charts
Related Solution:
Variable delay elements are often used to manipulate the rising or falling edges of the clock or any other signal in integrated circuits. Delay elements are also used in delay locked loops and in defining a time reference for the movement of data within those systems.
26 libraries of the Electrical Engineering Solution of ConceptDraw DIAGRAM make your electrical diagramming simple, efficient, and effective. You can simply and quickly drop the ready-to-use objects from libraries into your document to create the electrical diagram.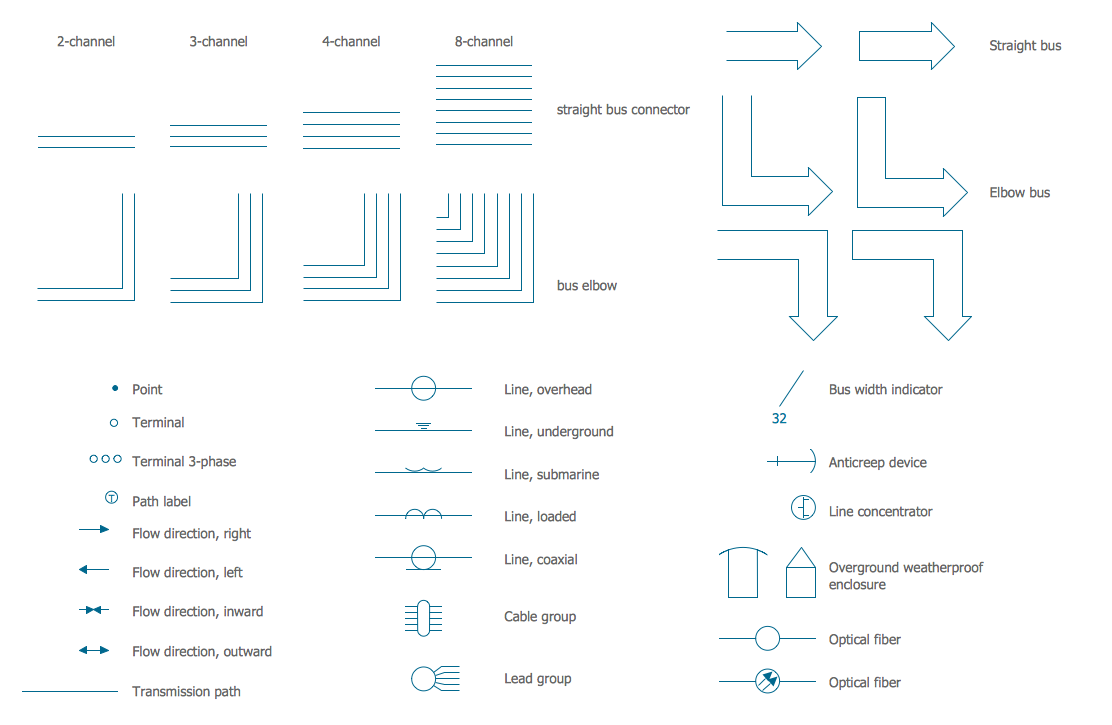
Picture: Electrical Symbols — Transmission Paths
Related Solution:

