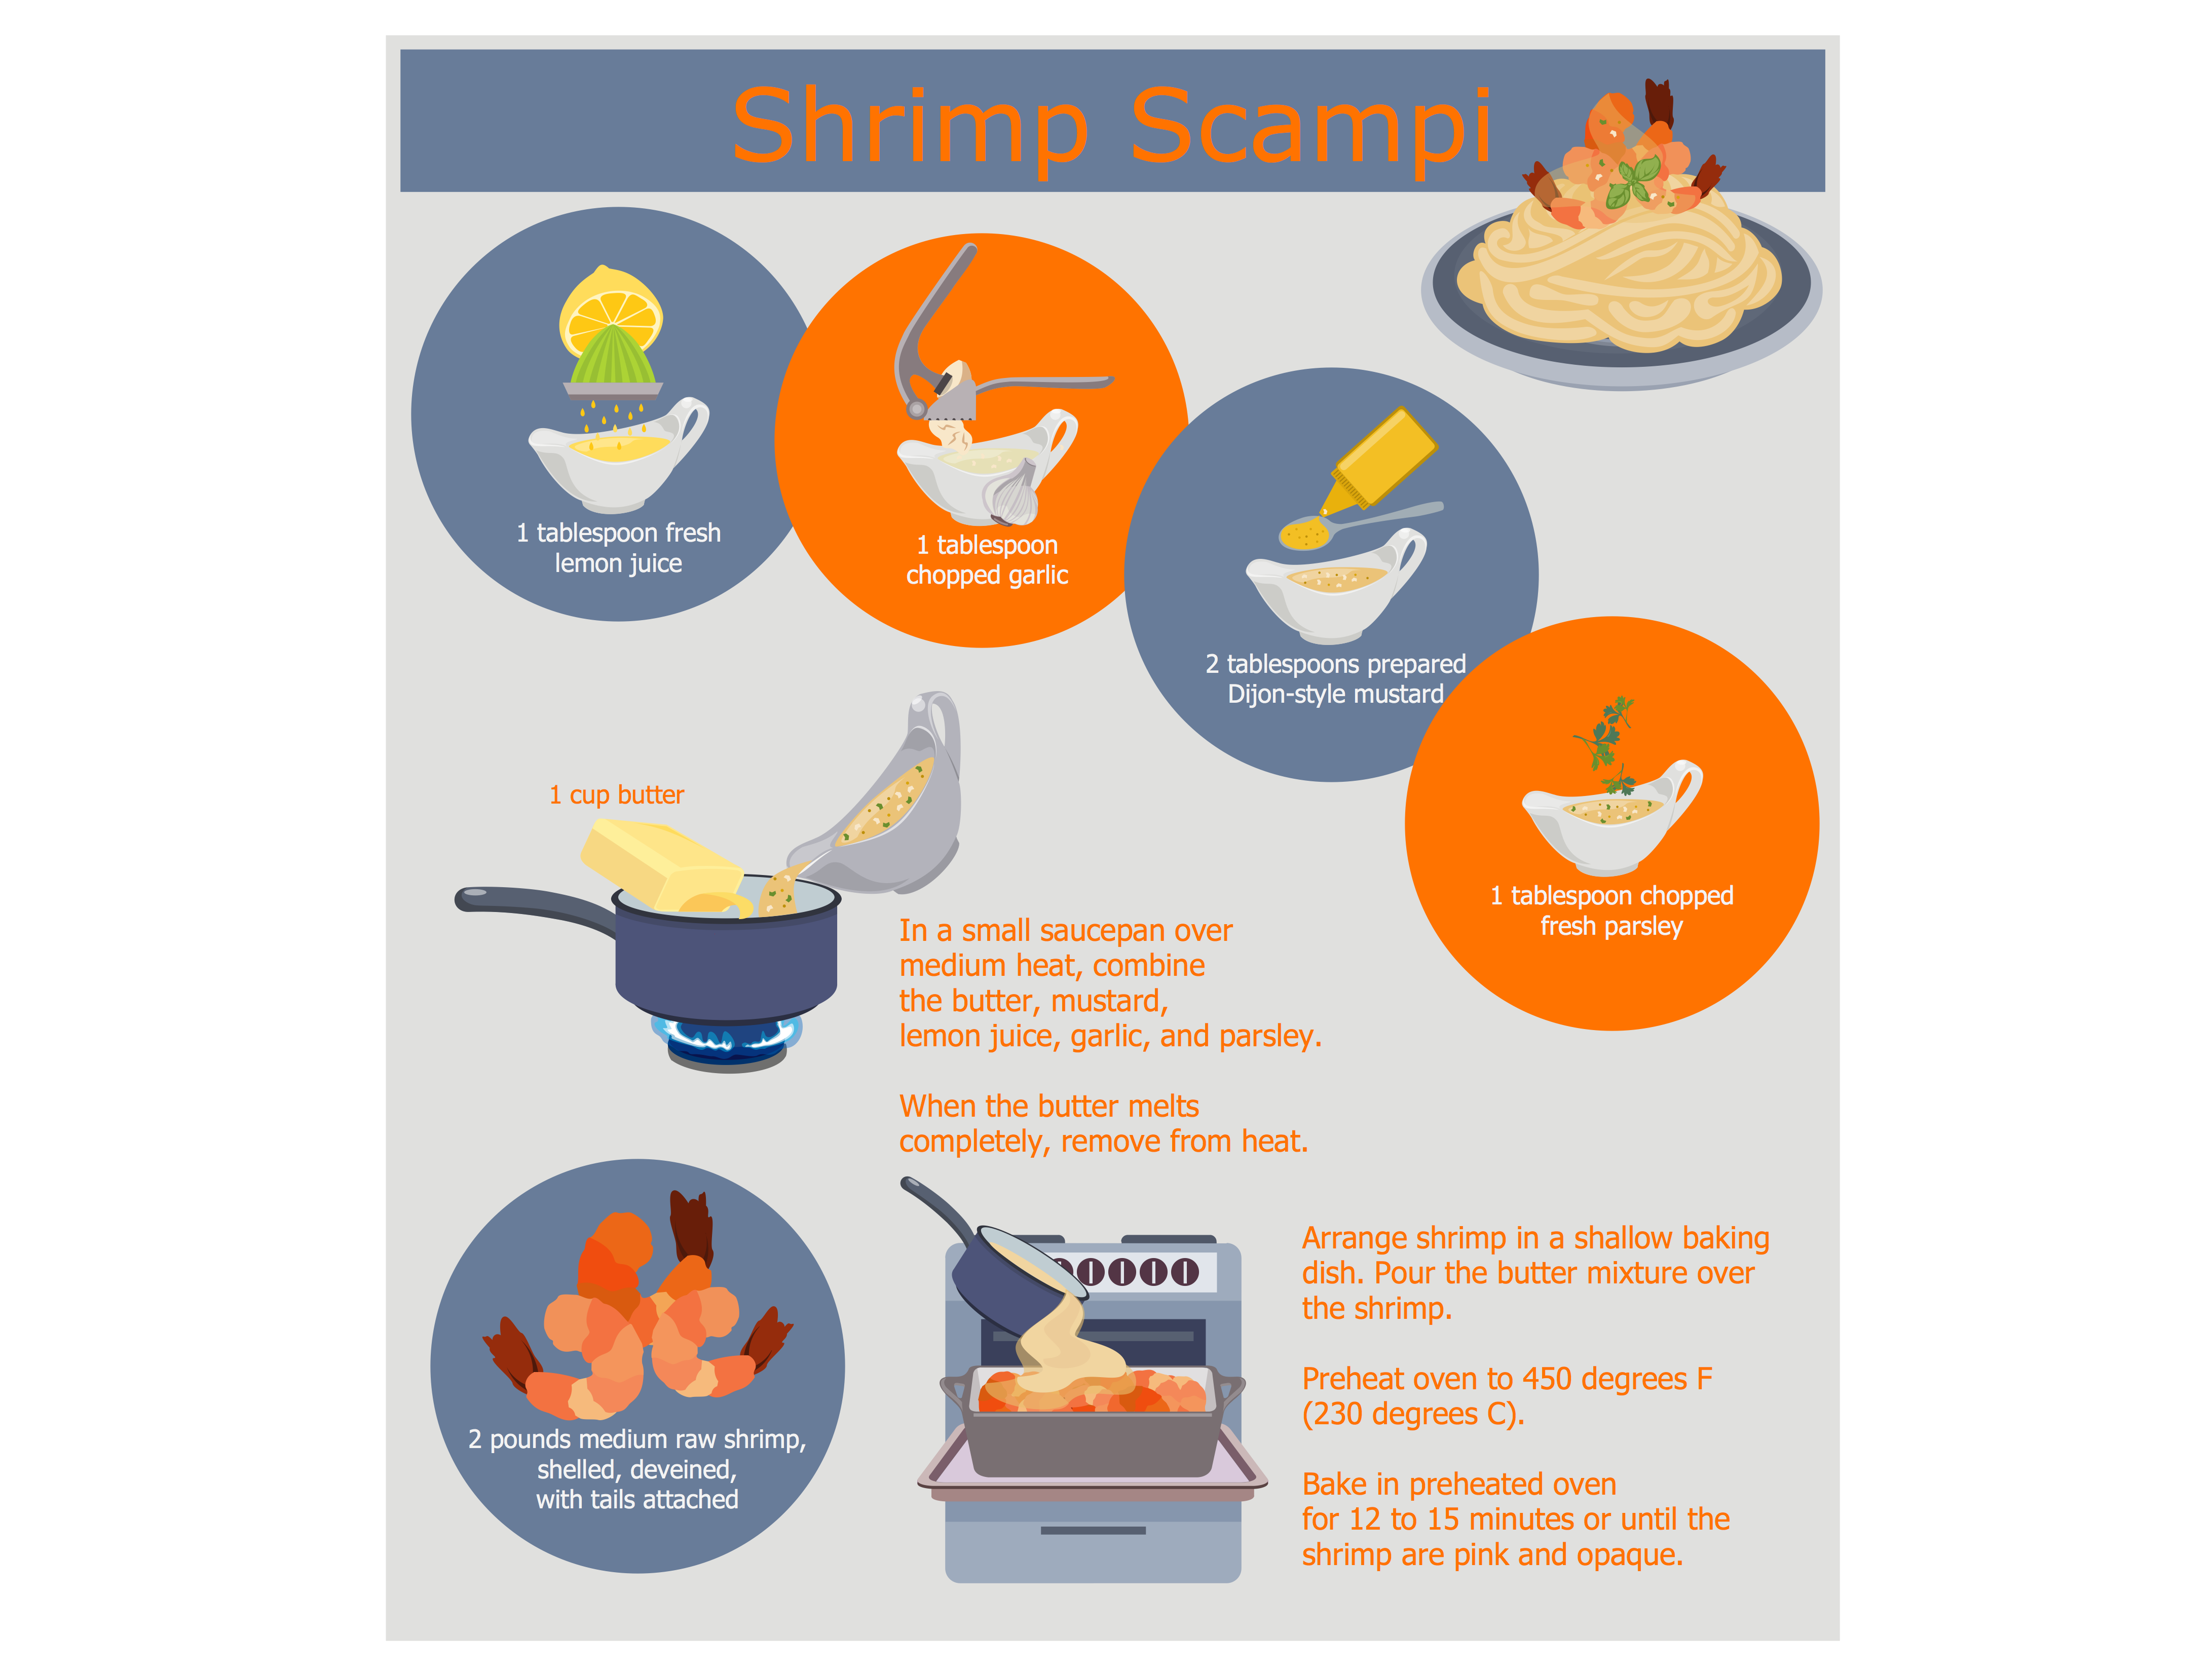
Example 1. Dinner Recipes - Shrimp Scampi
Cooking Recipes Solution offers large collection of predesigned illustrations with cooking recipes, including the appetizing dinner recipes, and 14 libraries with 565 vector objects and clipart:
- Bread and Baking
- Breakfast
- Cooking Appliances
- Cookware and Bakeware
- Desserts
- Drinks
- Fish, Seafood, Sushi
- Kitchen Knifes, Spoons and Forks
- Kitchen Utensils
- Meats
- Salads, Side Dishes and Vegetables
- Soups, Stocks, Stews, and Sauces
- Spices, Herbs, Condiments
- Tableware

Example 2. Dinner Recipes - Fig and Goat Cheese Salad
Numerous objects included in libraries of the Cooking Recipes Solution are incredibly beautiful, colorful and pictorial! They allow you represent any of your cooking ideas, easy illustrate any recipe, decorate cookbook, menu, or any other food image which you want.

Example 3. Dinner Recipes - Chocolate Cake
The samples of dinner recipes you see on this page were created in ConceptDraw DIAGRAM software using the Cooking Recipes Solution. An experienced user spent 10-15 minutes creating each of these samples.
Use the tools of the Cooking Recipes Solution for drawing your own food illustrations and images with dinner recipes of any complexity quick, easy and effective.
All source documents are vector graphic documents. They are available for reviewing, modifying, or converting to a variety of formats (PDF file, MS PowerPoint, MS Visio, and many other graphic formats) from the ConceptDraw STORE. The Cooking Recipes Solution is available for all ConceptDraw DIAGRAM users.
TEN RELATED HOW TO's:
Use ConceptDraw DIAGRAM software as a powerful audit application. 🔸 Create professional Audit Workflow Diagrams and Audit Process Flowcharts to ✔️ plan and implement audit process, ✔️ enhance financial transparency, ✔️ improve financial reporting, ✔️ streamline operations, ✔️ improve business efficiency, ✔️ identify risks and issues, ✔️ prevent financial fraud, ✔️ track progress, ✔️ enhance trust
Picture: Understanding the Audit Process: A Comprehensive Guide. Audit Process Flowchart
Related Solution:
Matrix organizational structure is one of the main forms of structures which is actively used by organizations to carry forth the functions of a company visually and effectively.
Now we have ConceptDraw DIAGRAM diagramming and vector drawing software extended with 25 Typical Orgcharts solution from the Management area of ConceptDraw Solution Park which will help easy represent matrix organizational structure of any degree of complexity.
Picture: Matrix Organization Structure
Related Solution:
A process flow diagram (PFD) is a diagram commonly used in chemical and process engineering to indicate the general flow of plant processes and equipment.
ConceptDraw DIAGRAM diagramming and vector drawing software extended with Flowcharts Solution from the Diagrams Area of ConceptDraw Solution Park offers the extensive drawing tools for quick and easy design professional looking Process Flow Diagrams.
Picture: Process Flow Diagrams
Related Solution:
In the course of recent decades data visualization went through significant development and has become an indispensable tool of journalism, business intelligence and science. The way visual information may be conveyed is not limited simply to static or dynamic representation, it can also be interactive. Infographics can be conditionally divided into several general levels. Primarily, this is level of visualization of information, its interpretation and association on any ground. Second level can be defined as a visualization of knowledge, depiction of thoughts and ideas in the form of images or diagrams. Finally, the level of data visualization, which processes data arrays in charts, enabling the information to be more clearly perceived. You can also identify the main approaches to the creation of infographics: exploratory and narrative. Exploratory method insists on minimalist design in favor of data precision without unnecessary details and is common for scientific researches and ana
Picture: Design Pictorial Infographics. Design Infographics
Related Solution:
Cause and Effect Diagrams are designed to identify the potential factors that cause an overall effect. The causes are grouped into the categories, each cause is a source of variation.
ConceptDraw DIAGRAM powerful diagramming and vector drawing software provides the Fishbone Diagrams solution from the Management area of ConceptDraw Solution Park that allows to design the Cause and Effect Diagrams quick, easy and effective.
Picture: Cause and Effect Diagrams
Related Solution:
In software engineering, it is important to understand how the system would cooperate with external sources, like data sources. To give this information a visual representation, data flow diagrams (DFD) were used for years. The entire system is usually divided into smaller ones, and all of them process data flows in appropriate ways.
The visualizing business processes which engages the data transfer, is commonly preformed using DFDs (data flow diagrams). DFD is used to show the data flow processing and transformation. This DFD represents the electronic system of a customer purchase. It was created using Gane/Sarson notation. Data flow diagrams helps you to sort through and clarify transferring process making it available for analysis, and representation. ConceptDraw DFD solution introduces the vector library, containing the full set of icons from DFD notations.
Picture: Data Flow Diagram (DFD)
Related Solution:
Nowadays, a constructor needs skills in various areas. For instance, knowing How To use Appliances Symbols for Building Plan, can be useful in developing illustrations for customers. Aware means armed.
This image shows the content of the Appliances library that is a component of the ConceptDraw Floor Plans solution. Being used with ConceptDraw DIAGRAM drawing facilities, this library allows you to create floor plan and interior design for your new family residence and its, undoubtedly the most important section such as kitchen and bathroom. As considering your kitchen arrangement and developing the properly variant for your apartment, one of the main points is the complete layout of the kitchen and its appliances. The vector graphical objects supplied with ConceptDraw Floor plans solution by allows you easily display the most original ideas of kitchen and bathroom layout.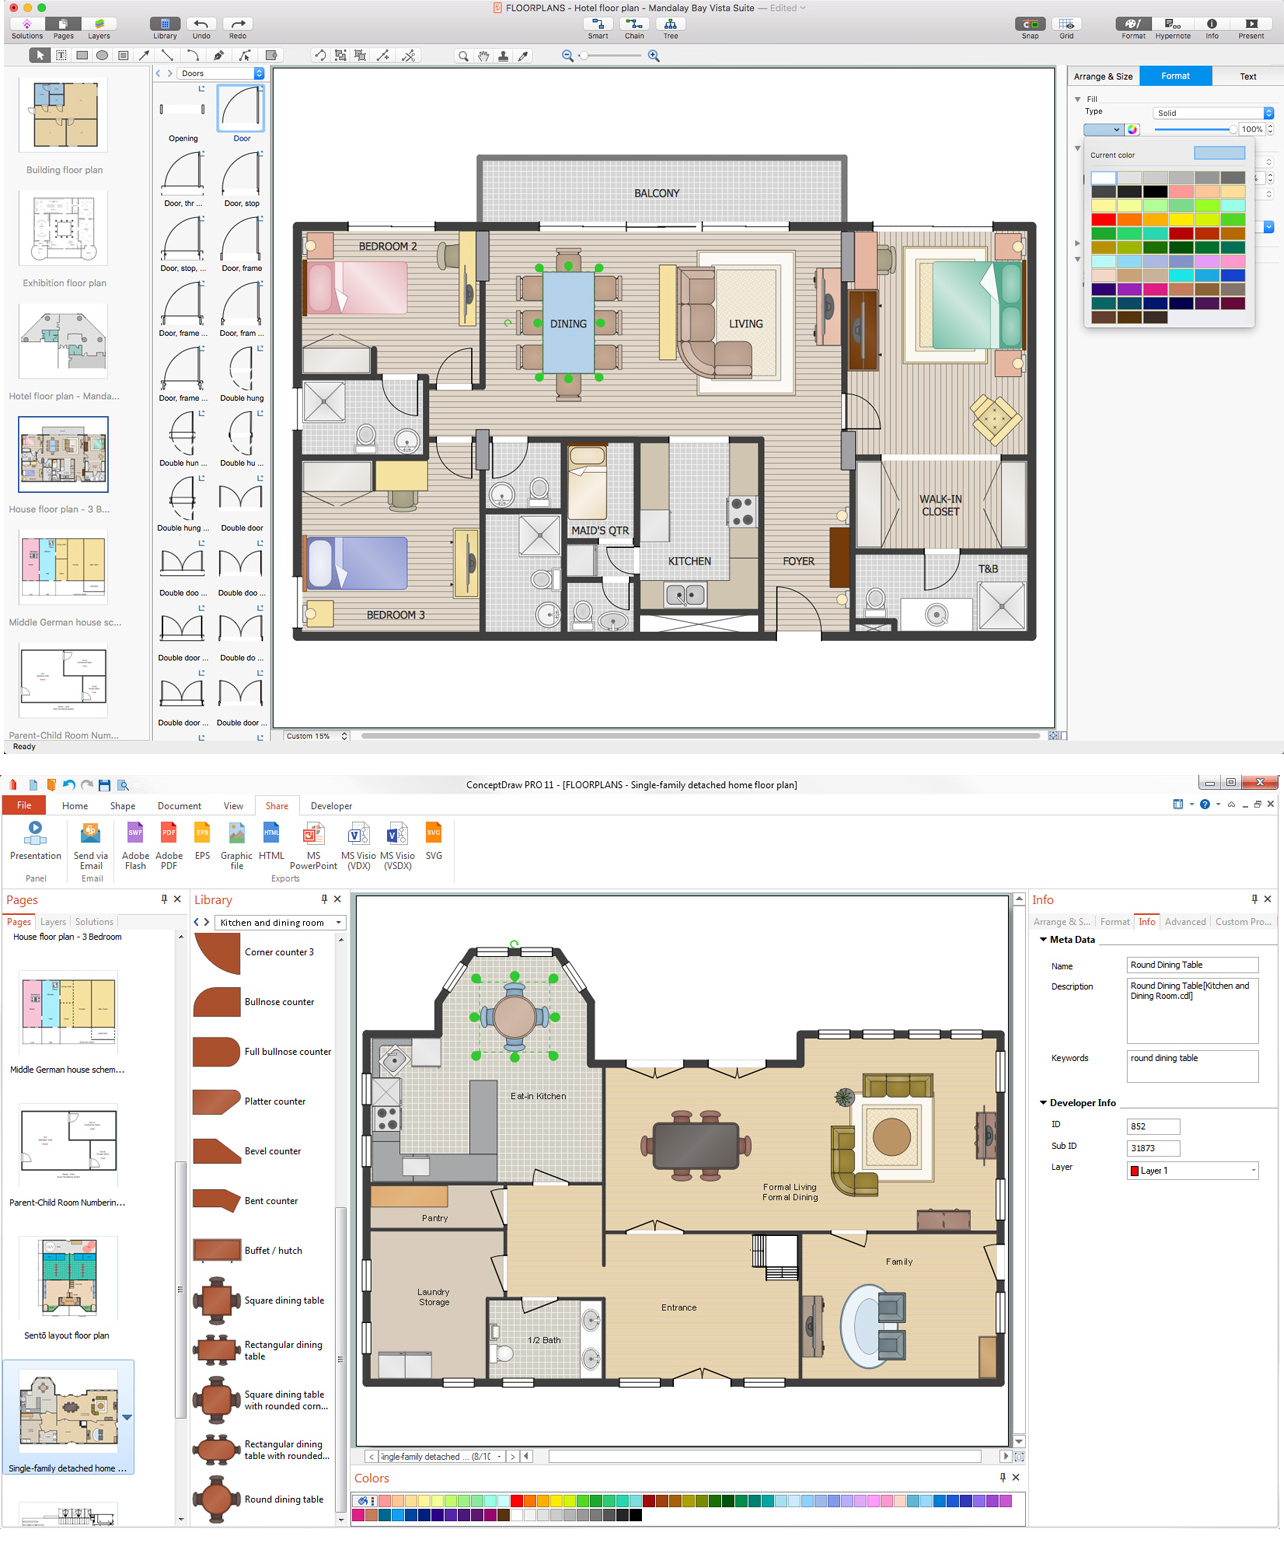
Picture: How To use Appliances Symbols for Building Plan
Related Solution:
Create your own flow charts of purchasing business processes using the ConceptDraw DIAGRAM software
Picture:
Purchasing Flowchart - Purchase Order
Flowchart Examples
Related Solution:
This sample shows the Flowchart of the ACC general account creation. This Flowchart describes the Start point, the process of the handling the user requests and the End point – creating of the account. The shapes represent the subprocesses and the arrows between the shapes shows the sequence of the actions.
This sample was created in ConceptDraw DIAGRAM diagramming and vector drawing software using the Flowcharts solution from the Diagrams area of ConceptDraw Solution Park.
Picture: Examples of Flowchart
Related Solution:
Explore practical flowchart examples including business process diagrams, workflow charts, swimlane flowcharts, and IT troubleshooting flows. Review common patterns and start from ready templates.
Picture: Flowchart Examples
Related Solution:

