Stakeholder Onion Diagrams
The word "stakeholder" has become more commonly used nowadays meaning an organization or an individual having a legitimate interest in some project or some entity within the business corporations of different sizes (but usually the large once, government agencies and non-profit organizations, such a charitable one. The mentioned concept is the one including everyone with an interest also called as a "stake" in what the entity does. This includes not only its vendors, customers and employees, but also different members of a community if which its factory or offices may affect the local environment economy.
Thus, the "stakeholder" term includes all persons paying into the so called “figurative stake” as well as the persons to whom such stake may be "paid out". So, all organisation's managers have to be aware of the stakeholders and understand their wishes and expectations, as well as their attitude, which is known to be supportive, opposed or simply neutral. Only in this way it can becomes possible to manage and to effectively engage with a community of stakeholders. It is also needed to prioritize all the members of the community for being able to focus the organisation's scarce resources on the most of the existing significant stakeholders as any action taken by any group or any organization can affect those who are linked with them within the so called “private sector.”
There are known to be a few different “types” of stakeholders, such as primary once, secondary and the excluded ones. The first ones are known to be the internal ones. They are expected to be engaged in different economic transactions with the business, such as other stockholders, suppliers, customers, employees and creditors. The second mentioned group is known to be including the so called “external stakeholders”. Those, who are included in such group, are not engages in the direct economic exchanges with the business, being affected by its actions. As an example, we can mention the communities, general public, activist groups, media and different business support groups. The last group includes the so called “excluded stakeholders”, known to be the “disinterested public” for a reason of them having no economic impact on business.
From time to time, those who are involved in managing the stakeholders or the stakes themselves are needed to represent lots of given data about the processes within the large corporations on one single drawing. Such drawing can be a diagram as it is one of the most commonly used charts for representing a large quantity of data. Thus, for mentioning all the stakeholders involved in one project, you can always make a single diagram known to be called an “onion” one, which is simply one of the kinds of chart showing the different dependencies among different parts of one organization or one business process. With help of such chart you can always display different items in the concentric circles. On such drawing the items are represented with help of the rings, each of which depends on the items in the smaller ones, reminding of a cut onion, that’s why it has such name — “onion diagram”.
Having the Onion Diagram created means enabling yourself to show all the layers of one complete system with help of only a few circles which makes the usage of such diagram very convenient and so the diagram itself — very popular and commonly world widely used. With each of the circles of such diagram it is possible to represent a dependent component upon another component, which usually is also a dependent one, but upon another circle inside of this one. The main concept of the process within such diagram is mentioned in the centre circle of the onion diagram. Using this chart means making it obvious and clear to visually representation what it not as easy to read about, but illustrating in a way of such diagram means giving a strong visual impact.
There are many types of the mentioned onion diagram that you can always make with help of the ConceptDraw DIAGRAM diagramming and drawings software. One of them is a so called “Cultural Onion” one, that has 7 layers, including artefacts, behaviours, values, feelings, beliefs, as well as ultimate and worldview allegiance. The mentioned layers are there for organizing some person's life and the outer most layers are known to be the most accessible. At the same time, the “in-depth” layers are accessible only with help of connections to the person. All the mentioned seven layers are integrated on the Cultural Onion Diagram into 3 structural levels: foundational, actualizing and evaluating ones.

Example 1. Stakeholder Onion Diagrams — AHSNs Structure
Having ConceptDraw DIAGRAM software means enabling yourself to create any onion model, known to be a graph-based diagram template, used for describing an extending or expanding relationship between different concepts.
To design the Onion Diagram you can draw the core circle and step by step all concentric rings, but ConceptDraw DIAGRAM recommends you to use already ready-to-use predesigned colorful objects offered by 3 libraries of Stakeholder Onion Diagrams Solution:
- Stakeholder Onion Diagrams,
- Onion Diagrams with Sectors,
- Stakeholder Icons.
Thanks to them you need only type your text, data and add relations.

Example 2. Stakeholder Onion Diagrams — Canada's Action Plan 2.0 Commitments
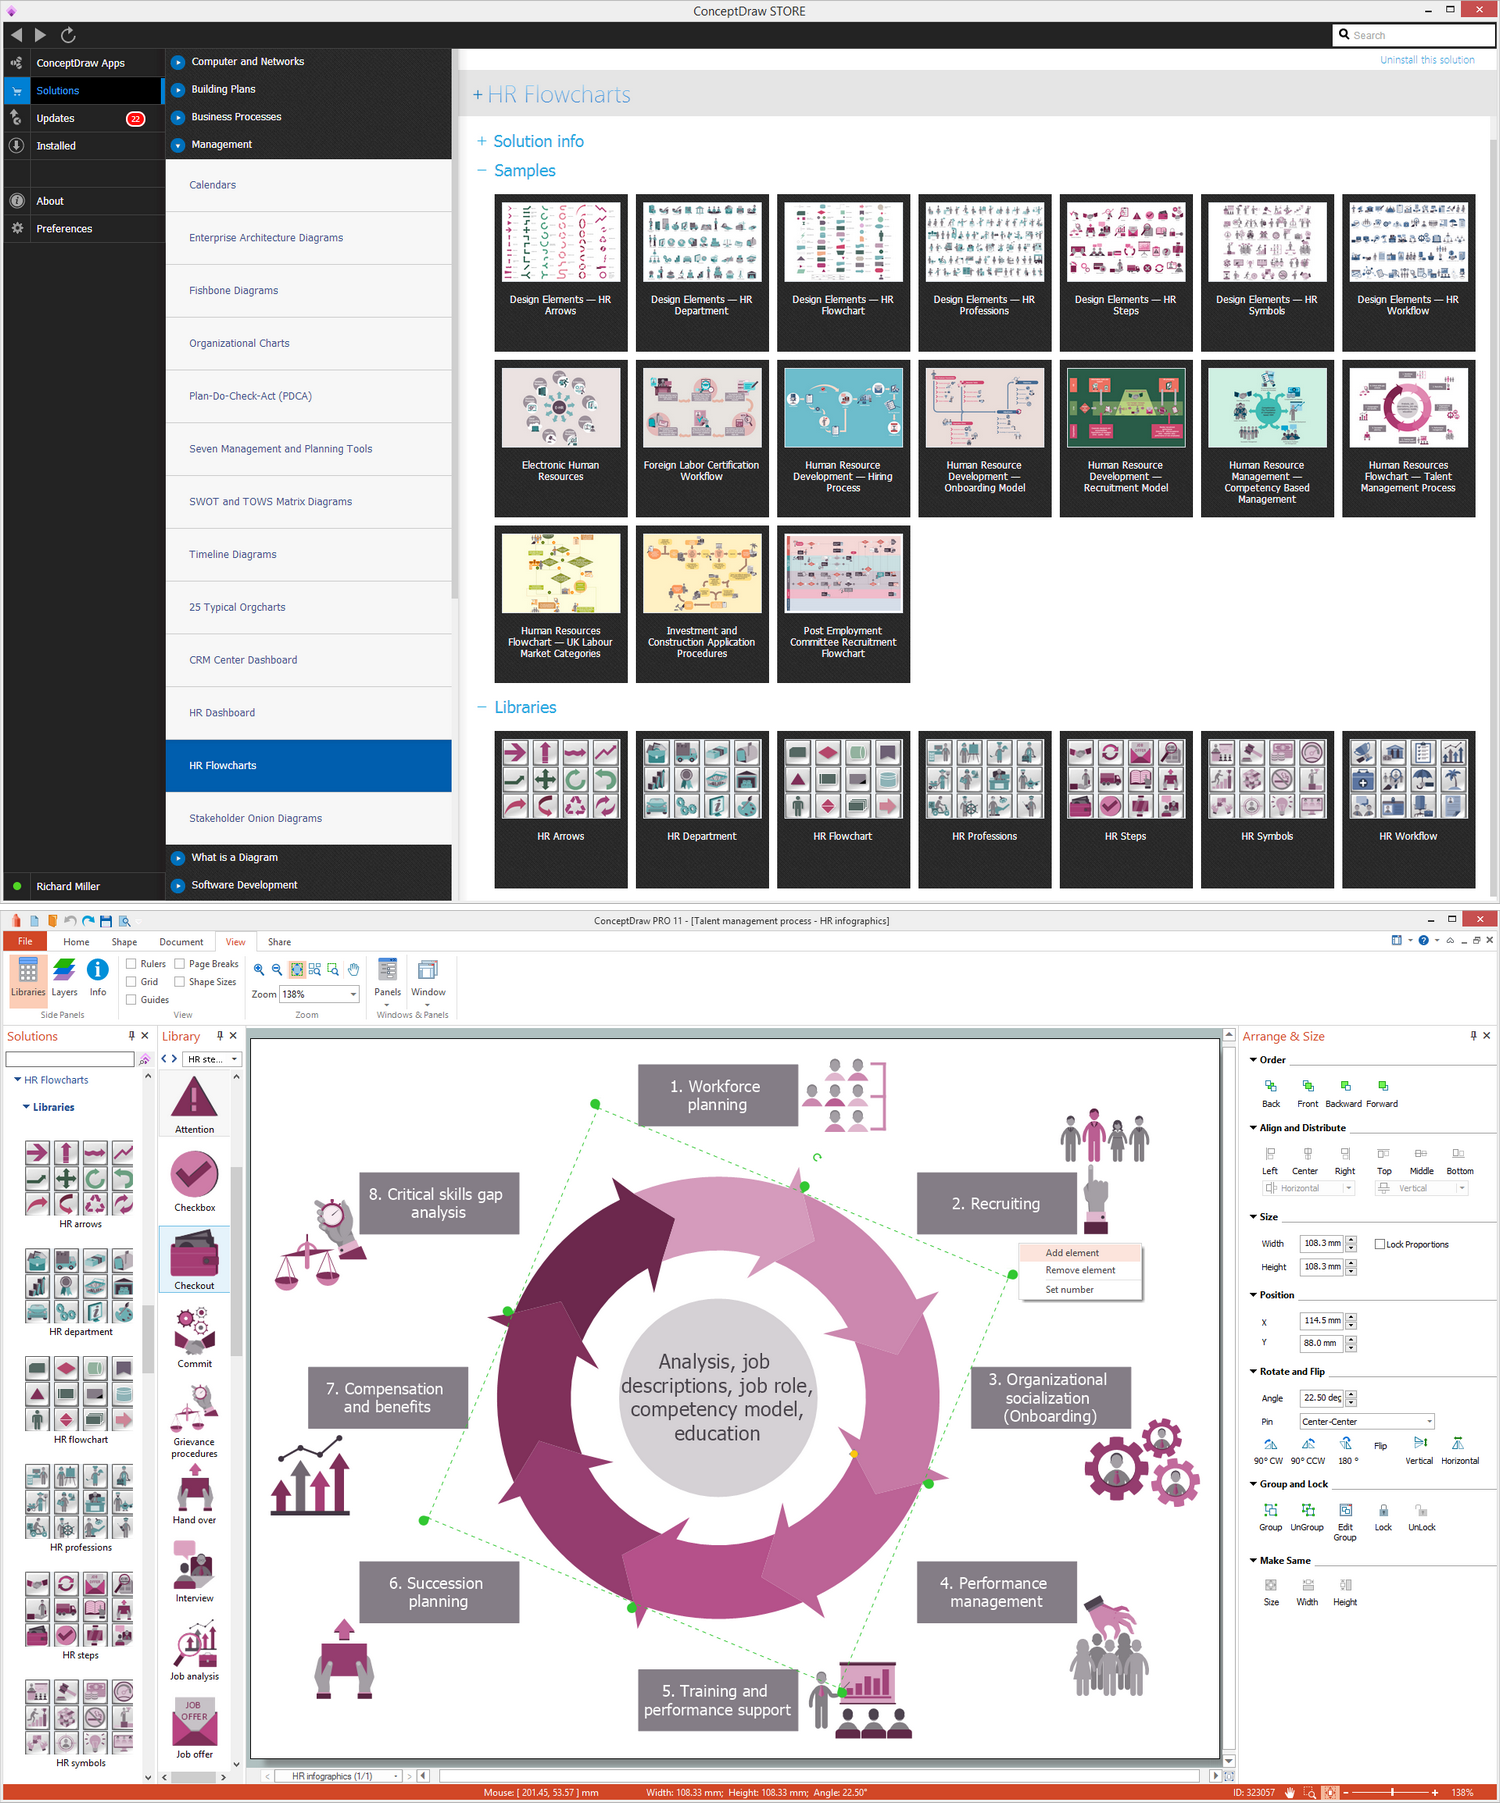
In case you decide to draw the great looking as well as the smart looking Onion Diagrams, including the Stakeholder one, the Onion ones with Sectors and Stakeholder Icons, you can always use ConceptDraw DIAGRAM for such purposes. In case you feel capable and confident enough to make your own onion diagram from a scratch, then you will be able to do it having only ConceptDraw DIAGRAM software, but, nevertheless, it is always better to have another application which is another product of CS Odessa developed for all ConceptDraw DIAGRAM users to simplify their work of creating different drawings, including the onion diagrams — ConceptDraw STORE application.
ConceptDraw STORE allows all the ConceptDraw DIAGRAM users to choose any needed “solution” depending on what exactly they intent to create in the ConceptDraw DIAGRAM diagramming and drawing software and so to use all the pre-made examples and templates of such diagrams, charts, flowcharts, maps and plans, as well as all additionally developed design symbols.

Example 3. Stakeholder Onion Diagrams — Firm Centric Diagram
The samples you see on this page were created in ConceptDraw DIAGRAM software using the powerful tools of Stakeholder Onion Diagrams Solution for ConceptDraw Solution Park. These Stakeholder Onion Diagrams successfully demonstrate solution's capabilities and professional results you can achieve. An experienced user spent 10 minutes creating each of these samples.
Use the Stakeholder Onion Diagrams Solution for ConceptDraw DIAGRAM software for fast, easy and effective creation your own professional looking Stakeholder Onion Diagrams of any complexity.
All source documents are vector graphic documents. They are available for reviewing, modifying, or converting to a variety of formats (PDF file, MS PowerPoint, MS Visio, and many other graphic formats) from the ConceptDraw STORE. The Stakeholder Onion Diagrams Solution is available for all ConceptDraw DIAGRAM users.