
Example 1. Visualize Stakeholder Analysis in ConceptDraw DIAGRAM /p>
Stakeholder analysis usually includes several steps, among them is studying and analysis of the subject area, defining stakeholders and relationships between them and project, and drawing Stakeholder diagram or map with purpose to visualize stakeholder analysis. Stakeholder Onion Diagrams Solution for ConceptDraw DIAGRAM is a powerful tool which will help you on each stage of these complex process.
Look at these 3 libraries included to the Stakeholder Onion Diagrams solution, you can click on any of them to enlarge. All objects which you will need for Stakeholder Onion Diagram process design, are already predesigned and ready-to-use. You can start with any of them simply dragging it from the library to your document.

Example 2. System Stakeholders Diagram
The samples you see on this page were created in ConceptDraw DIAGRAM software using the tools of Stakeholder Onion Diagrams Solution for ConceptDraw Solution Park. These Stakeholder diagrams successfully demonstrate solution's capabilities and professional results you can achieve. An experienced user spent 10 minutes creating each of them.
Use the Stakeholder Onion Diagrams Solution for ConceptDraw DIAGRAM software to visualize stakeholder analysis fast, easy and effective.
All source documents are vector graphic documents. They are available for reviewing, modifying, or converting to a variety of formats (PDF file, MS PowerPoint, MS Visio, and many other graphic formats) from the ConceptDraw STORE. The Stakeholder Onion Diagrams Solution is available for all ConceptDraw DIAGRAM users.
TEN RELATED HOW TO's:
SWOT matrix is a structured planning method used to evaluate the strengths, weaknesses, opportunities and threats involved in a project or in a business venture. ConceptDraw DIAGRAM diagramming and vector drawing software extended with SWOT and TOWS Matrix Diagrams Solution from the Management Area will help you design SWOT Matrix of any complexity quick and easy.
Picture: SWOT Matrix
Related Solution:
To support you in your tasks you can use the power of ConceptDraw DIAGRAM providing
intelligent vector graphics that are useful for management diagramming and
ConceptDraw MINDMAP for key management mind maps.
Picture: Business Productivity - Management
Related Solution:
This sample was created in ConceptDraw DIAGRAM diagramming and vector drawing software using the UML Class Diagram library of the Rapid UML Solution from the Software Development area of ConceptDraw Solution Park.
This sample describes the use of the classes, the generalization associations between them, the multiplicity of associations and constraints. Provided UML diagram is one of the examples set that are part of Rapid UML solution.
Picture: UML Class Diagram Generalization ExampleUML Diagrams
Related Solution:
Business calendar is a special type of calendar, it must be functional, convenient for scheduling the affairs and meetings, and also must have strict, official and unobtrusive interface. So you must pay special attention to the business calendar design. Now you don't need to be an artist to design business calendar thanks to the unique drawing tools of Calendars Solution for ConceptDraw DIAGRAM diagramming and vector drawing software.
Picture: Business Calendar
Related Solution:
ConceptDraw DIAGRAM system design software is a product of CS Odessa that was developed especially for making it much simpler to create all the needed diagrams, charts, flowcharts, schemes and other drawings when there is such a need in it. Having the Specification and Description Language (SDL) solution installed from the ConceptDraw STORE application may be another bonus to any ConceptDraw DIAGRAM diagramming and drawing software’s user as it offers both stencil libraries with the design elements and the pre-made examples of the diagrams, such as the SDL ones.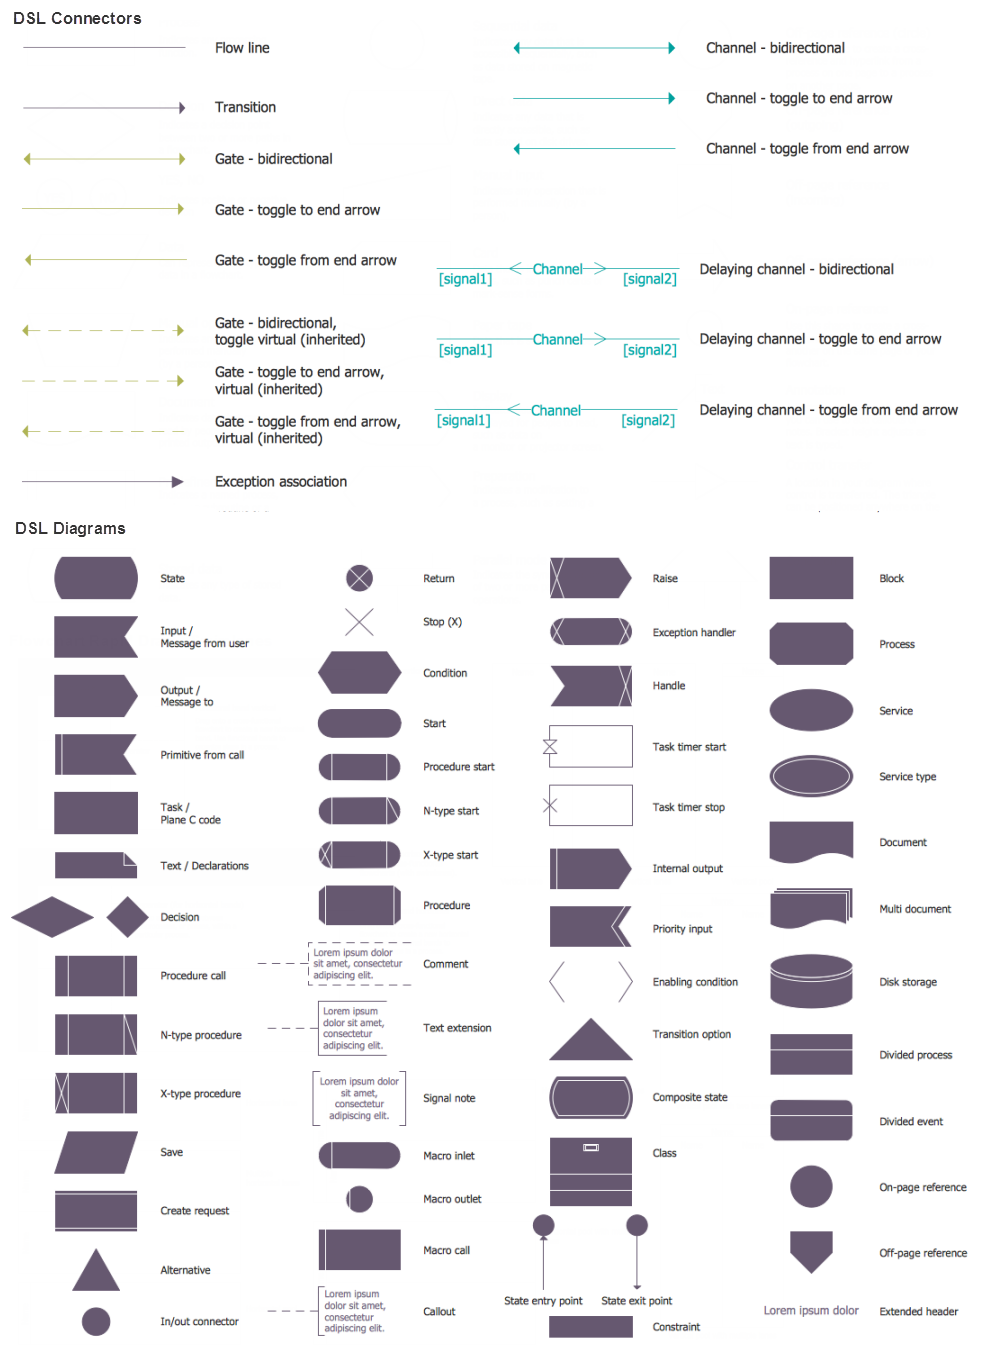
Picture: System Design
Related Solution:
UML Class Diagrams is a type of static structure diagram that is used both for general conceptual modeling of the systematics of the application, and for detailed modeling translating the models into programming code. It describes the structure of a system by showing the: classes of a system, attributes, operations, and the relationships between them.
The Rapid UML Solution for ConceptDraw DIAGRAM includes the UML Class Diagram library that helps you to design the UML Class Diagram quick and easy. You can simply and quickly drop the ready-to-use objects from the library into your document to create the UML Class Diagram.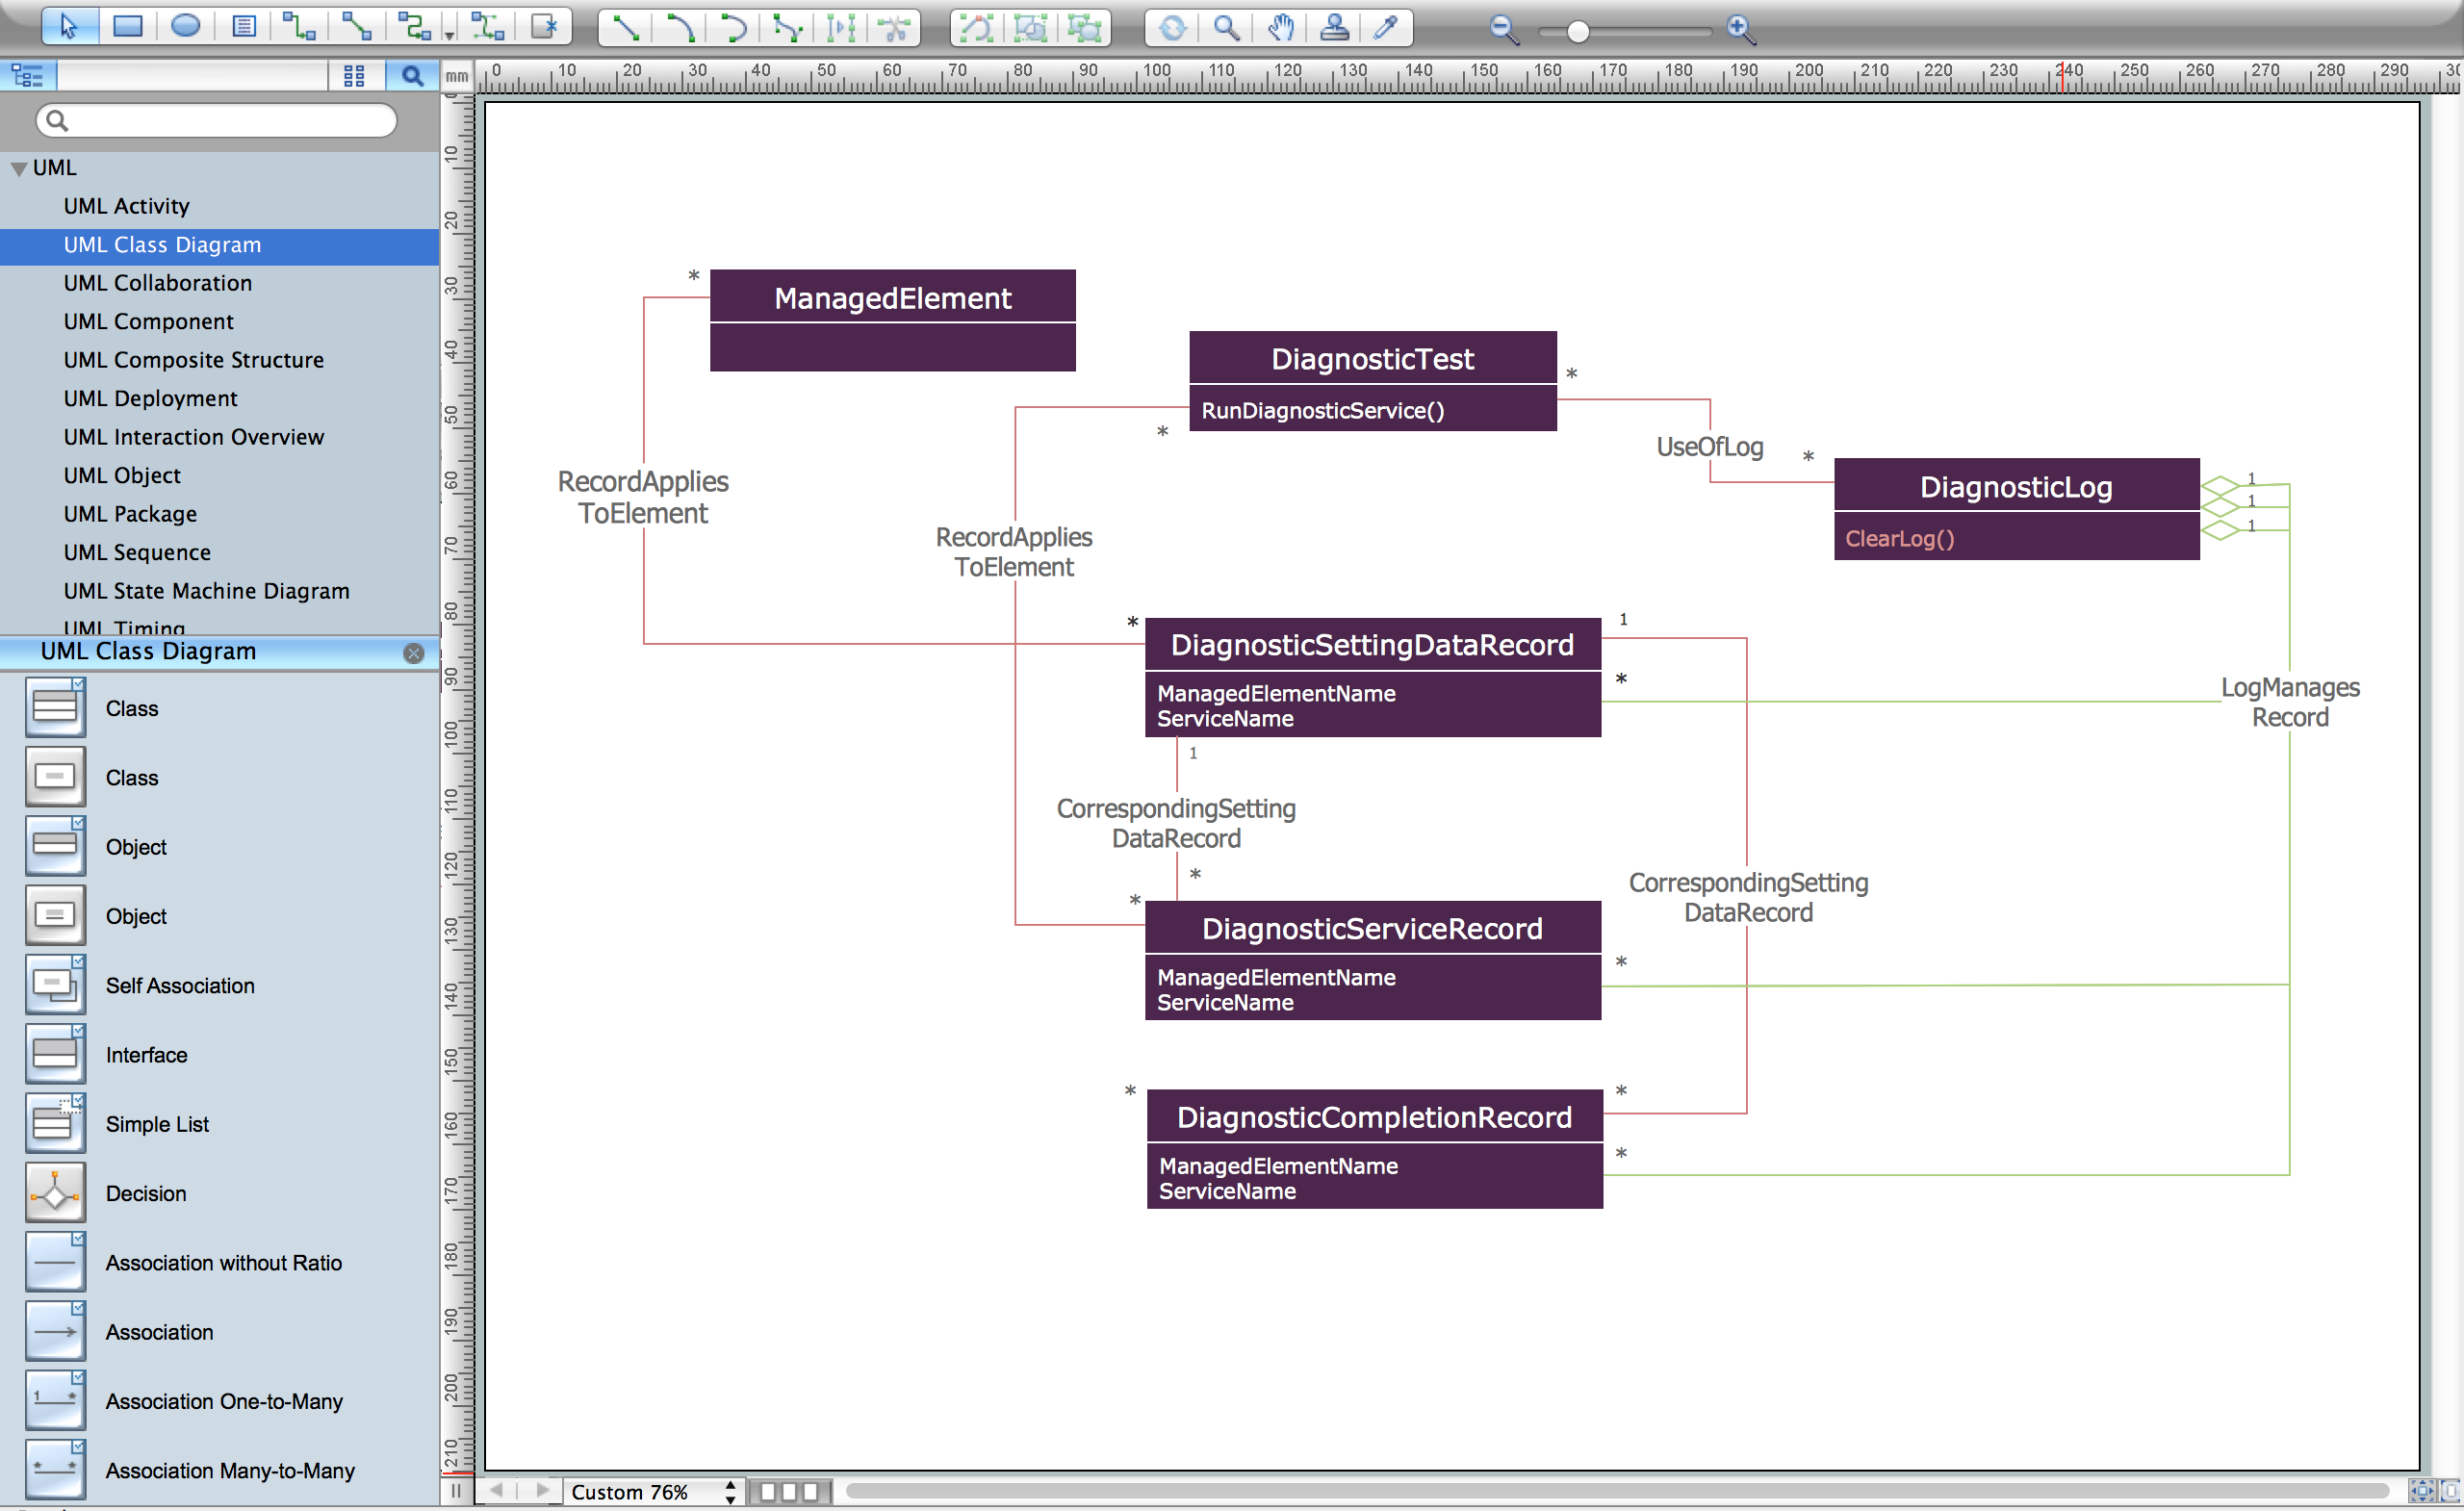
Picture: UML Class Diagram Constructor
Related Solution:
This sample was created in ConceptDraw DIAGRAM diagramming and vector drawing software using the Seven Management and Planning Tools Solution from the Business Productivity area of ConceptDraw Solution Park.
This sample shows the Property Management matrix, the ideas are ordered in regards to importance and frequency. This matrix gives the ability to turn the theory into quantifiable data.
Picture: Property Management Examples
Related Solution:
Users new to ConceptDraw PROJECT will find the Basic lessons an essential platform for familiarizing themselves with the program′s functions. Learn how to assign resources to tasks in ConceptDraw PROJECT with this comprehensive video lesson.
Picture: Project — Assigning Resources
Related Solutions:
ConceptDraw has 142 vector stencils in the 8 libraries that helps you to start using software for designing own Business Process Diagrams. Use Swimlanes library with 20 objects from BPMN.
Picture: Business Process Elements: Swimlanes
Related Solution:
The UML diagram is a powerful tool which lets visually represent all system's components, the interactions between them and relationships with external user interface.
The Rapid UML solution for ConceptDraw DIAGRAM software offers diversity of UML flowchart symbols for drawing all types of UML diagrams.
Picture: UML Flowchart Symbols
Related Solution:


