
Sample 1. Six markets model chart template.
The Marketing Diagrams Solution provides a wide collection of predesigned vector objects, templates and samples to help you create your own professional looking marketing diagrams of any complexity quick, easy and effective.
The marketing diagrams produced with ConceptDraw DIAGRAM are vector graphic documents and are available for reviewing, modifying, and converting to a variety of formats (image, HTML, PDF file, MS PowerPoint Presentation, Adobe Flash or MS Visio).
TEN RELATED HOW TO's:
Is it possible to draw a diagram as quickly as the ideas come to you? The innovative ConceptDraw Arrows10 Technology included in ConceptDraw DIAGRAM is a simple and powerful tool to create any type of diagram.
You mau choose to start from one of plenty diagram templates or to use your own idea.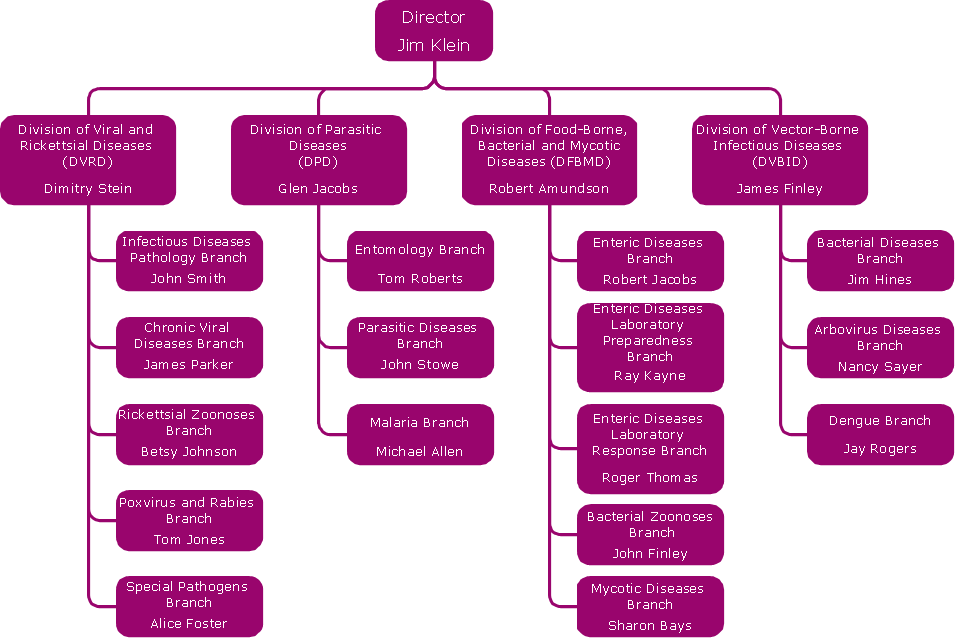
Picture: How To Draw a Diagram
ConceptDraw DIAGRAM extended with Matrices Solution from the Marketing Area of ConceptDraw Solution Park is a powerful software for drawing various types of Marketing Matrices: Ansoff Matrix, BCG Matrix, Deployment Chart, Feature Comparison Chart, Competitive Strategies Matrix, Flow Process Chart, Porter's Value Chain Diagram, Positioning Map, and many others.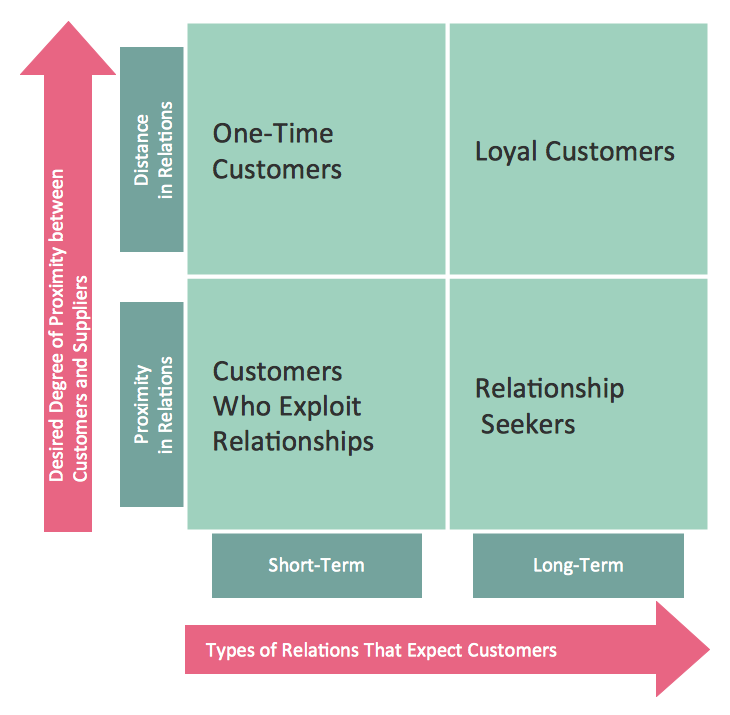
Picture: Matrices
Related Solution:
Business People Clipart - Business and Finance solution from Illustration area of ConceptDraw Solution Park.
Use it to quick draw illustrations, diagrams and infographics for your business documents, presentations and websites.
The vector stencils library Business People Clipart includes 12 images.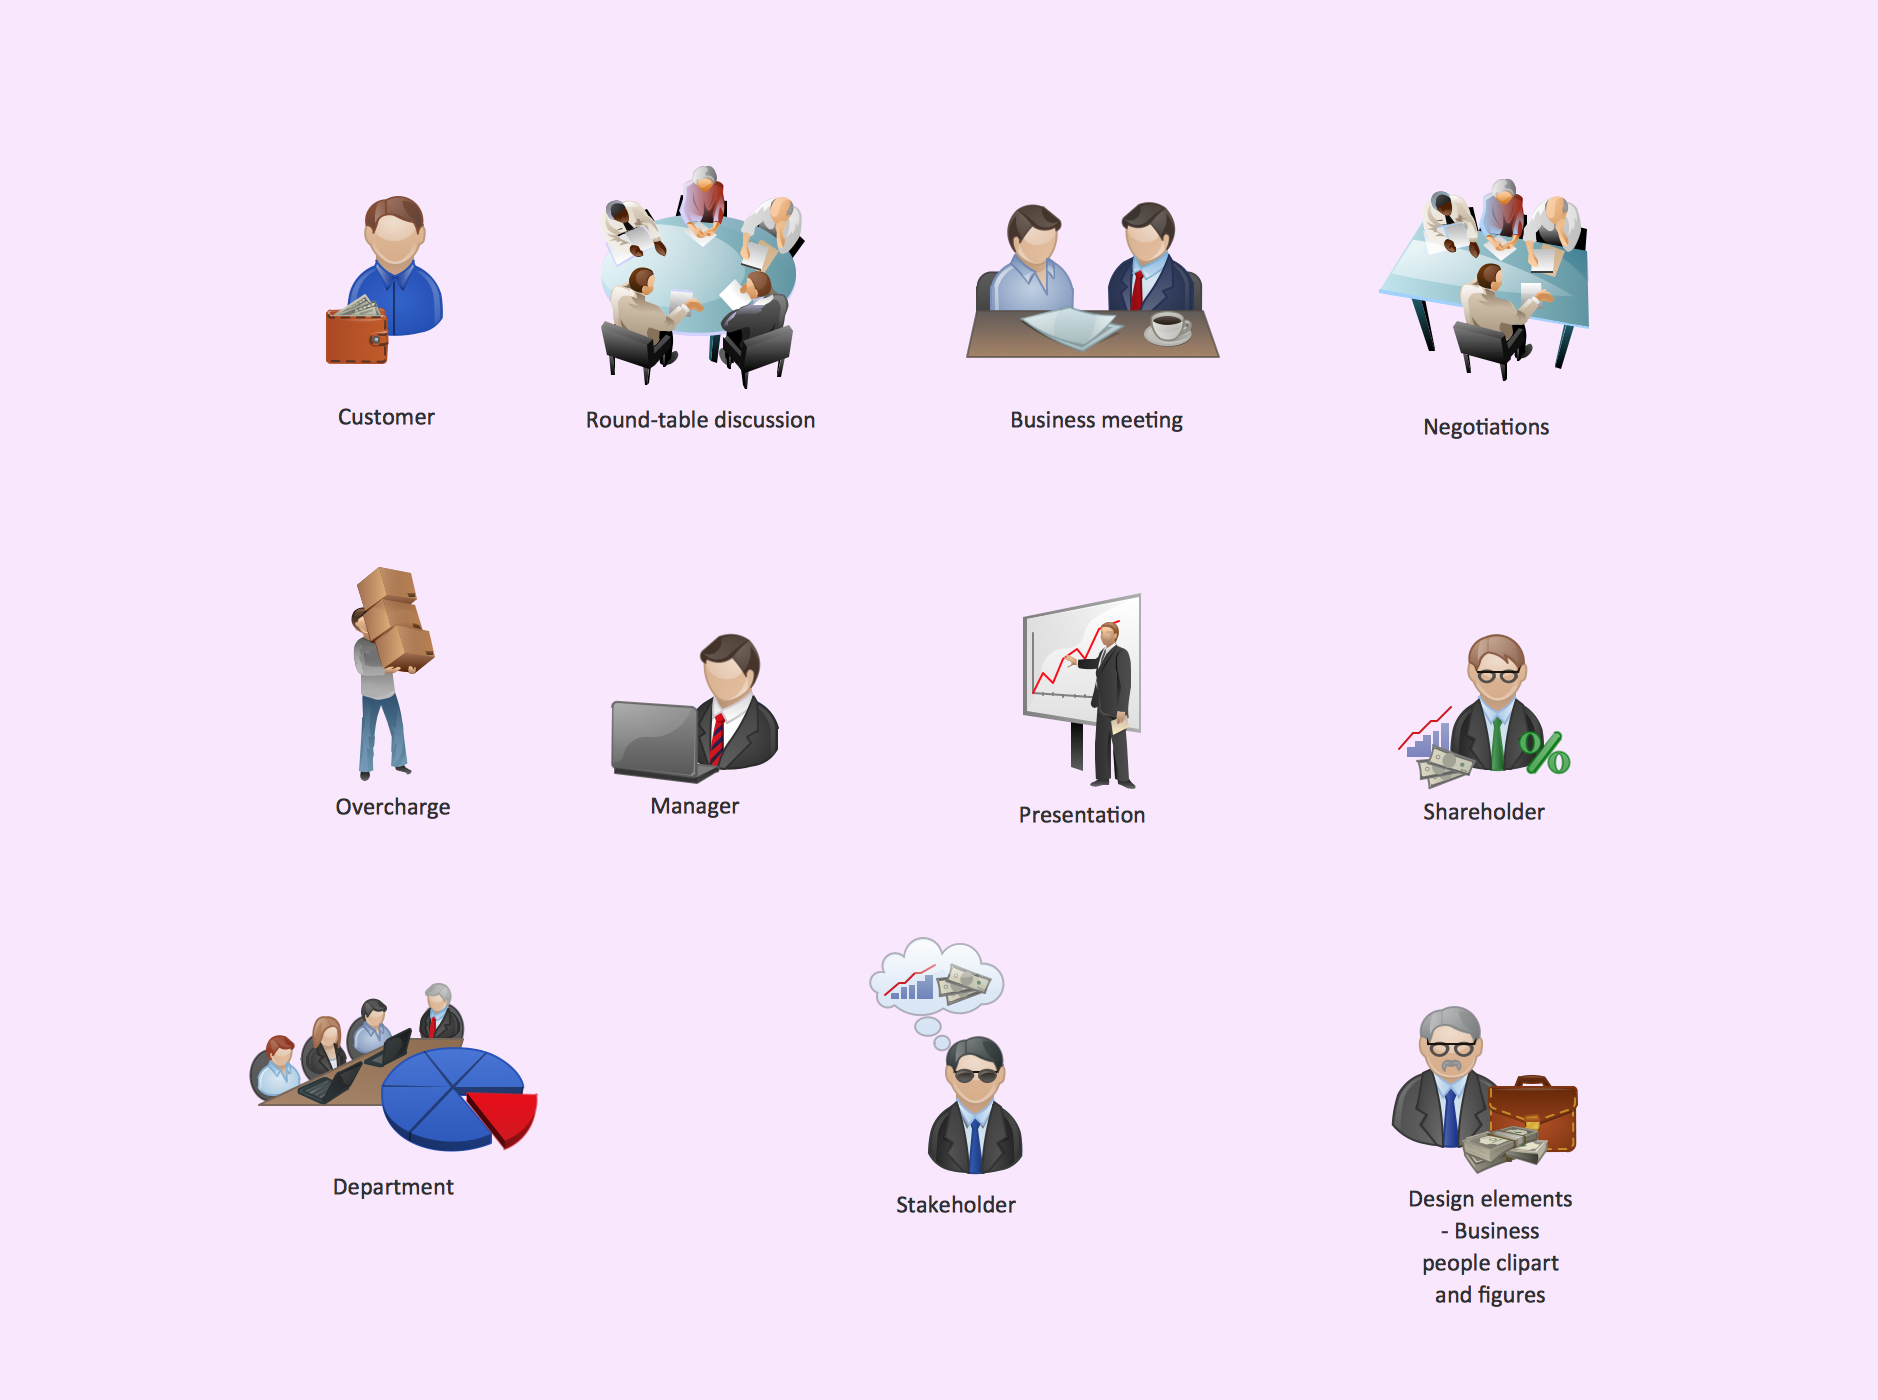
Picture: Business People Clipart
Related Solution:
Process mapping helps with sharing business results and reorganizing workflow. In almost every case, after creating a sales process flowchart the steps that are redundant become obvious for a manager. It's easy to find a flowchart examples that will help in developing one for your business.
This sales process flowchart consists of a sequence of steps that represent a simple sale process. Each step is shown graphically by a rectangle representing processing steps or an activity, or a diamond representing a decision. These rectangles are linked by arrows, that indicate the direction of the sales workflow. ConceptDraw Sales Flowcharts solution delivers a the full set of classical flowchart notation symbols, along with sales-related icons and pictograms.
Picture:
Sales Process Flowchart
Flowchart Examples
Related Solutions:
Understanding the connections between an organization department might take some time. If you are a newcomer to a company, an orgchart would help you if don’t know who to call when questions appear. This scheme usually is printed on one of the walls in the office.
This template of orgchart is supplied with the ConceptDraw add-on containing solutions for making organizational charts. You can use it to depict an organizational structure of your company. The only you need is - open this template and alter it to cover an organizational features of your business. It is easy to rearrange the orgchart structure by dragging the elements by mouse. Finally fill the template with particular positions of your company's staffing table.
Picture: Orgchart
Related Solution:
This sample shows the Purchasing Flow Chart Diagram that displays the money flow in the carbon offset sphere. The carbon offsets are the compensatory measures that the companies make for the carbon emissions. You can see on this sample the groups that have interests in the carbon offsets and the money flow after the carbon offset vendors sold the carbon offsets.
Picture: Purchasing Flow Chart.Purchasing Flowchart Example
Related Solution:
While creating flowcharts and process flow diagrams, you should use special objects to define different statements, so anyone aware of flowcharts can get your scheme right. There is a short and an extended list of basic flowchart symbols and their meaning. Basic flowchart symbols include terminator objects, rectangles for describing steps of a process, diamonds representing appearing conditions and questions and parallelograms to show incoming data.
This diagram gives a general review of the standard symbols that are used when creating flowcharts and process flow diagrams. The practice of using a set of standard flowchart symbols was admitted in order to make flowcharts and other process flow diagrams created by any person properly understandable by other people. The flowchart symbols depict different kinds of actions and phases in a process. The sequence of the actions, and the relationships between them are shown by special lines and arrows. There are a large number of flowchart symbols. Which of them can be used in the particular diagram depends on its type. For instance, some symbols used in data flow diagrams usually are not used in the process flowcharts. Business process system use exactly these flowchart symbols.
Picture: Flowchart Symbols: Meaning and Examples
Related Solution:
When you are a beginner in software development, you make a lot of mistakes. Developing logical models, or data flow diagrams is a way to see the the whole project and all the processes clearly. And some novices, unfortunately for them, miss modeling stage at the beginning of project life cycle, and get into troubles as the project grows.
This image represents the data flow diagram applying symbols of Yourdon and Coad notation. This DFD depicts the data flow inside an organization department deals with receivables. The icons of standard Yourdon and Coad notation provides possibility to draw professional looking and well- readable DFD for business documentation. This data flow diagram was designed with the help of ConceptDraw DIAGRAM and its Data Flow Diagrams solution. The solution delivers three vector graphic libraries including elements of Yourdon and Coad and Gane-Sarson notations.
Picture: Data Flow Diagram Process
Related Solution:
ConceptDraw DIAGRAM is a drawings software for creating Nature scenes. Nature solution from ConceptDraw Solution Park expands this software with a new library that contains 17 vector objects and samples illustration files.
Picture: Drawing a Nature Scene
Easy charting software comes with beautiful chart templates and examples. This makes it easy to create professional charts without prior experience.
Picture: Chart Templates