Made with
ConceptDraw
DIAGRAM 18

UML Deployment Diagram. Design Elements

UML Deployment Diagram is a type of Structure Diagrams that shows the physical deployment of information generated by the software programs.

The information generated by the software is called “artifact”. The hardware with installed software is called “node”. Thus, UML Deployment Diagram models the physical deployment of artifacts on nodes.

UML Deployment Diagram is intended for visualization of elements and components of the program that exist only on the stage of its runtime. The development of the Deployment Diagram is the last stage of the specification of the software system model.

UML Deployment Diagram represents the nodes as boxes, and the artifacts as rectangles within the boxes. The nodes can have subnodes that are represented as nested boxes. One node on the UML Deployment Diagram can conceptually describe more than one physical node.

There are two types of nodes: device nodes and execution environment nodes.

Device nodes are the computing resources with capability of processing memory and executing of software. An execution environment node (EEN) is a computer system that is located inside a device node.

The other shapes the most used in UML Deployment Diagrams are:

  • Communication path - a line that connect two device nodes and represents communications between them.
  • Package - a file shaped box that groups together all the device nodes.
  • Data Store, Frames, Components UML, and others.

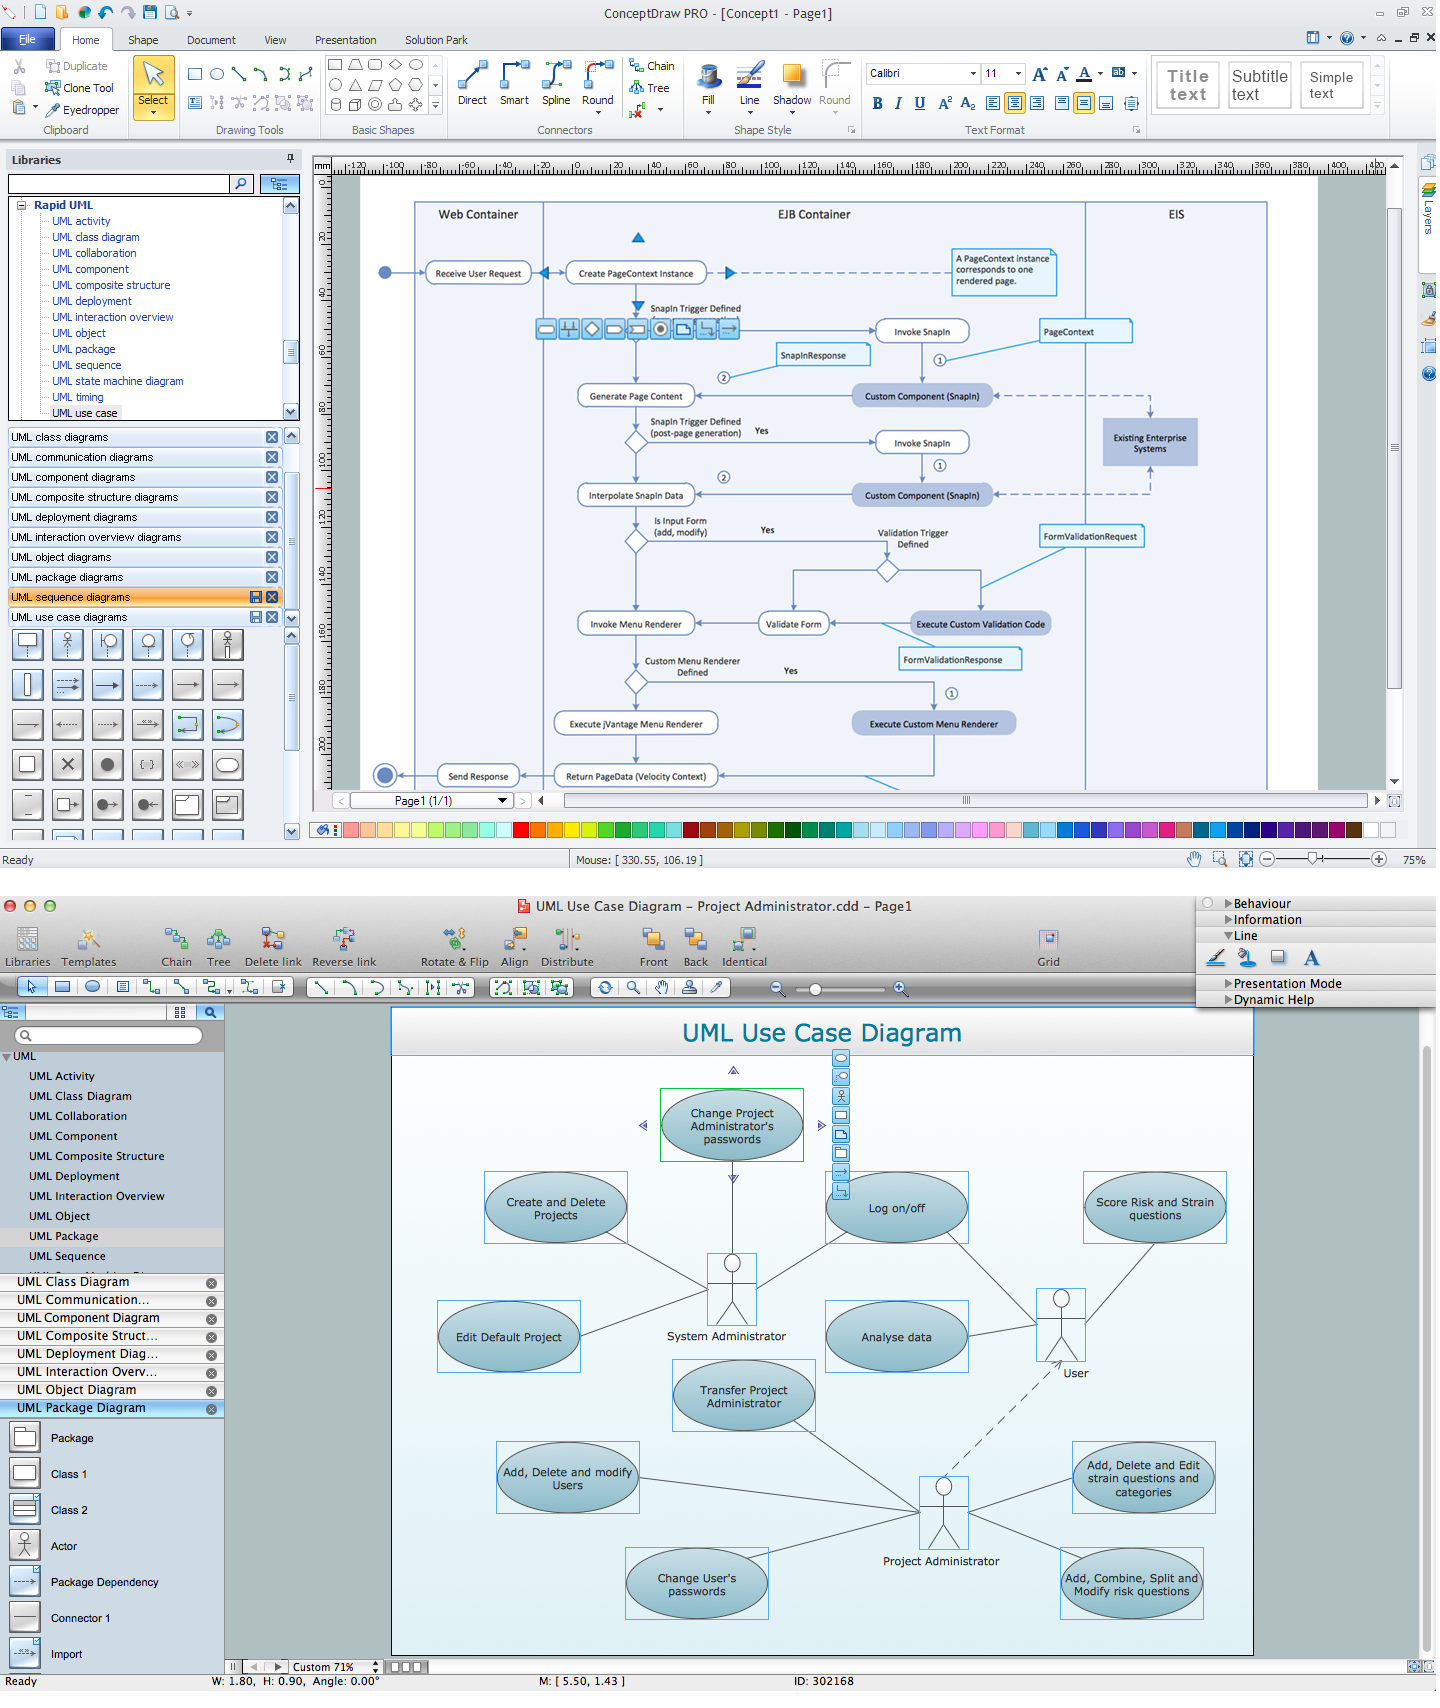
The Rapid UML Solution for ConceptDraw DIAGRAM contains 13 vector stencils libraries with 393 interactive shapes that you can use to design your UML diagrams.

To design a Deployment Diagram use the UML Deployment Diagram library.

UML Deployment Diagram library contains 31 shapes:

  • Device node
  • Artifact
  • Component
  • Component 2
  • Deployment specification
  • User
  • Data store
  • Package
  • Dependency
  • Communication path
  • Communication line
  • Request
  • Association Many-to-Many
  • Association One-to-Many
  • Frame, fragment
  • Note
  • Aggregation
  • Composition
  • Constraint
  • Generalization
  • Realization
  • Interface with connector
  • Processor node
  • Execution environment node
  • Smart connector
  • Line connector
  • Interface
  • Provided interface
  • Provided interface (reverse)
  • Required interface
  • Required interface (reverse)
UML Deployment Diagram library

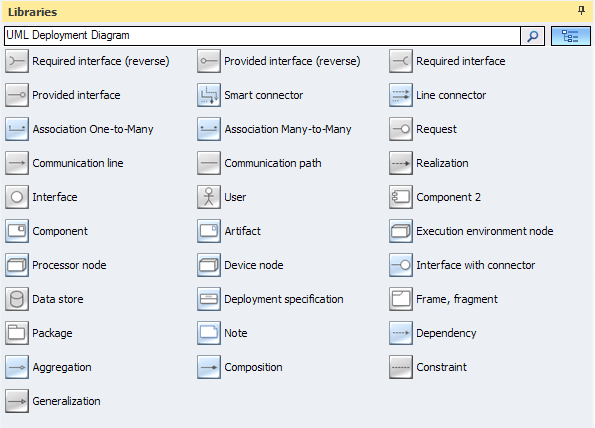
Pic.1. UML Deployment Diagram Library

UML Deployment Diagram. Design Elements *

Pic.2. UML Deployment Diagram Library Elements

ConceptDraw Rapid UML solution provides UML Deployment Diagram library of vector stencils for drawing the deployment diagrams using deployment blocks and assembly connectors.

Use design element from the UML Deployment Diagram library to draw your own UML deployment diagrams of complex systems and software applications.

UML Deployment Diagram

UML Deployment Diagram

This sample was created in ConceptDraw DIAGRAM diagramming and vector drawing software using the UML Deployment Diagram library of the Rapid UML Solution from the Software Development area of ConceptDraw Solution Park.

UML Diagram Solution


TEN RELATED HOW TO's:
Use the set of special professionally developed swim lane flowchart symbols - single, multiple, vertical and horizontal lanes from the Swimlanes and Swimlanes BPMN 1.2 libraries from the Business Process Diagram solution, the Swim Lanes library from the Business Process Mapping solution as the perfect basis for your Swim Lane Flowcharts of processes, algorithms and procedures.Swim Lane Flowchart Symbols *
Picture: Swim Lane Flowchart Symbols
Related Solution:
This sample shows the Purchasing Flow Chart Diagram that displays the money flow in the carbon offset sphere. The carbon offsets are the compensatory measures that the companies make for the carbon emissions. You can see on this sample the groups that have interests in the carbon offsets and the money flow after the carbon offset vendors sold the carbon offsets.Purchasing Flow Chart.<br>Purchasing Flowchart Example *
Picture: Purchasing Flow Chart.Purchasing Flowchart Example
Related Solution:
ConceptDraw DIAGRAM is a powerful diagramming and vector drawing GUI software. Extended with Mac OS User Interface solution from the Software Development area, ConceptDraw DIAGRAM is the best software for designing professional looking user interfaces for new OS X 10.10 Yosemite operating system developed for Macintosh computers. Mac OS User Interface solution offers you large quantity of Mac OS templates, samples and user interface design examples.Mac OS User Interface Design Examples *
Picture: Mac OS User Interface Design Examples
Related Solution:
The Total Quality Management Diagram solution helps you and your organization visualize business and industrial processes. Create Total Quality Management diagrams for business process with ConceptDraw software.Total Quality Management Business Diagram *
Picture: Total Quality Management Business Diagram
Related Solution:
This sample shows the OOSE diagram with aggregation and composition associations. Using the Rapid UML Solution for ConceptDraw DIAGRAM you can create your own professional OOSE Diagrams quick and easy.OOSE Method *
Picture: OOSE Method
Related Solution:
Understanding the connections between an organization department might take some time. If you are a newcomer to a company, an orgchart would help you if don’t know who to call when questions appear. This scheme usually is printed on one of the walls in the office. This template of orgchart is supplied with the ConceptDraw add-on containing solutions for making organizational charts. You can use it to depict an organizational structure of your company. The only you need is - open this template and alter it to cover an organizational features of your business. It is easy to rearrange the orgchart structure by dragging the elements by mouse. Finally fill the template with particular positions of your company's staffing table.Orgchart *
Picture: Orgchart
Related Solution:
Pie Graph is very popular kind of charts which is widely used in various fields of science and life activities. ConceptDraw DIAGRAM extended with Pie Charts Solution from the Graphs and Charts area is the best software for drawing the Pie Graph Worksheets.Pie Graph  Worksheets *
Picture: Pie Graph Worksheets
Related Solution:
The vector stencils library Yourdon and Coad Notation from the solution OOAD contains specific symbols of the Yourdon and Coad notation such as data store symbol, data process symbol, loop symbol for ConceptDraw DIAGRAM software.Yourdon and Coad Diagram
Picture: Yourdon and Coad Diagram
Explaining offensive strategies of American Football is practically impossible without drawing a diagram. If you need to do this more than once you have to choose an appropriate tool allows you to change diagrams easily. ConceptDraw DIAGRAM extended with the Football Solution is the best choice for this case.Offensive Strategy — Spread Offense Diagram *
Picture: Offensive Strategy — Spread Offense Diagram
Related Solution:
Architectural drawing allows to show the location of a building or ensemble of buildings on the ground, indicating the cardinal points. For centuries, people had been studying architecture in universities to learn how to draw building plans and now everyone can do it easily just using appropriate software. While developing the building plan, its graphic part, you can display the part of the floor or the entire floor of a building with an indication of the exact location of the drawn premise. Small-sized apartments does not restrict the advanced interior design opportunities. Here is a detailed and precise floor plan of a pretty small apartment. A furniture objects are added to show possible interior of this home. This plan can be used to help somebody with a floor layout and furniture arrangement. Having this floor plan in a pocket while shopping would be useful to check if there is enough rooms for a new furniture.How To Draw Building Plans
Picture: How To Draw Building Plans
Related Solution:
ConceptDraw
DIAGRAM 18