Made with
ConceptDraw
DIAGRAM 18

Integration Definition

Integration DEFinition (IDEF) diagrams are the drawings of the IDEF systems, such as the IDEF0 ones that can be made with the help of the IDEF Business Process Diagrams solution from the ConceptDraw STORE application in the ConceptDraw DIAGRAM diagramming and drawing software.

The term of the “IDEF” was renamed as Integration DEFinition in 1999. It refers to a family of the modeling languages that are widely used in the field of software and systems engineering. Such drawings are known for covering a wide range of uses, from functional modeling to simulation, data, object-oriented analysis and/or design as well as the knowledge acquisition.

Integration Definition *

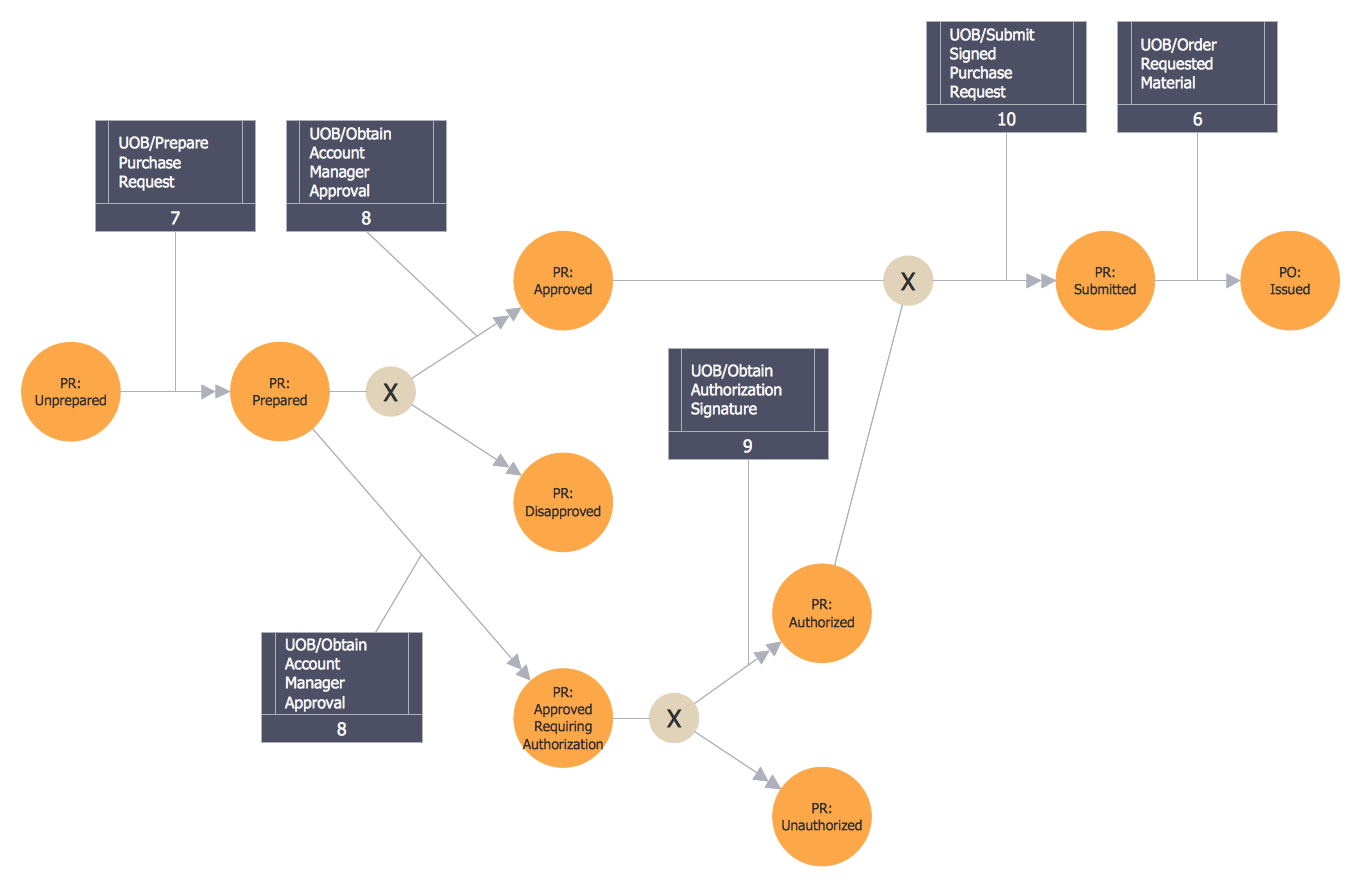
Example 1. Integration Definition - Completed Transition Schematic

The mentioned "definition languages" were originally developed under funding from U.S. Air Force. They are still most commonly used by the U.S. Air Force and another military. The United States Department of Defense agencies is known to be using such languages as well.

The most recognized and well as most commonly used components of the IDEF family are IDEF0. IDEF0 is a functional modeling language building on SADT which is also known to be a part of the IDEF family of different modeling languages. The last one is widely used in the field of software engineering, being built on the functional modeling language SADT. SADT is an acronym for the Structured Analysis and Design Technique.

The IDEF0 Functional Modeling method is known to be designed for being able to model all the needed actions, activities and decisions of both the organizations and the systems, if needed. IDEF0 was derived from the already well-established graphic modeling language Structured Analysis and Design Technique that was already mentioned before and that was developed by both SofTech, Inc. and Douglas T. Ross.

IDEF0 in its original form is known to be including both an appropriate definition of some graphical modeling language and a description of some particular comprehensive methodology that is used for developing the models. The US Air Force was involved in commissioning the Structured Analysis and Design Technique developers for developing a function model method that can be used for both analyzing and communicating the functional perspective of some system.

IDEF0 can be expected to assist in organizing some system analysis. It can be also used for promoting the effective communications between the analyst and the customer through some simplified graphical devices. IDEF0 can be used for showing the needed data flow, the functional flow of some lifecycle processes as well as some appropriate system control every time the Functional flow block diagram is used for representing the functional flow of some product.

IDEF0 is known to be capable of representing lots of manufacturing, business and other types of enterprise operations graphically. It can be done to any level of detail. Providing the rigorous as well as the precise description and promoting the consistency of both interpretation and usage, integration definition IDEF0 is a well-tested as well as a proven language that has been used for many years by both private industry and government.

Any IDEF0 can be generated by a wide range of the computer graphics tools. There are very many commercial products that are known to be specifically supporting the analysis and development of the integration definition models and diagrams, such as the IDEF0 ones.

While one of the best tools for creating the IDEF0 diagrams is known to be the ConceptDraw DIAGRAM diagramming and drawing software, ConceptDraw STORE application seems to be the best one for simplifying any work of creation the IDEF models by providing the stencil libraries with the design elements as well as the pre-made examples that are all available for being edited, if needed.

The Integration Definition for Information Modeling (IDEF1x) is an associated technique that can be used to supplement IDEF0 for data-intensive systems. The IDEF0 standard, same as the IDEF1x standard (FIPS 184) and the Federal Information Processing Standards Publication 183 (FIPS 183), is known to be maintained by the National Institute of Standards and Technology.

IDEF0 Diagram - Decomposition Structure

Example 2. IDEF0 Diagram — Decomposition Structure

IIDEF0 may be also used for modelling a lot of non-automated as well as automated systems. It may be used for new systems as well, but first of all the requirements have to be defined and the functions have to be specified. After, designing an implementation that meets all the needed requirements can be done as well as the performance of the functions.

For the already existing systems, IDEF0 can be used in order to analyze the functions that these systems perform. Recording the mechanisms by which these are done can be also performed. After the IDEF0 is applied to some particular system, a model may be a result. Such model may consist a hierarchical series of text, diagrams, glossary cross-referenced to each other. There are two main modelling components: functions and the objects. First ones are known to be represented on a diagram with the help of the boxes and the second ones — with the arrows.

Each of the activities may be described by a verb-based label that is placed in a box within the IDEF0 diagram. All the inputs are shown as arrows that are entering the left side of the activity box while outputs can be seen as the already existing arrows on the right side of the box. All the controls can be displayed in a form of the arrows that are entering the top of the box and the mechanisms that are all displayed in the form of the arrows which are all entering from the bottom of the box.

IDEF0 Diagram - Inter Box Connections

Example 3. IDEF0 Diagram — Inter Box Connections

Taking into consideration all the previous descriptions, any integration definition diagram can be easily created in the ConceptDraw DIAGRAM diagramming and drawing software either with the aid of the IDEF Business Process Diagrams solution or without it.


TEN RELATED HOW TO's:
Israel, officially the State of Israel, is a country in Western Asia, on the south-eastern shore of the Mediterranean Sea. The vector stencils library Israel contains contours for ConceptDraw DIAGRAM diagramming and vector drawing software. This library is contained in the Continent Maps solution from Maps area of ConceptDraw Solution Park.Geo Map - Asia - Israel *
Picture: Geo Map - Asia - Israel
Related Solution:
Activity on Node Network Diagramming Tool - Activity Network and Project Evaluation and Review Technique, or PERT, charts are a way of documenting and analyzing the tasks in a project. This sample shows the Activity on node network diagramming method. It was created in ConceptDraw DIAGRAM diagramming and vector drawing software using the Seven Management and Planning Tools solution from the Management area of ConceptDraw Solution Park.Activity on Node Network Diagramming Tool *
Picture: Activity on Node Network Diagramming Tool
Related Solution:
Diagramming is an astonishing way to visualize business processes. The list of the most common business process flowchart symbols is quite long starting from basic flowcharts, continuing with SIPOC diagrams. Business process modeling was never easier than now, with special ConceptDraw Business Process Mapping solution. To carry out all professional standard requirements for business processes mapping, it is necessarily to follow the special graphical notations. ConceptDraw Business Process Mapping solution offers an exhaustive suite of tools to aid business process mapping. There are three vector libraries SIPOC Diagrams, Business Process Flowcharts, and Swim Lanes that contains totally more than 50 symbols of standard BPM notations. This is all that professionals need to effectively evaluate and manage quality in business processes.Business Process Flowchart Symbols *
Picture: Business Process Flowchart Symbols
Related Solution:
ConceptDraw DIAGRAM extended with IDEF0 Diagrams solution from the Software Development area of ConceptDraw Solution Park is a powerful diagramming and vector drawing IDEF0 software. All IDEF0 diagrams created in ConceptDraw DIAGRAM are vector graphic documents and can be reviewed, modified and converted to MS Visio XML format. To obtain the IDEF0 Visio documents from ConceptDraw DIAGRAM documents use the wide export possibilities of ConceptDraw DIAGRAM.IDEF0 Visio *
Picture: IDEF0 Visio
Related Solution:
Functional modeling allows to make complex business processes simple. One of the basic methods is IDEF0 and one of the most effective also. To create a business model, use flowchart symbols. The IDEF0 library, supplied with ConceptDraw IDEF0 Diagrams solution contains 18 IDEF0 basic notation symbols. All symbols are the vector graphic images what means, that one can customize their size preserving the stable quality. Another library of IDEF0 symbols can be find out in the the Business Process Diagrams solution, included to the Business Processes section of ConceptDraw Solution Park. These libraries composed from just vector objects and are totally compatible. You can apply the IDEF0 symbols from both libraries at your flowcharts, if needed.IDEF0 Flowchart Symbols
Picture: IDEF0 Flowchart Symbols
Related Solution:
ConceptDraw DIAGRAM diagramming and vector drawing software extended with Cisco Network Diagrams Solution from the Computer and Networks Area is the best for creating Cisco Network Diagrams thanks to numerous predesigned Cisco network icons.Cisco Network Icons *
Picture: Cisco Network Icons
Related Solution:
Unified Modeling Language (UML) is a graphical modeling language for describing, visualizing, projecting and documenting of object oriented systems. UML digram is used for modeling of organizations and their business processes, for development the big projects, the complex software applications. Comprehensive UML diagram allows to create the set of interrelated documents that gives the complete visual representation of the modeling system.UML Sample Project *
Picture: UML Sample Project
Related Solution:
Every company meets some risks during project life cycle. It’s easy to face them using such tools as SWOT analysis matrix diagram that depicts Strengths, Weaknesses, Opportunities and Threats of any proposed subject. ConceptDraw Solution Park contains excellent templates of of SWOT and TOWS matrices. Making SWOT matrix is frequently used in practical marketing. It is the valuable tool of marketing strategy development. SWOT matrix allows to define the strengths and weaknesses of the organization, possible outside threats and opportunities and evaluate the current strategic competitors. Using ConceptDraw SWOT and TOWS Matrix Diagrams solution you can perform SWOT analysis. You can create a SWOT matrix in and then compare the strengths and weaknesses of your organization and the opportunities and threats of market. The well-performed SWOT-analysis allows you define the steps that can be taken for the improvement of your company market position and determine and problems that need to be solve urgently.SWOT analysis matrix diagram templates *
Picture: SWOT analysis matrix diagram templates
Nodes of any computer network are somehow organized in a hierarchy or a layout. Some of the common layouts like star network topology are more reliable and some like ring topology withstand high loads better. It is also important to distinguish logical topologies from physical. This diagram represents a typical view of the star network topology. The star network topology is one of the most frequently used network topologies in the majority of office and home networks. It is very popular because of its low cost and the easy maintenance. The plus of the star network topology is that if one computer on the local network is downed, this means that only the failed computer can not send or receive data. The other part of the network works normally. The minus of using star network topology is that all computers are connected to a single point-switch, or hub. Thus, if this equipment goes down, the whole local network comes down.Star Network Topology *
Picture: Star Network Topology
Related Solution:
ConceptDraw DIAGRAM is a powerful tool for business and technical diagramming. Software Development area of ConceptDraw Solution Park provides 5 solutions: Data Flow Diagrams, Entity-Relationship Diagram (ERD), Graphic User Interface, IDEFO Diagrams, Rapid UML.Software Diagram Examples and Templates *
Picture: Software Diagram Examples and Templates
Related Solution:
ConceptDraw
DIAGRAM 18