
Pic 1. Financial Comparison Chart
Using the ready-to-use predesigned objects from the Bar Graphs Solution for ConceptDraw DIAGRAM you can create your own professional looking Bar Charts quick and easy.
The Bar Charts produced with ConceptDraw DIAGRAM are vector graphic documents and are available for reviewing, modifying, and converting to a variety of formats (image, HTML, PDF file, MS PowerPoint Presentation, Adobe Flash or MS Visio).
Free Download Bar Chart Software and View All Templates and Examples
See Also:
TEN RELATED HOW TO's:
To draw SysML diagrams use the ConceptDraw DIAGRAM software extended with the Rapid UML solution from the Software Development area of ConceptDraw Solution Park.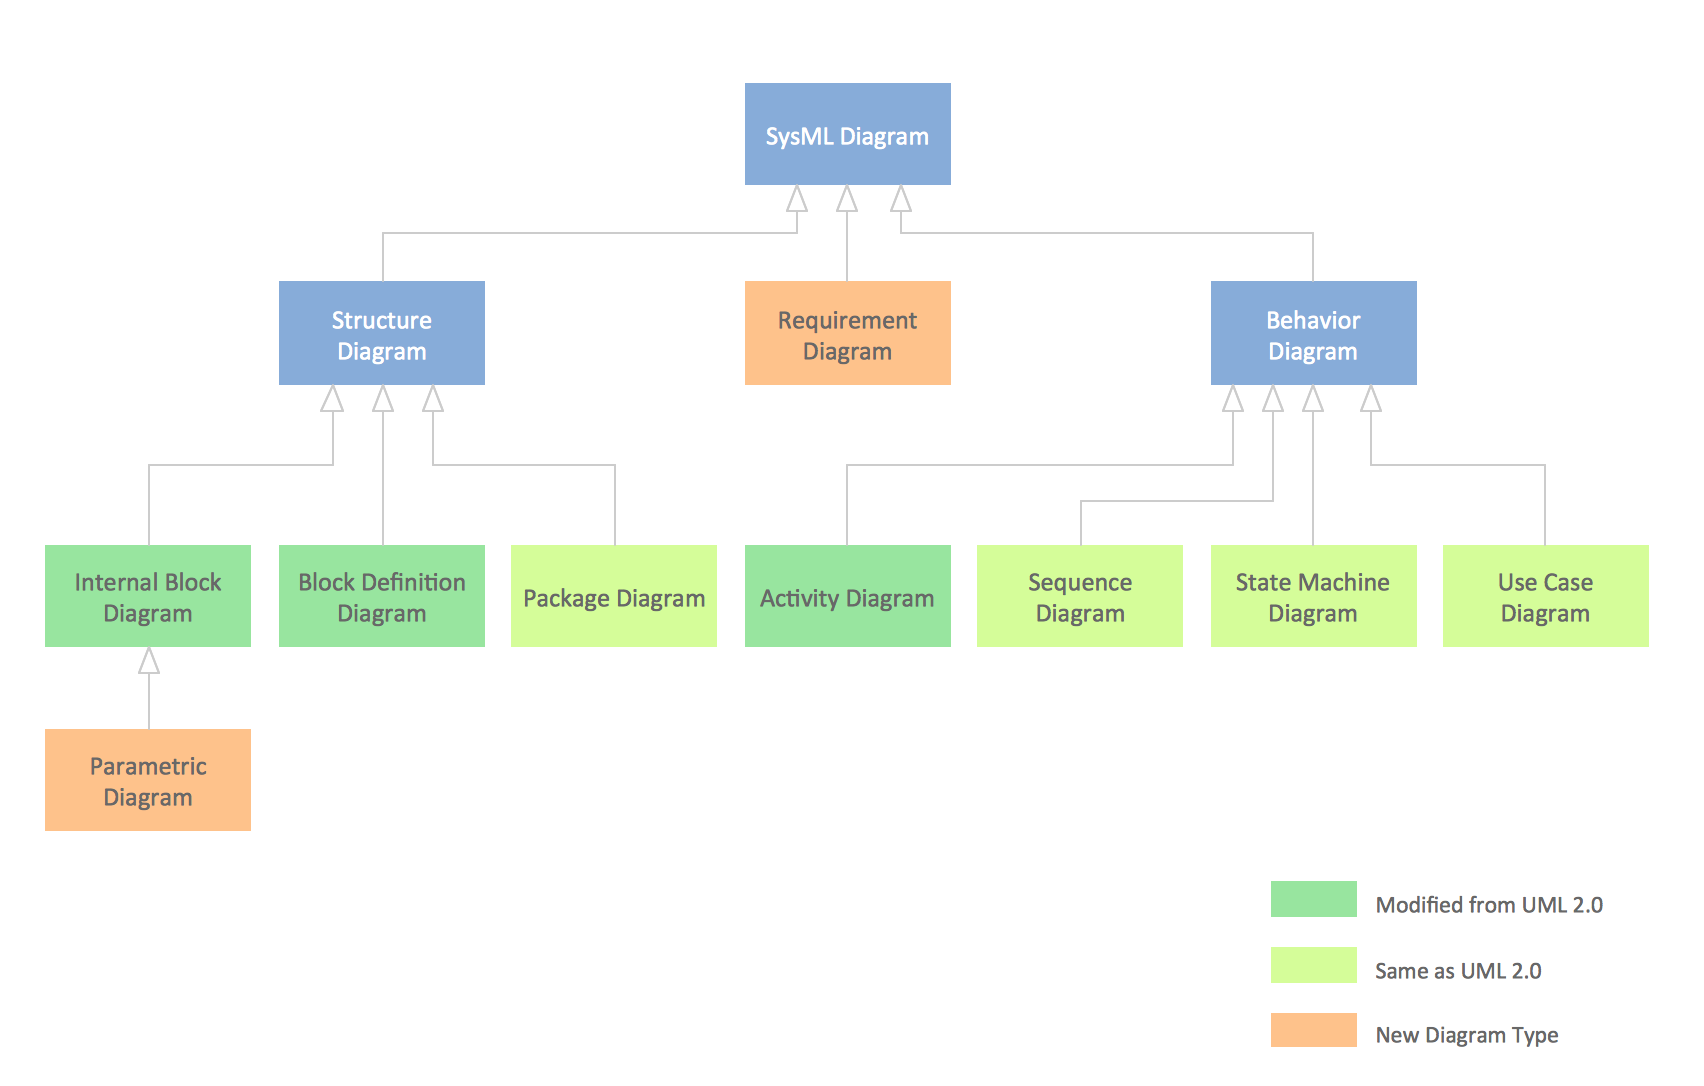
Picture: SysML Diagram
Related Solutions:
Bar charts represent data in different categories or groups.
Create bar graphs for visual solving your scientific problems and data comparison using the ConceptDraw DIAGRAM diagramming and vector drawing software extended with the Bar Graphs Solution from the Graphs and Charts area of ConceptDraw Solition Park.
Picture: Bar Diagrams for Problem Solving.Create space science bar charts with Bar Graphs Solution
Related Solution:
ConceptDraw DIAGRAM diagramming and vector drawing software offers the Pie Charts solution from the Graphs and Charts area which includes the tools for quick and easy designing any kind of Donut Chart.
Picture: Donut Chart
Related Solution:
Charting Software allows you to create diagrams, charts, graphs, flowcharts, and other business graphics. ConceptDraw DIAGRAM include simple shape drawing tools, examples, templates, and symbol libraries.
Picture: Create Graphs and Charts
Related Solution:
SWOT matrix templates is part of SWOT Analysis solution from ConceptDraw Solution Park.
Picture: SWOT matrix template
How to make a Concept Map fast and easy? ConceptDraw DIAGRAM diagramming and vector drawing software extended with Concept Maps Solution from the Diagrams Area is the best choice for those who want design professional looking Concept Map in minutes.
Picture: How To Make a Concept Map
Related Solution:
ConceptDraw DIAGRAM software extended with Picture Graphs solution is the best choice for making professional looking pictures of graphs and colorful picture graphs.
Picture: Pictures of Graphs
Related Solution:
Complete set of bar chart examples is produced using ConceptDraw software. Surfing bar chart examples you can find an example that is the best for your case.
Picture: Bar Chart Examples
Related Solution:
ConceptDraw is your tool for driving social integration and managing change across and streamline social media processes of your organisation.This tool keeps the entire team on the same page allowing you to realize your social media strategy, improve the quality of your answers, and minimize the time it takes to respond.
Picture: Social Media Response Management DFD Charts - software tools
Related Solution:
ConceptDraw DIAGRAM extended with Bar Graphs solution from Graphs and Charts area of ConceptDraw Solution Park is ideal software for quick and simple drawing bar chart of any complexity graph.
Picture: Bar Chart
Related Solution: