How can you illustrate the weather condition
|
ConceptDraw DIAGRAM is the design software with the vector stencils, examples, and templates set for drawing different types of diagrams. Nature solution as a part of this software includes various, colorful vector clip art that everyone can easily use for illustrating weather condition. |

Pic.1 Weather - Design elements.
Nature solution extends ConceptDraw DIAGRAM software with samples, templates and libraries of vector clipart for drawing of Nature illustrations.
Use Weather library of vector stencils to illustrate weathering activity.
See also Samples:
EIGHT RELATED HOW TO's:
Any business process consists from a number of tasks carrying out the certain business goal. It is useful to diagram business processes to ensure that they are as foolproof, logical and sequential as possible. This business process diagram describes a typical booking process flow by the example of a cab booking process. It can be used as a roadmap for any booking system implementation. Diagramming a business process allows you to look at the entire project and take into account all types of possible scenarios. Business process diagram helps you investigate and clarify the process thoroughly so that you can find out how it can be improved. Business process diagram supports team communications by ensuring that each process element is clear and everyone in the team is on the same page.
Sometimes your company brings you less profit than you expect it to be, and it’s difficult to reveal the causes. Maybe it’s time to learn new technologies, because business diagram are easily developed by means of special software, so you won’t make any extra effort. In return, you will increase your productivity and get more done in a less time.
Picture: Business Diagram Software
Related Solutions:
Biology is incredibly interesting and useful natural science which studies all living things on the earth (people, animals, plants), structure, functions, interactions, evolution of living organisms. Biologists of the whole world use actively illustrations and drawings in your science and education activity. To facilitate their task of biology drawing, ConceptDraw DIAGRAM diagramming and vector drawing software was extended with Biology solution from the Science and Education area. Now, ConceptDraw DIAGRAM is a powerful biology drawing software.
Picture: Biology Drawing Software
Related Solution:
ConceptDraw DIAGRAM is a powerful diagramming and vector drawing software. Extended with Workflow Diagrams solution from the Business Processes area, ConceptDraw DIAGRAM became the ideal Workflow Diagram Software.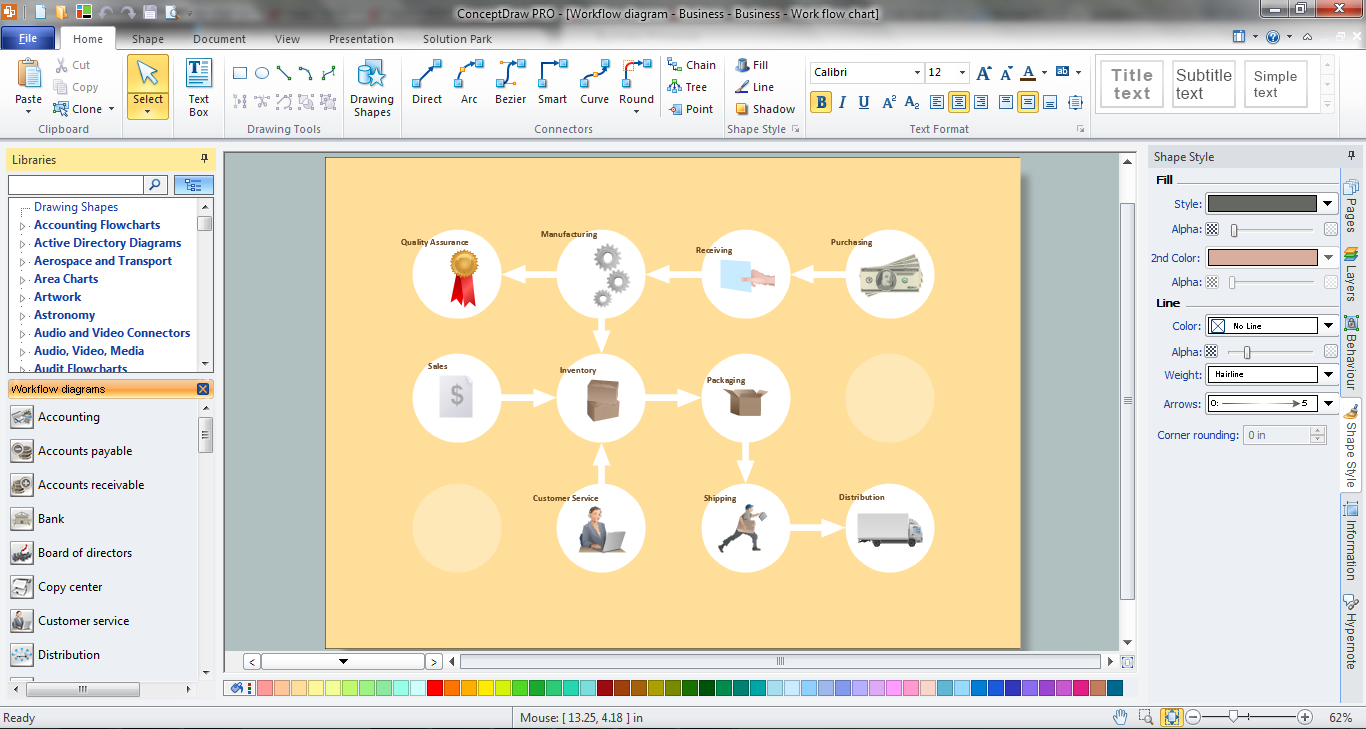
Picture: Workflow Diagram Software
Related Solution:
ConceptDraw DIAGRAM diagramming and vector drawing software extended with Physics solution from the Science and Education area is a powerful software for creating various physics diagrams.
Physics solution provides all tools that you can need for physics diagrams designing. It includes 3 libraries with predesigned vector physics symbols: Optics Library, Mechanics Library and Nuclear Physics Library.
Picture: Physics Symbols
Related Solution:
ConceptDraw DIAGRAM is a drawings software for creating Nature scenes. Nature solution from ConceptDraw Solution Park expands this software with a new library that contains 17 vector objects and samples illustration files.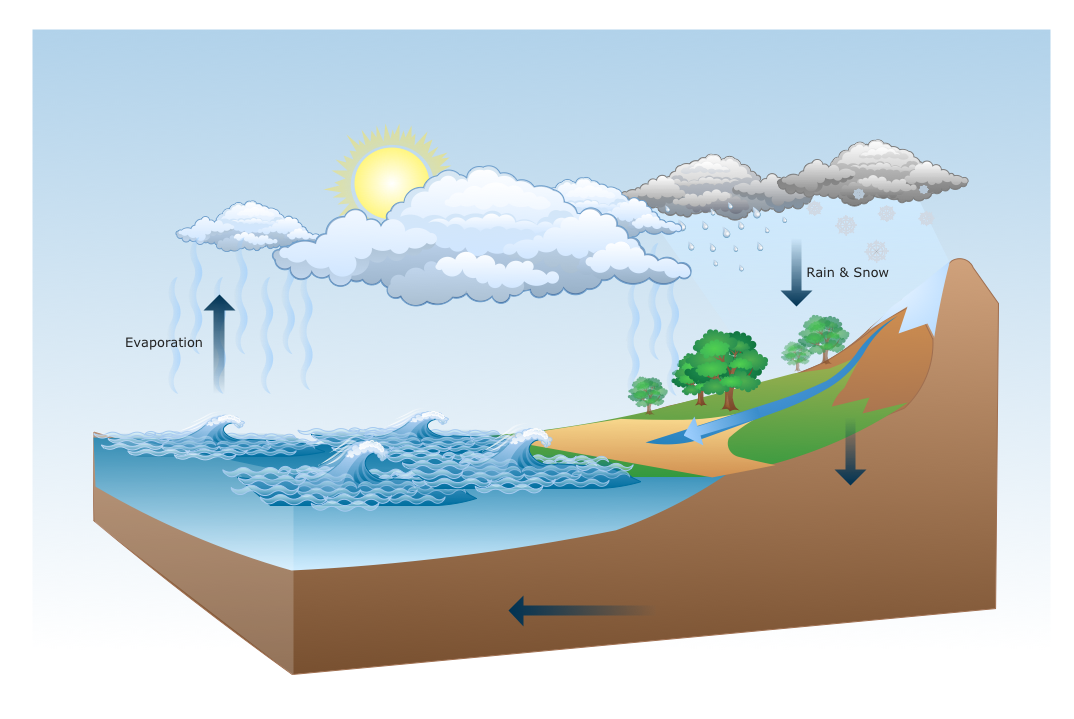
Picture: Drawing a Nature Scene
Florida is a state in the southeastern region of the United States, bordered to the west by the Gulf of Mexico, to the north by Alabama and Georgia, to the east by the Atlantic Ocean, and to the south by the Straits of Florida.
The vector stencils library Florida contains contours for ConceptDraw DIAGRAM diagramming and vector drawing software. This library is contained in the Continent Maps solution from Maps area of ConceptDraw Solution Park.
Picture: Geo Map — USA — Florida
Related Solution:
ConceptDraw DIAGRAM extended with Chemistry solution is effective for drawing various organic chemistry schemes, diagrams, illustrations thanks to the included collection of predesigned organic chemistry symbols
Picture: Organic Chemistry Symbols
Related Solution:
Are you an astronomer, astronomy teacher or student? And you need to draw astronomy pictures quick and easy? ConceptDraw DIAGRAM diagramming and vector drawing software extended with Astronomy solution from the Science and Education area will help you!
Astronomy solution provides 7 libraries with wide variety of predesigned vector objects of astronomy symbols, celestial bodies, solar system symbols, constellations, etc.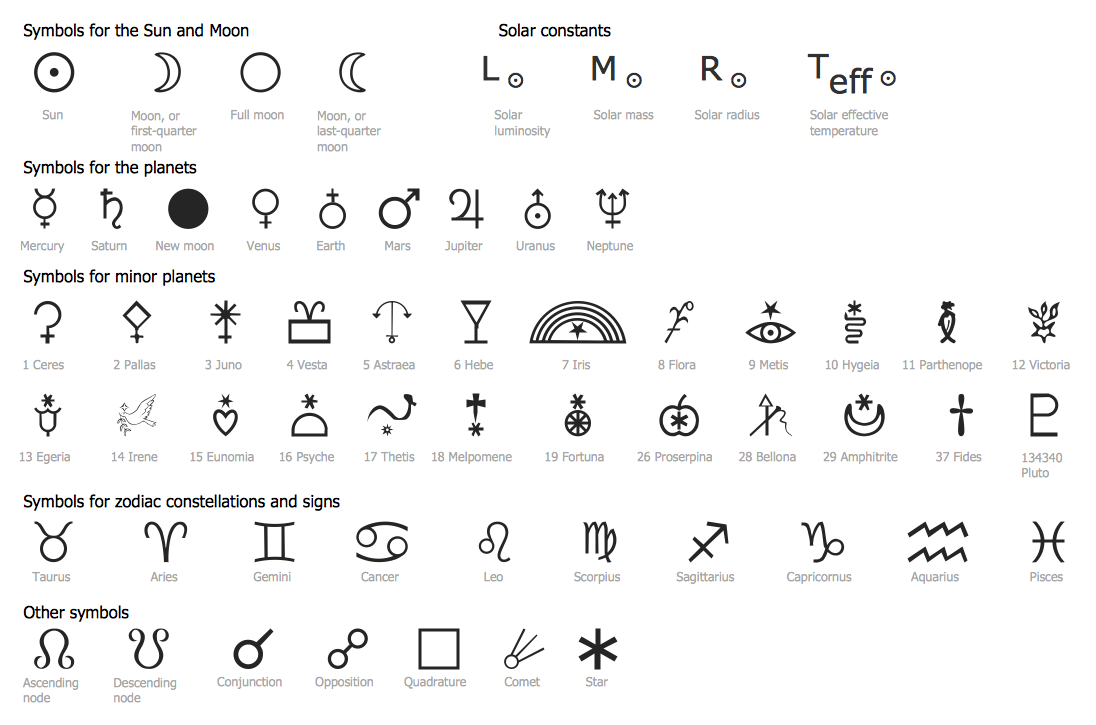
Picture: Astronomy Symbols
Related Solution:
ConceptDraw
DIAGRAM 18