
Example 1. Make an Infographic - International Education Infogram
ConceptDraw DIAGRAM lets the possibility to make an infographics in new blank document or use the predesigned template or sample as the base.
If you choose the first variant, you need create the new document and fill it - type the text, set the colorful background and add the ready clipart objects from the Education Infographics Solution libraries:
- Education Backgrounds
- Education Callout
- Education Charts
- Education Connectors
- Education Diagram
- Education Indicators
- Education List Blocks
- Education Maps
- Education Pictograms
- Education Title Blocks
- Education Titled Callouts
If you want to use the predesigned template or sample, choose it from the offered set in ConceptDraw STORE. You are able to use it as is or change for your needs.

Example 2. Education Pictograms Library Design Elements
All predesigned objects from the Education Infographics Solution libraries are bright, colorful and attractive, and are able to decorate and to make professional looking and successful any educational materials.

Example 3. Make an Infographic - An Affordable College Education is a Cornerstone of Middle Class Security
Use Education Infographics Solution for ConceptDraw DIAGRAM diagramming and vector drawing software to make an infographic for any thematic without efforts. Make them quick and easy, and then successfully use in the learning process.
All source documents are vector graphic documents. They are available for reviewing, modifying, or converting to a variety of formats (PDF file, MS PowerPoint, MS Visio, and many other graphic formats) from the ConceptDraw STORE. The Education Infographics Solution is available for ConceptDraw DIAGRAM or later users.
EIGHT RELATED HOW TO's:
Chemistry solution offers 6 libraries with large collection of vector chemistry symbols and meanings, chemistry equation symbols, organic chemistry symbols, and chemical clipart.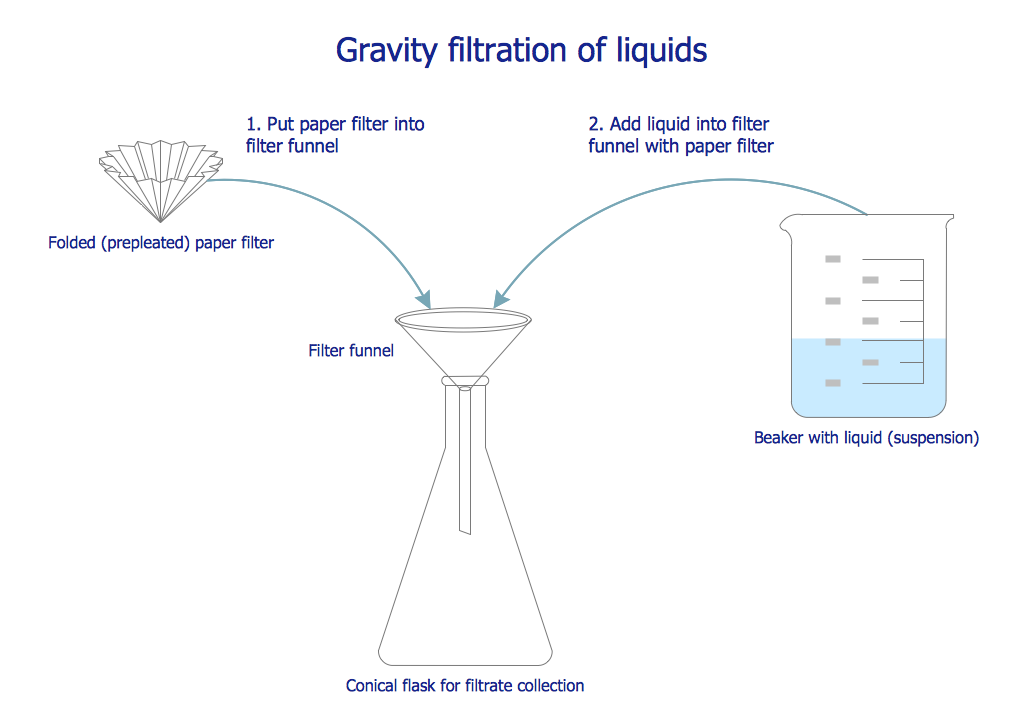
Picture: Chemistry Symbols and Meanings
Related Solution:
Are you an astronomer, astronomy teacher or student? And you need to draw astronomy pictures quick and easy? ConceptDraw DIAGRAM diagramming and vector drawing software extended with Astronomy solution from the Science and Education area will help you!
Astronomy solution provides 7 libraries with wide variety of predesigned vector objects of astronomy symbols, celestial bodies, solar system symbols, constellations, etc.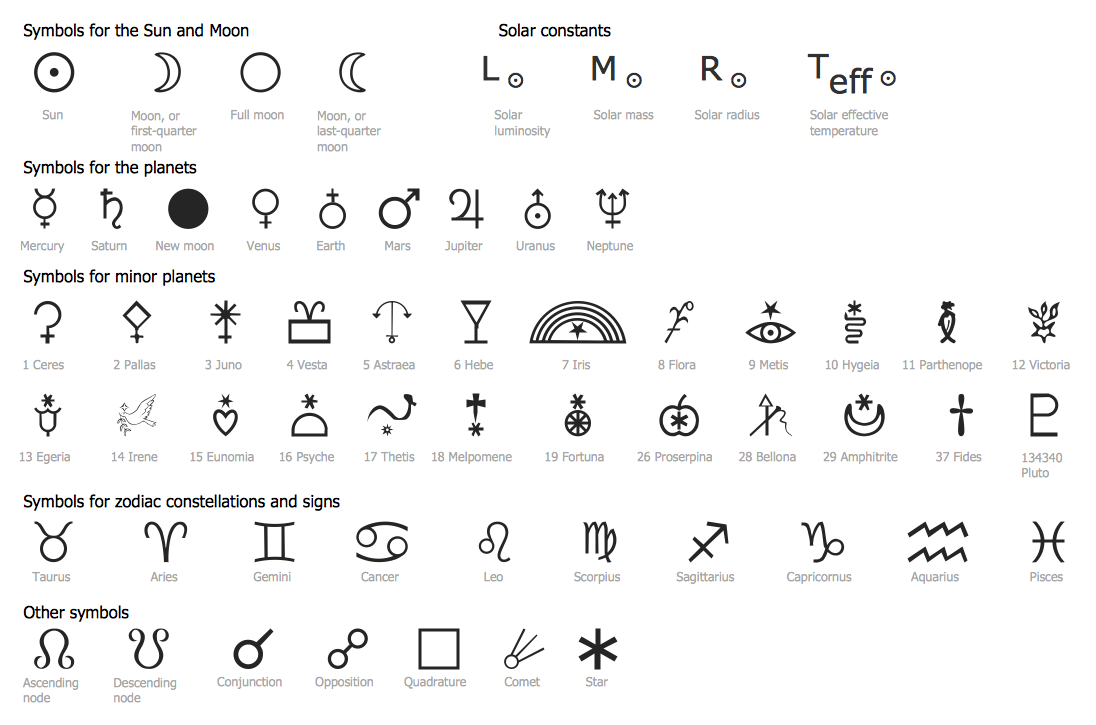
Picture: Astronomy Symbols
Related Solution:
Being is an accurate representation of some distribution of numerical data, any histogram is one of the most commonly used drawings that can be also created with the help of the ConceptDraw DIAGRAM.
Picture: Making a Histogram
Related Solution:
When you need a drawing software to create a professional looking cross-functional charts, ConceptDraw with its Arrows10 Technology - is more than enough versatility to draw any type of diagram with any degree of complexity.
Use templates with process maps, diagrams, charts to get the drawing in minutes.
Picture: Cross-Functional Process Map Template
ConceptDraw DIAGRAM diagramming and vector drawing software extended with Wireless Networks Solution gives the ability to its users to create professional looking WLAN schemes and diagrams quick and easy.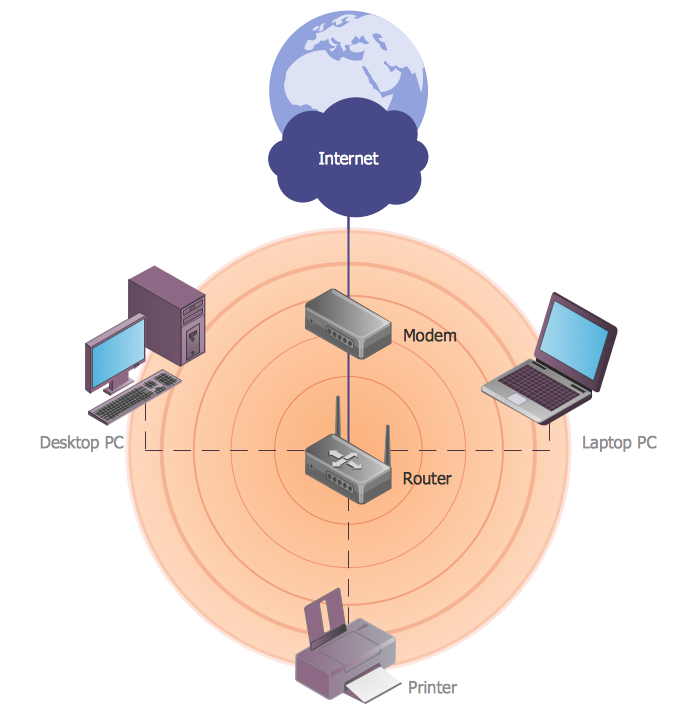
Picture: WLAN
Related Solution:
The best bar chart software ever is ConceptDraw. ConceptDraw bar chart software provides an interactive bar charting tool and complete set of predesigned bar chart objects.
Picture: Bar Chart Software
Related Solution:
Public health is the theoretical basis of health care, which is aimed at the study and analysis of health-improving effect and adverse influence of varied social factors and conditions on the people health, the monitoring and observation health indicators, prolongation human life, prevention and treatment diseases. In order the efforts on creation an illustration or diagram on health or health science thematic will be immediately succeed, you need quite a bit - just convenient and professional ConceptDraw DIAGRAM software with a lot of drawing tools and ready-made vector objects.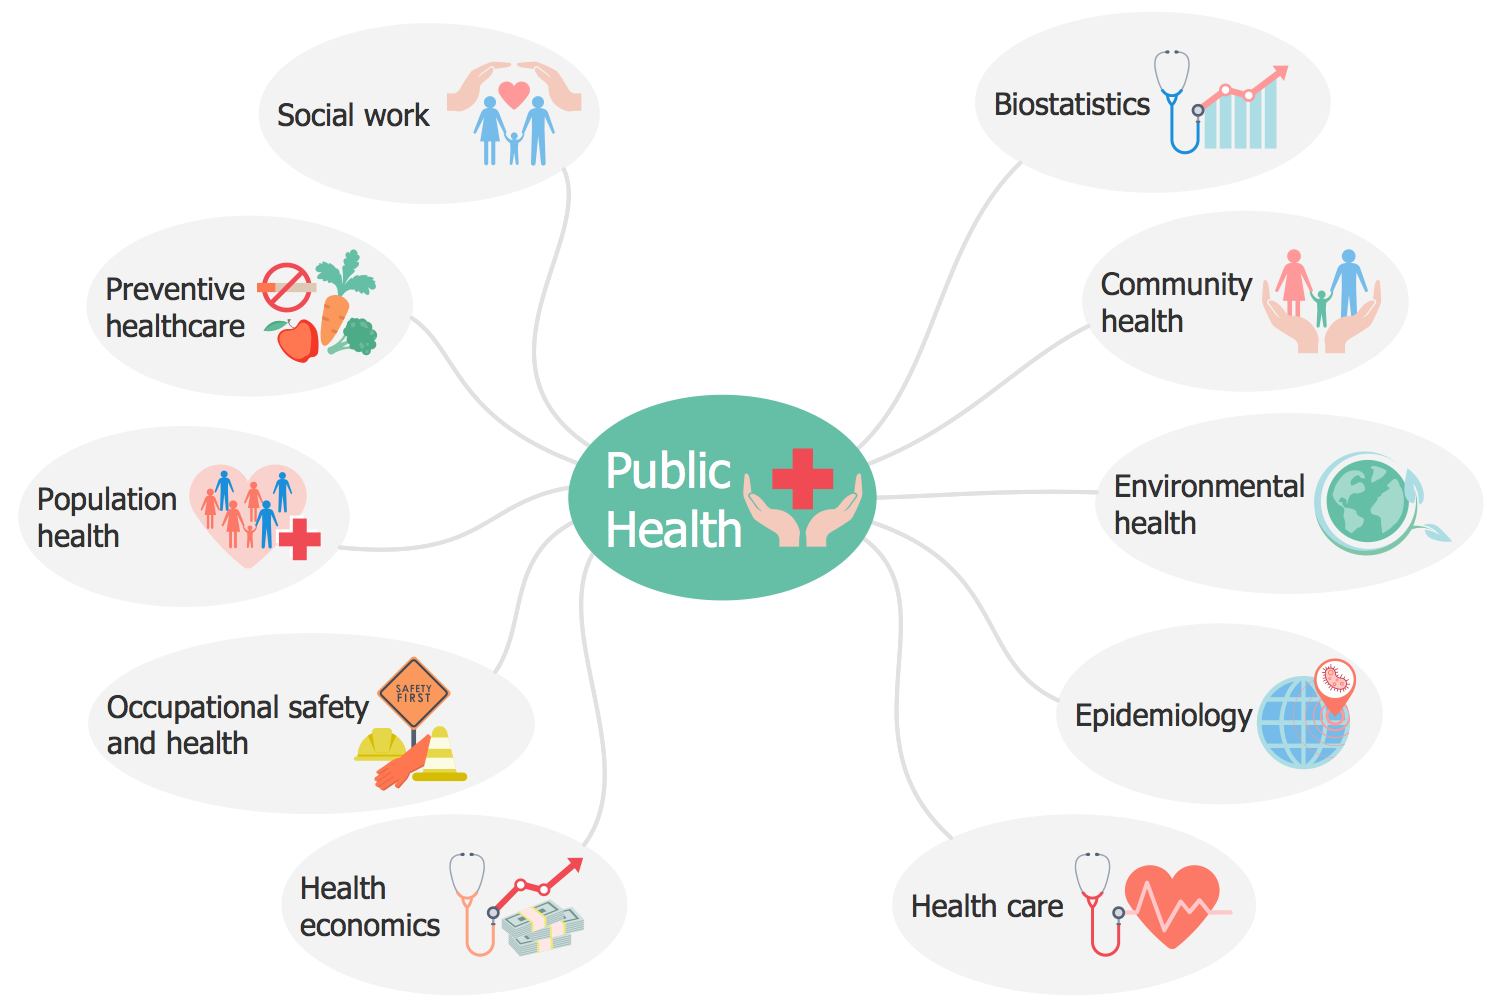
Picture: Public Health
Related Solution:
Infographic is a visual way of representing various information, data, knowledge in statistics, geography, journalism, education, and much more areas. ConceptDraw DIAGRAM supplied with Pictorial Infographics Solution from the “Infographics” Area, provides a set of powerful pictorial infographics tools. Thanks to them it is the best Infographic Maker.
Picture: Infographic Maker
Related Solution:

