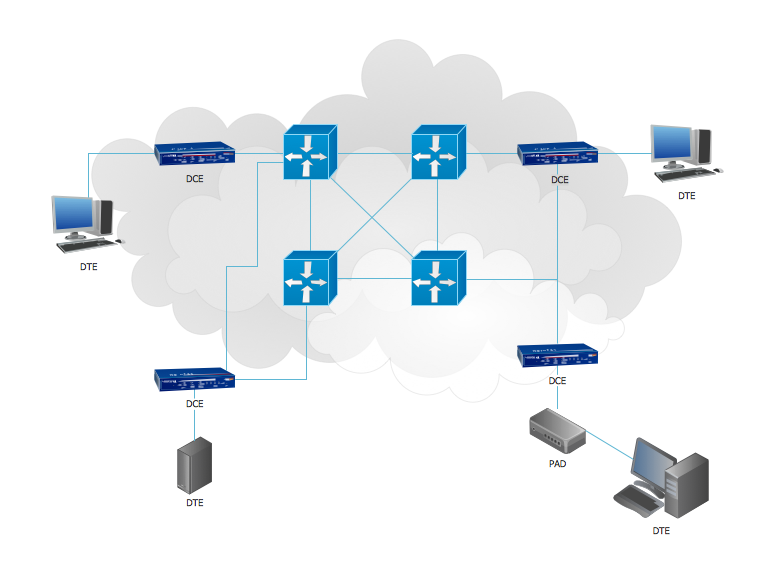
Example 1. 3D Network Diagrams.
This example shows the 3D Network Diagram. It was created in ConceptDraw DIAGRAM using the 3D network elements from the Computer and Networks solution from the Computer and Networks area of ConceptDraw Solution Park.
All network diagrams designed with ConceptDraw DIAGRAM are vector graphic documents and are available for reviewing, modifying, and converting to a variety of formats (image, HTML, PDF file, MS PowerPoint Presentation, Adobe Flash or MS Visio).
See also Samples:
TEN RELATED HOW TO's:
ConceptDraw DIAGRAM diagramming and vector drawing software provides the Telecommunication Network Diagrams Solution from the Computer and Networks Area for quick and easy drawing the Telecommunications Networks.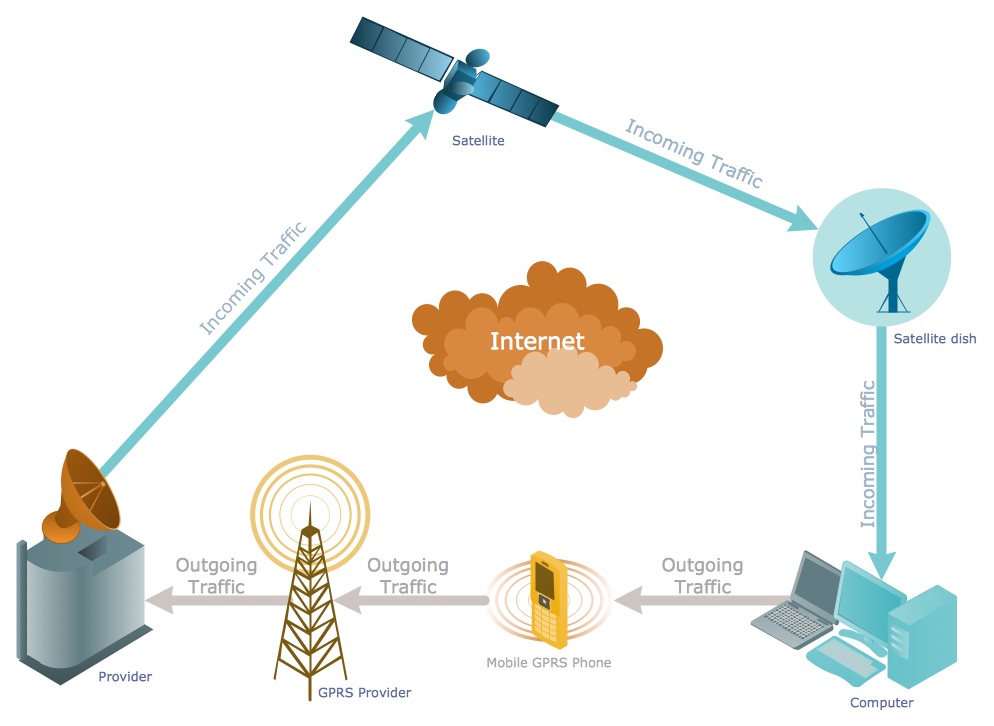
Picture: Telecommunications Networks
Related Solution:
Chemical and Process Engineering solution contains variety predesigned process flow diagram elements relating to instrumentation, containers, piping and distribution necessary for chemical engineering, and can be used to map out chemical processes or easy creating various Chemical and Process Flow Diagrams in ConceptDraw DIAGRAM.
Picture: Process Flow Diagram Symbols
Related Solution:
Graphics Technology looks at how to communicate graphically, develop ability to create graphical presentations for varied needs, understand standards and special conventions, develop specific techniques and build an understanding of the impact of graphical presentation on society.
If you want to use effective methods for your work, you may need a tool which may let you represent your ideas and goals in graphic way.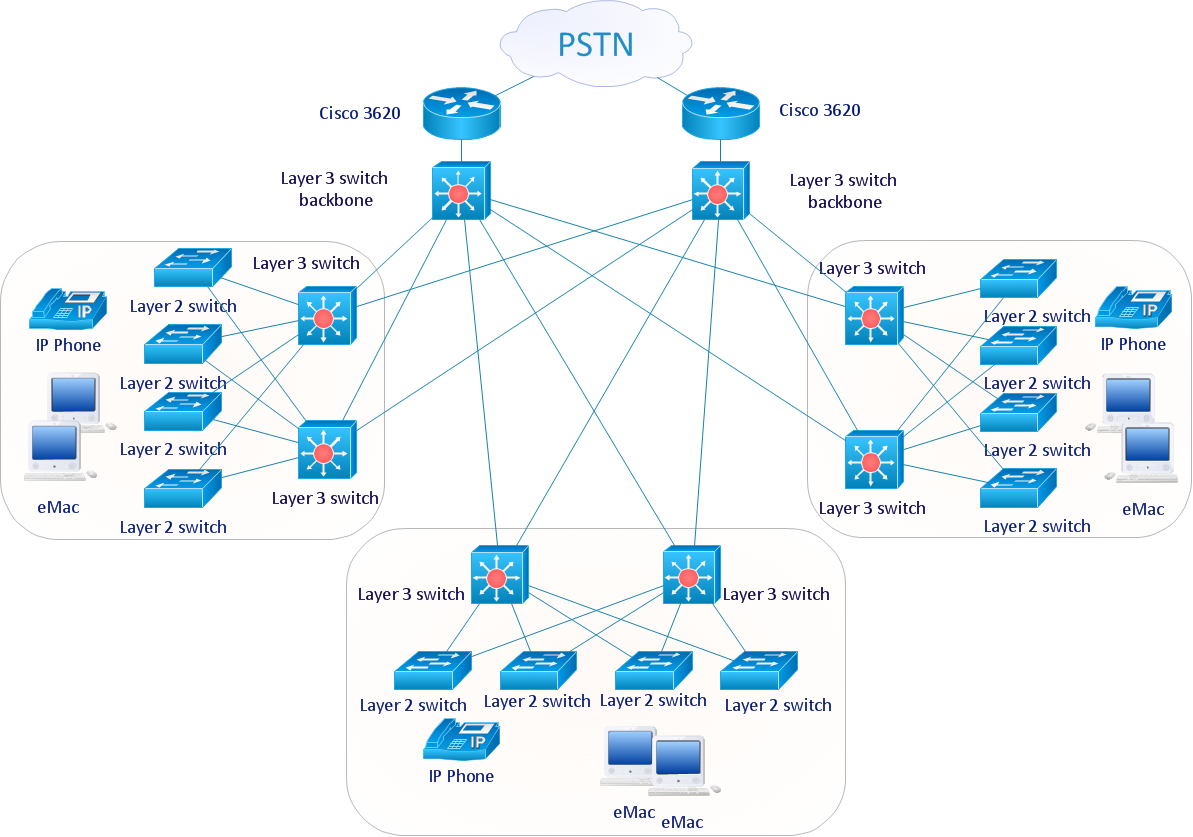
Picture: Graphic Technologies
Software development flourishes nowadays. Students have tons of educational information and courses that would fit every taste. And it's no secret that knowing how to draw data flow diagrams is a useful skill for a future software architect. The diagrams help a lot in understanding how to storage data effectively and how data processes within a system.
This data flow diagram represents the model of small traditional production enterprise. It was created using Yourdon and Coad notation. The data flow diagram include four main objects: entity, process, data store and data flow. Yourdon and Coad notation uses circles to depict processes and parallel lines to represent data stores. Dataflows are shown as arrowed lines. They are labeled with the description of the data that move through them. Dataflow's role is to deliver the pieces of information. A process's function is to transform. the input data flow into output data flow. ConceptDraw Data Flow Diagrams solution contains the data flow diagram symbols of both Yourdon-Coad and Gane-Sarson notations and a set of handy templates to get started with DFD.
Picture: Data Flow Diagrams
Related Solution:
Whenever you need quick presentations, the ability to choose specific content, the ability to focus on specific stakeholder needs, update data, or create polished slide decks — ConceptDraw MINDMAP provides a presentation solution for you.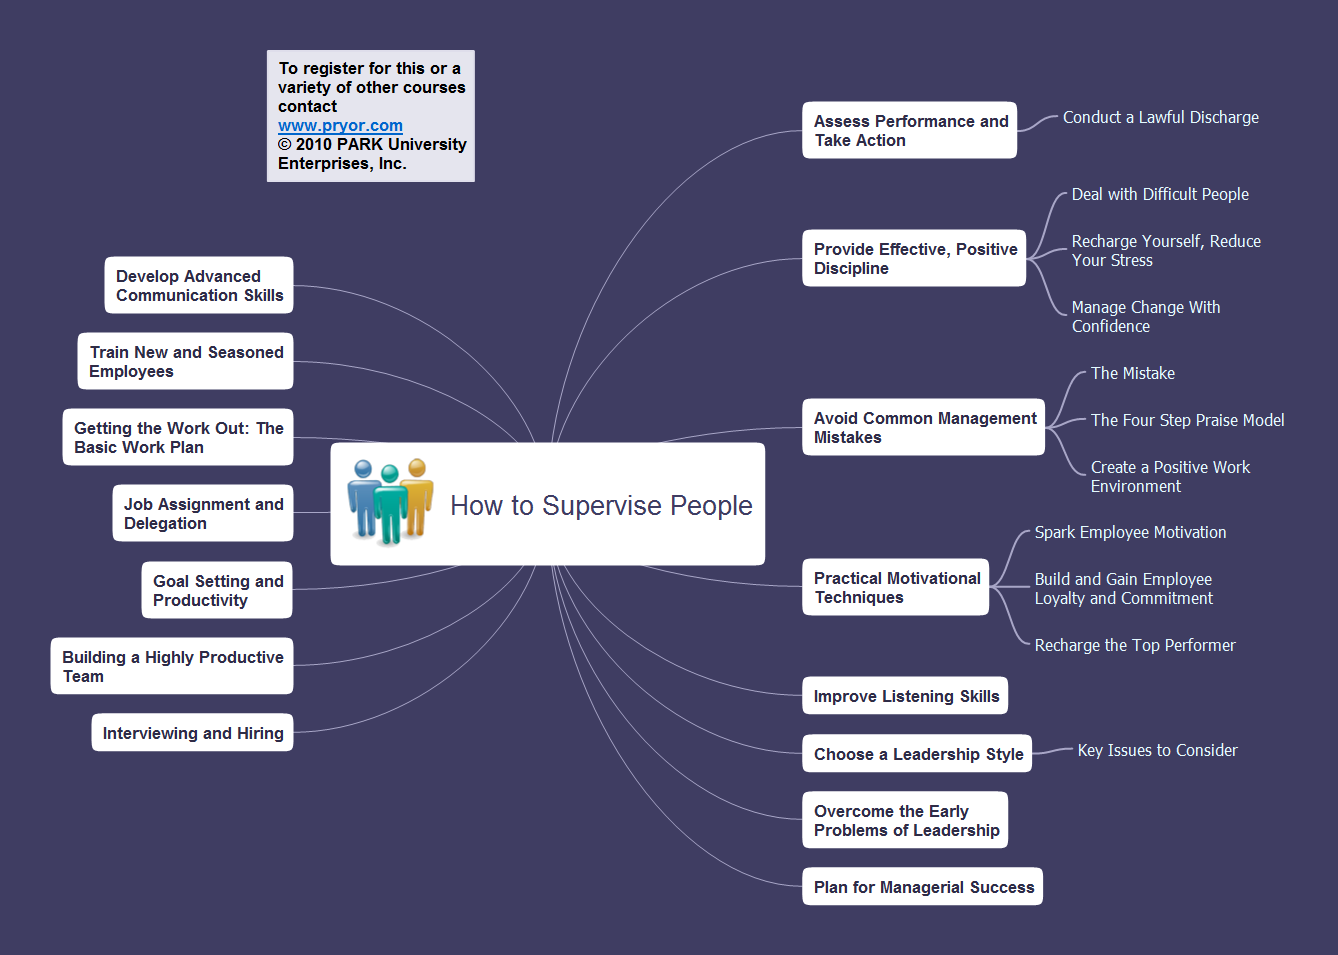
Picture: Presentation Preparation using Mind Maps
Related Solution:
If we divide computer networks by scale, we get several main categories. The smallest network is PAN, as it connects personal devices themselves, and as the number of users grows, a local area network can be recognized, and campus area networks (CAN) connects several local networks located within some area like a university or a corporation. Computers connected to CAN share public educational materials and list of CAN network examples includes such prestigious universities like Stanford and Carnegie Mellon.
This is an example of a computer network diagram created for a campus area network. It was created using using ConceptDraw solution for the Computer and Network diagramming. The specific of this sample campus network is its distribution. It is rather broad to embrace a big campus territory. This diagram can be applied as a template for designing custom area network topology diagram for a particular educational institution.
Picture: Campus Area Networks (CAN). Computer and Network Examples
Related Solution:
ConceptDraw DIAGRAM is perfect for software designers and software developers who need to draw IVR Network Diagrams.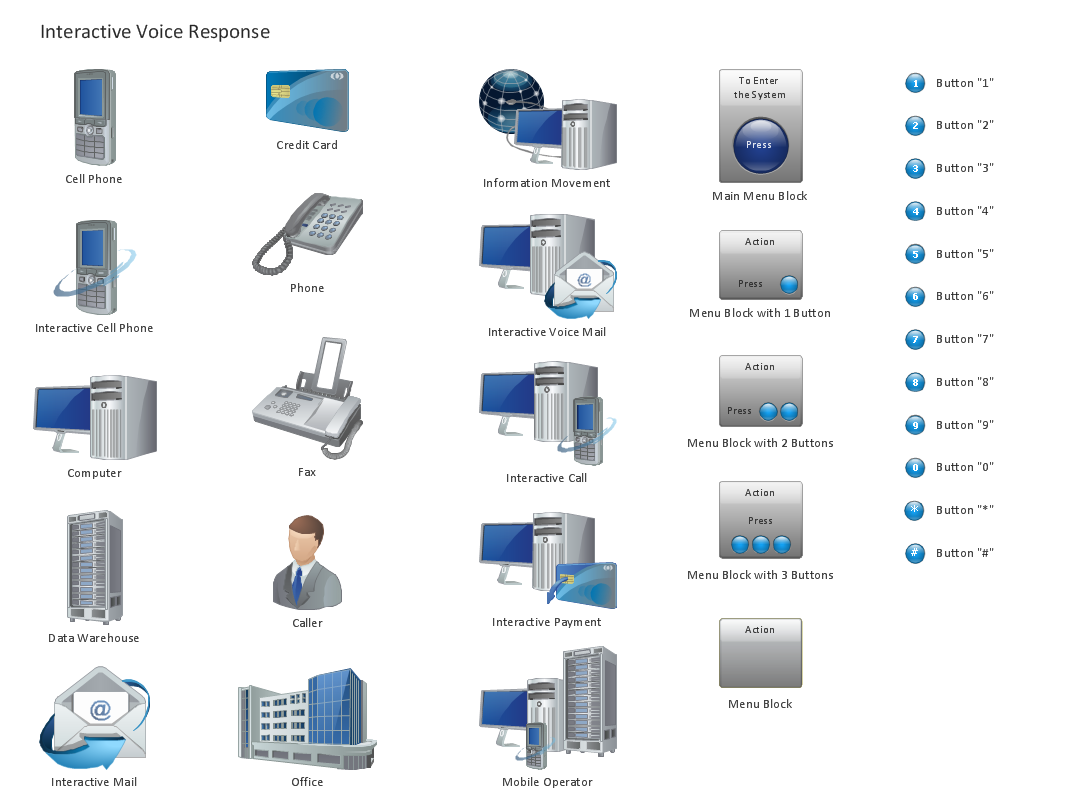
Picture: Design Element: IVR for Network Diagrams
Physical network represents the computer network topology that includes the computer devices, location and cable installation. Physical network includes the actual nodes, segments and hosts.
This example was created in ConceptDraw DIAGRAM using the Computer and Networks Area of ConceptDraw Solution Park and shows the Physical star network.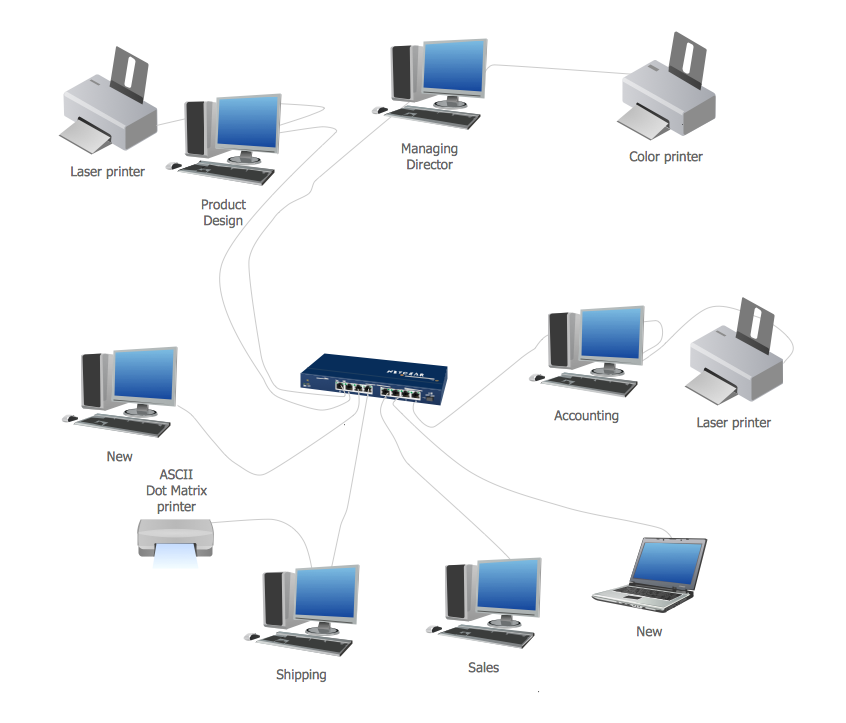
Picture: Physical network. Computer and Network Examples
Related Solution:
This example shows the computer network diagram of the guesthouse Wi-Fi connection to the Internet. On the diagram is displayed the arrangement of the WLAN equipment that provides the Wi-Fi (Wireless Fidelity) access to the Internet on the guesthouse territory.
This sample was created in ConceptDraw DIAGRAM diagramming and vector drawing software using the Computer and Networks solution from Computer and Networks area of ConceptDraw Solution Park.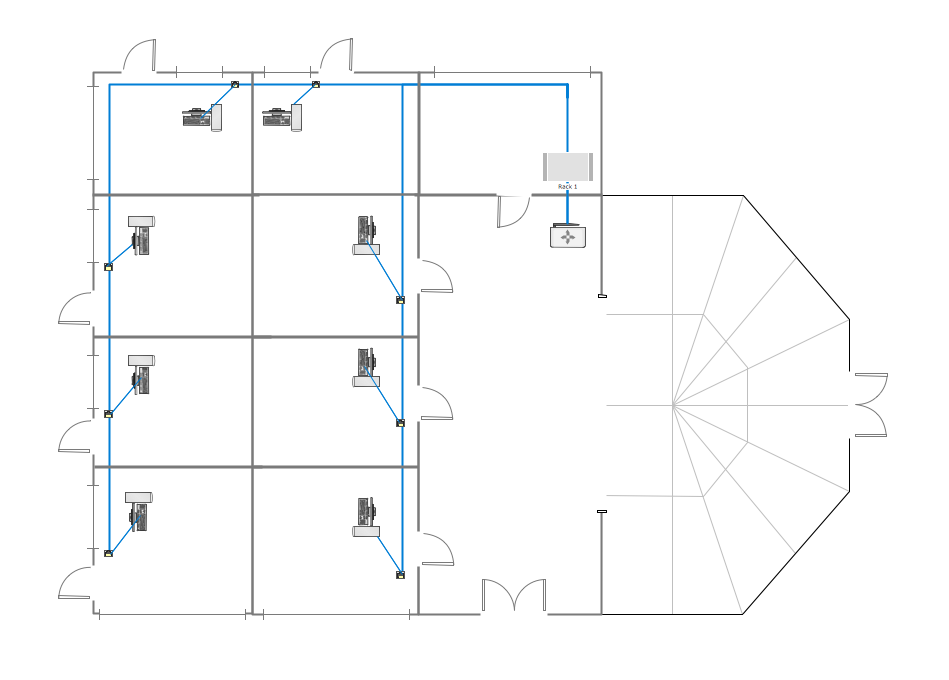
Picture: Guesthouse Network. WIFI network to my guest house
Related Solution:
A Telecommunications network is a network of nodes, links, trunks and telephone switches that are connected, operated by telephone companies and realize telephone, audio, visual and data communications among the users. The telecommunications network can also include Internet, microwave, wireless equipment.
This example was created in ConceptDraw DIAGRAM using the Computer and Networks Area of ConceptDraw Solution Park and shows the Telecommunications network.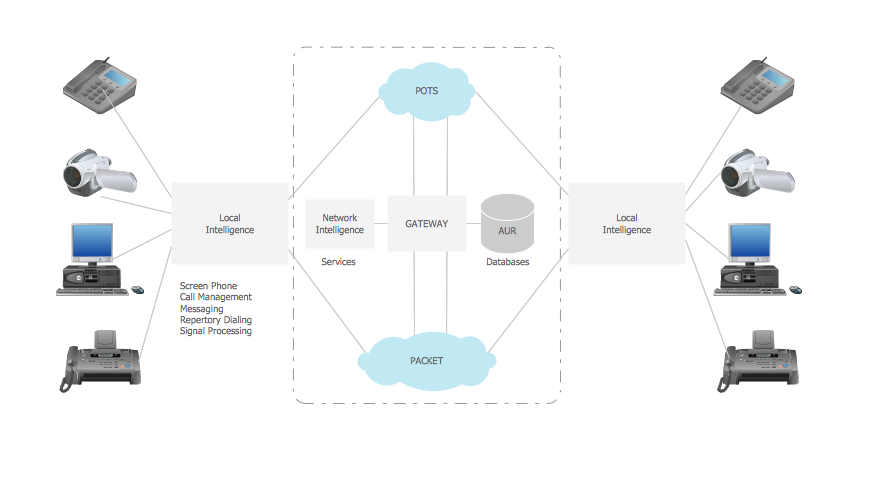
Picture: Telecommunication networks. Computer and Network Examples
Related Solution: