
Example 1. Bubble Map Maker
Business Diagrams Solution provides a Bubble Diagrams Library with variety of predesigned vector shapes. Look at these ready-to use bubbles, they are so different! Thanks to them the Bubble Map creating will take only a few minutes. ConceptDraw DIAGRAM is excellent Bubble Map Maker!

Example 2. Bubble Diagrams Library Design Elements
Another way of drawing a Bubble Map in ConceptDraw DIAGRAM is to use as the base the predesigned template or sample. The whole collection of them is available from ConceptDraw STORE. Choose that which meets your requirements and change it for your needs.

Example 3. Business Diagrams Solution in ConceptDraw STORE
The following features make ConceptDraw DIAGRAM the best Bubble Map Maker:
- You don't need to be an artist to draw professional looking diagrams in a few minutes.
- Large quantity of ready-to-use vector objects makes your drawing diagrams quick and easy.
- Great number of predesigned templates and samples give you the good start for your own diagrams.
- ConceptDraw DIAGRAM provides you the possibility to use the grid, rules and guides. You can easily rotate, group, align, arrange the objects, use different fonts and colors to make your diagram exceptionally looking.
- All ConceptDraw DIAGRAM documents are vector graphic files and are available for reviewing, modifying, and converting to a variety of formats: image, HTML, PDF file, MS PowerPoint Presentation, Adobe Flash, MS Visio.
- Using ConceptDraw STORE you can navigate through ConceptDraw Solution Park, managing downloads and updates. You can access libraries, templates and samples directly from the ConceptDraw STORE.
- If you have any questions, our free of charge support is always ready to come to your aid.
TEN RELATED HOW TO's:
This sample was created in ConceptDraw DIAGRAM diagramming and vector drawing software using the Bubble Diagrams Solution from the Diagrams area of ConceptDraw Solution Park.
This sample clearly shows the Four Dimensions Bubble Diagram of the distribution of chlorine contaminant in the water source. This Bubble Diagram is very useful in the chemistry, hydrology, and ecology.
Picture: Four Dimensions Bubble Plot
Related Solution:
How to make a Concept Map fast and easy? ConceptDraw DIAGRAM diagramming and vector drawing software extended with Concept Maps Solution from the Diagrams Area is the best choice for those who want design professional looking Concept Map in minutes.
Picture: How To Make a Concept Map
Related Solution:
When trying to figure out the nature of the problems occurring within a project, there are many ways to develop such understanding. One of the most common ways to document processes for further improvement is to draw a process flowchart, which depicts the activities of the process arranged in sequential order — this is business process management. ConceptDraw DIAGRAM is business process mapping software with impressive range of productivity features for business process management and classic project management. This business process management software is helpful for many purposes from different payment processes, or manufacturing processes to chemical processes. Business process mapping flowcharts helps clarify the actual workflow of different people engaged in the same process. This samples were made with ConceptDraw DIAGRAM — business process mapping software for flowcharting and used as classic visio alternative because its briefly named "visio for mac" and for windows, this sort of software named the business process management tools.
This flowchart diagram shows a process flow of project management. The diagram that is presented here depicts the project life cycle that is basic for the most of project management methods. Breaking a project into phases allows to track it in the proper manner. Through separation on phases, the total workflow of a project is divided into some foreseeable components, thus making it easier to follow the project status. A project life cycle commonly includes: initiation, definition, design, development and implementation phases. Distinguished method to show parallel and interdependent processes, as well as project life cycle relationships. A flowchart diagram is often used as visual guide to project. For instance, it used by marketing project management software for visualizing stages of marketing activities or as project management workflow tools. Created with ConceptDraw DIAGRAM — business process mapping software which is flowcharting visio alternative or shortly its visio for mac, this sort of software platform often named the business process management tools.
Picture: Process Flowchart: A Step-by-Step Comprehensive Guide
Related Solution:
ConceptDraw DIAGRAM is the professional business graphic software for drawing diagrams and charts with great visual appeal on Mac OS X.
Picture: The Best Drawing Program for Mac
Related Solution:
Electrical plan is a document that is developed during the first stage of the building design. This scheme is composed of conventional images or symbols of components that operate by means of electric energy. To simplify the creation of these schemes you can use house electrical plan software, which will not require a long additional training to understand how to use it. You only need to install the necessary software ant it’s libraries and you’ll have one less problem during the building projection.
Any building contains a number of electrical systems, including switches, fixtures, outlets and other lightening equipment. All these should be depicted in a building electrical plans and included to general building documentation. This home electrical plan displays electrical and telecommunication devices placed to a home floor plan. On the plan, each electrical device is referenced with the proper symbol. Electrical symbols are used for universal recognition of the building plan by different persons who will be working on the construction. Not all possible electric symbols used on a certain plan, so the symbols used in the current home plan are included to a legend. The electrical home plan may be added as a separate document to a complete set of building plans.
Picture: How To use House Electrical Plan Software
Related Solution:
Create value stream maps - for value stream analysis and value stream management, material and information flow mapping, using our quick start templates included with ConceptDraw.
Picture: Value-Stream Mapping for Manufacturing
Related Solution:
The power, economy, and versatility of ConceptDraw MINDMAP takes personnel and team productivity to another level. Discover today what this means to you.
Picture: Mind Map Making Software
Related Solution:
Bubble diagrams solution extends ConceptDraw DIAGRAM software with templates, Using ConceptDraw Connectors, you can create a bubble chart in moments.
Using ConceptDraw you will be able to create a bubble chart from the ready ConceptDraw library objects or make your own objects. The created diagram can represent ideas organization, in brainstorming processes, by teachers for explaining difficult ideas or for presentations.
Picture: How To Create a Bubble Chart
Related Solution:
Collaborating with co-workers is very important, not only in order to get things done effectively, but also to keep in touch with the outside world. Great way for business collaboration is Skype.
Picture: Online Collaboration via Skype
Related Solution:
This template shows the restaurant floor plan for kids. The floor plans are necessary for architects, builders, designers. It’s very simple, convenient and quick to design the professional looking Floor Plans of any difficulty in ConceptDraw DIAGRAM.
Use the ready-to-use predesigned objects, templates and samples from the Floor Plans Solution for ConceptDraw DIAGRAM you can create your own Floor Plans quick and easy.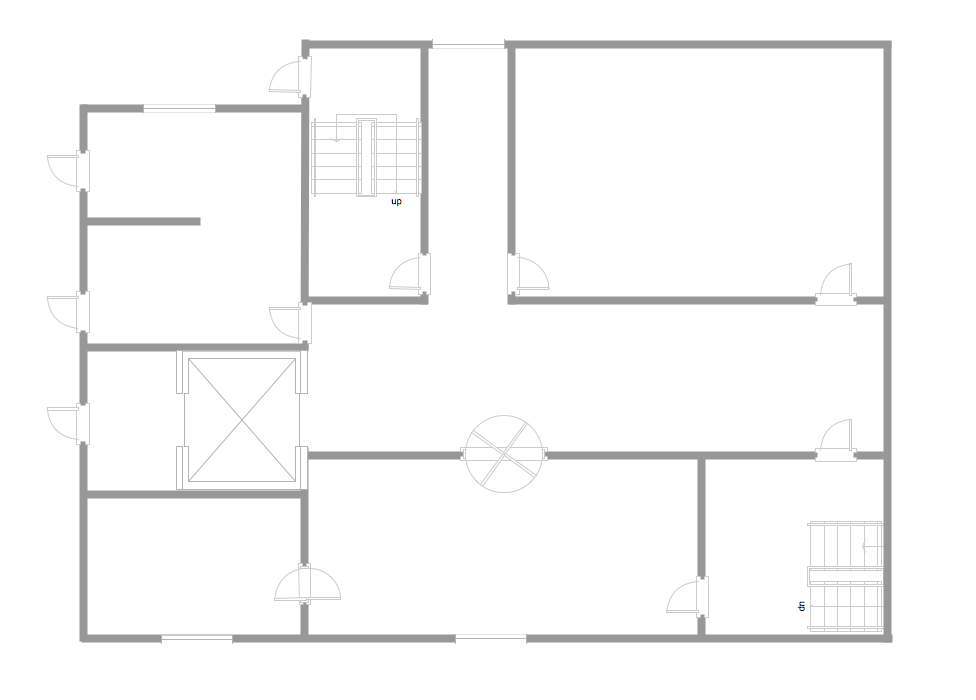
Picture: Template Restaurant Floor Plan for Kids
Related Solution:

