How to Draw an Effective Flowchart
Use the ConceptDraw DIAGRAM
The ConceptDraw DIAGRAM is a program for making flow charts. In the basic package you will find the set of samples and templates. The vector stencils created by designers from object libraries allows you to use RapidDraw technology. By the clicking on direction arrows one can add new object to flowcharts.

Sample 1. Flowchart - Stages of personnel certification.
This example of business process flow chart visualizes the stages of personnel certification.
Use ConceptDraw DIAGRAM diagramming and business graphics software to draw your own flowcharts of business processes.
See also Samples:
TEN RELATED HOW TO's:
ConceptDraw DIAGRAM diagramming and vector drawing software enhanced with powerful HR Flowcharts Solution perfectly suits for Human Resource Management.
Picture: Human Resource Management
Related Solution:
Now, thanks to the new HR Flowcharts Solution, it become also ideal for designing HR Flowcharts and visually displaying the hiring process steps.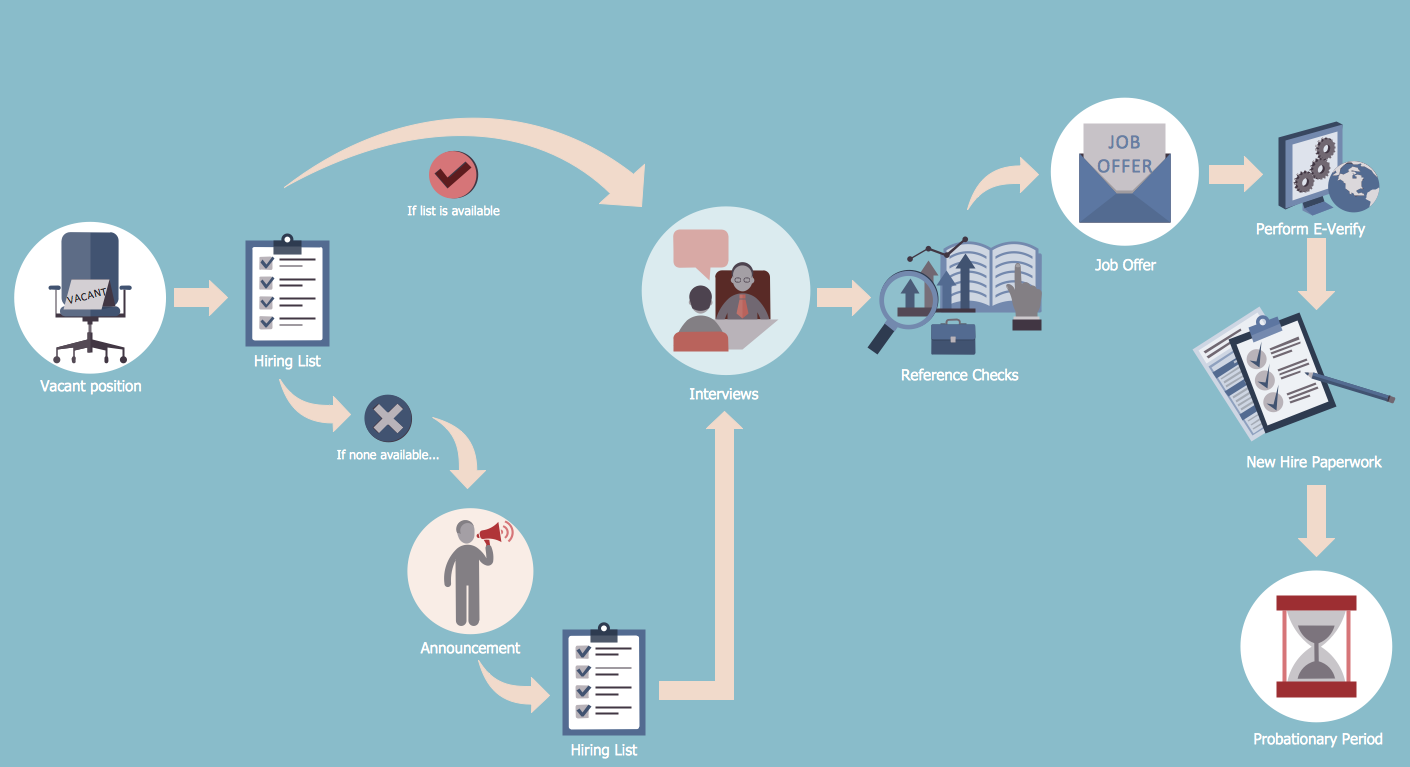
Picture: Hiring Process Steps
Related Solution:
When you need to draw a professional management drawing, these management design elements, samples, templates and libraries with vector clip art for drawing the Marketing Illustrations. Conceptdraw symbols and signs you can use in your design for Strategic Management, Graphic Design, Planning implementation and more.
You can create and view impact analysis drawings from specific design elements to examine the tasks.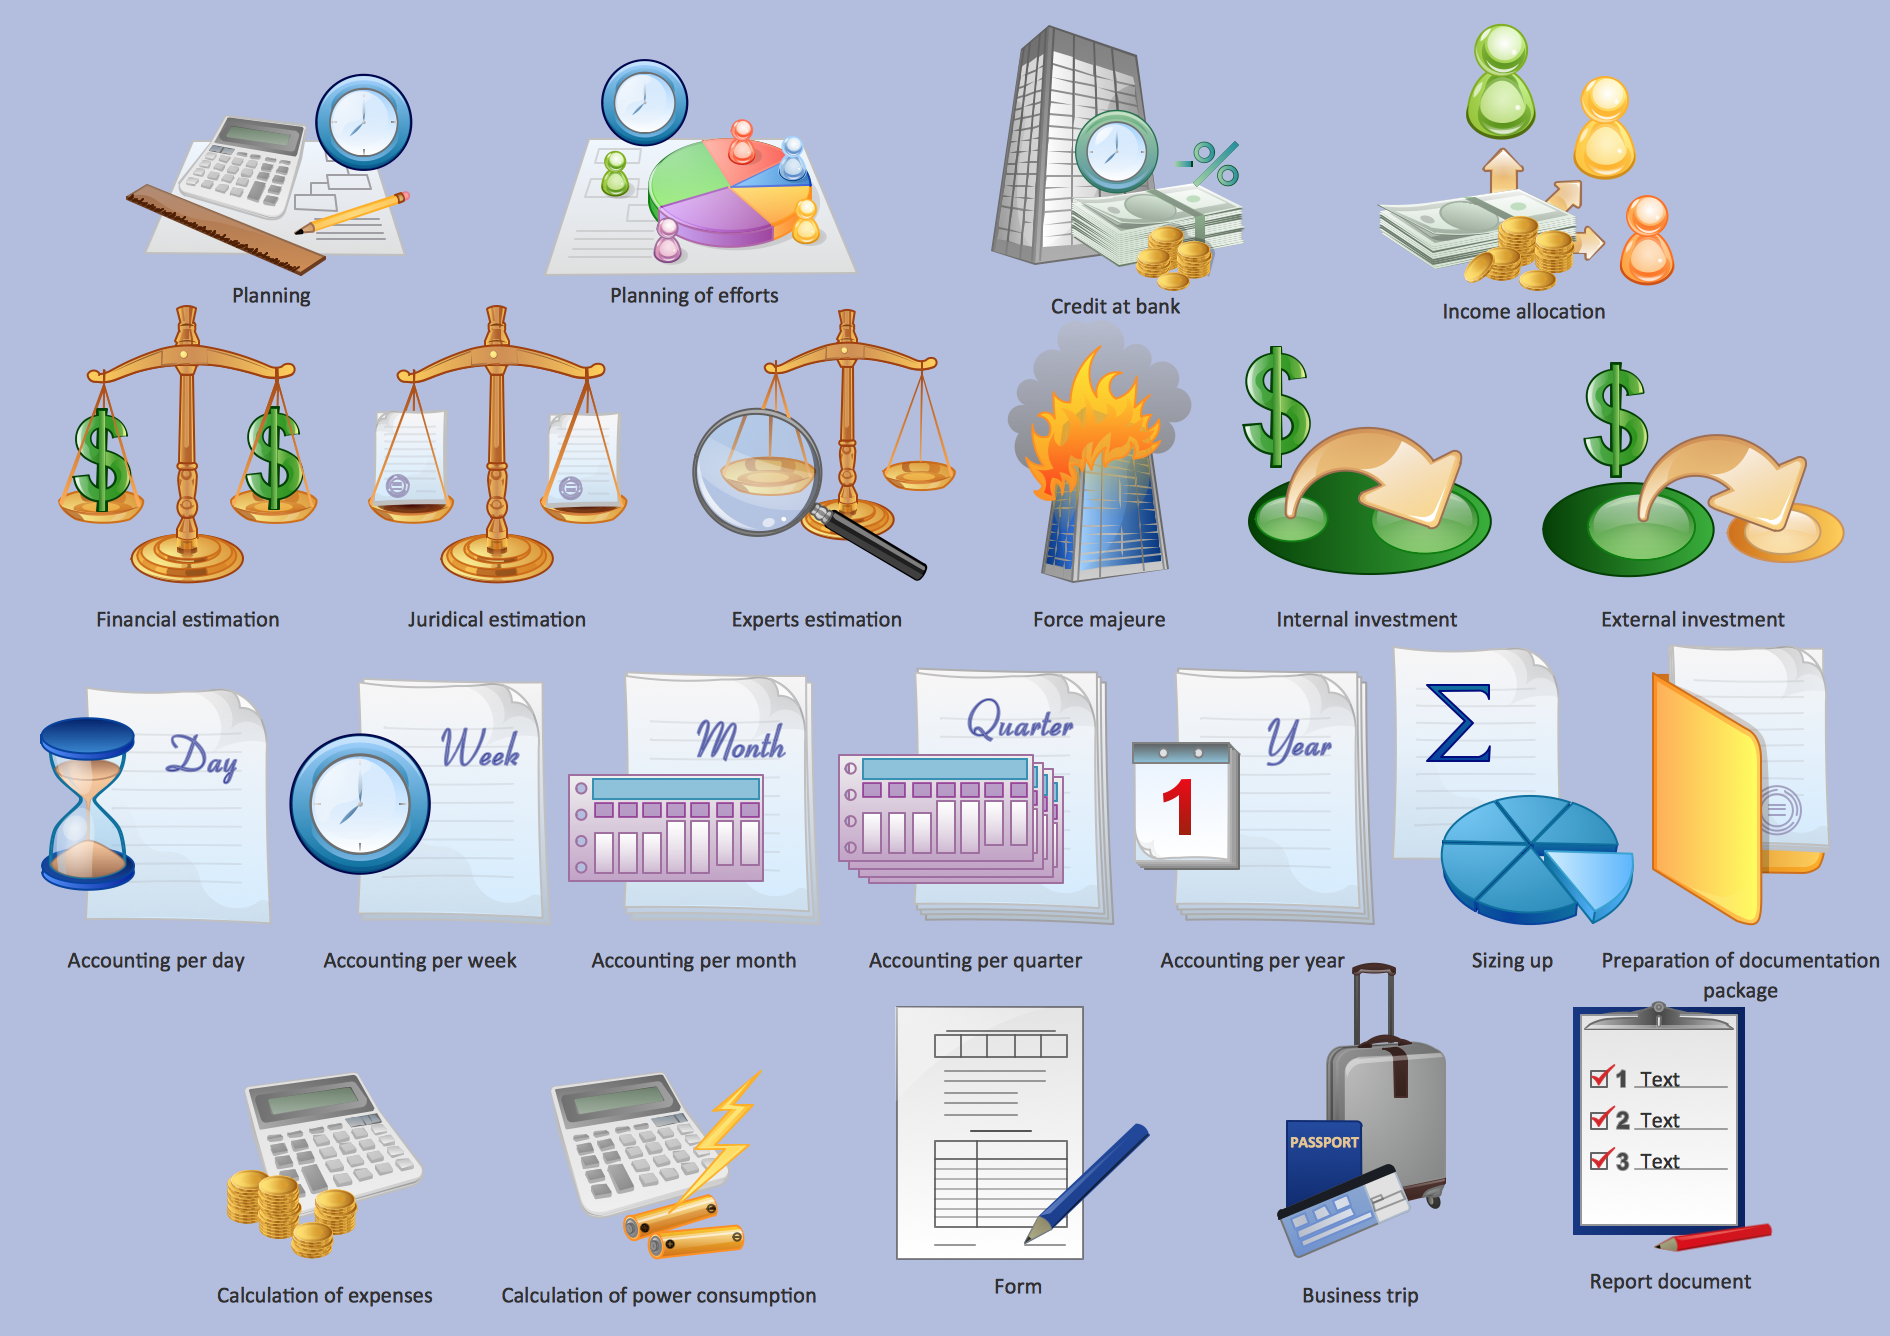
Picture: Management - Design Elements
Related Solution:
Create a Pie Chart with ConceptDraw software quickly and easily. The simple tutorial helps you learn how to create a pie chart.
Picture: How to Create a Pie Chart
Related Solution:
Drawing the diagrams we try to find in help the powerful software and now we have the ConceptDraw DIAGRAM. The ability easily create the SDL diagrams is made possible thanks to unique Specification and Description Language (SDL) Solution from the Industrial Engineering Area of ConceptDraw Solution Park. This solution extends ConceptDraw DIAGRAM 2 libraries - SDL Connectors and SDL Diagrams that contain 70 predesigned SDL flowchart symbols.
Picture: SDL Flowchart Symbols
Related Solution:
ConceptDraw DIAGRAM is a powerful intelligent vector graphics engine that can be used to create basic diagrams including flowcharts, charts, workflows, flowcharts, organizational charts, business diagram, learn business diagrams, flow diagrams.
Picture: The Best Mac Software for Diagramming or Drawing
Related Solution:
Program Structure Diagram is a visual representation of a program's organization, showing its components and their relationships.
Picture: Program Structure Diagram
ConceptDraw DIAGRAM diagramming and vector drawing software extended with Directional Maps Solution from the Maps Area of ConceptDraw Solution Park is a powerful maps and directions design software. Let's review the tools of this solution.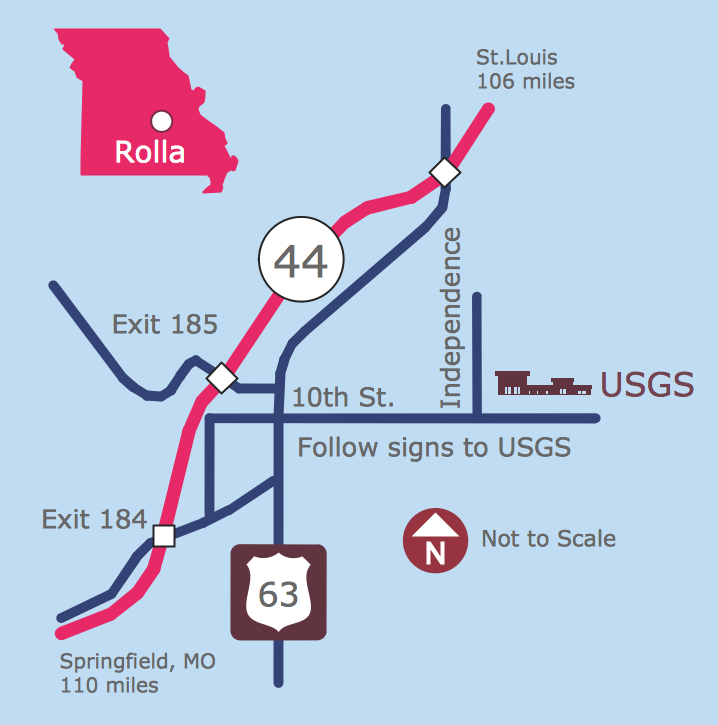
Picture: Maps and Directions
Related Solution:
Four lessons explaining how to manage your task list in a Gantt chart. You will learn how to adjust your Gantt chart view, how to add/delete tasks or subtasks, how to change tasks hierarchy, how to show/hide subtasks.
Picture: Managing the task list
Data processing can be very complex sometimes. If you are interested in facilitating your work with data, it’s time to learn how to draw flowcharts with special software or using just a piece of paper. The list of flowchart basic symbols includes rectangles, diamond, ellipses etc. and is used to represent processes, actions, decisions or data processing.
A well-done flowchart bring the clearness of the sequence of a process stages. There are number of symbols that can be used in flow charts to show various sorts of steps. The basic flowchart can be created using a few of them: Process, Decision, Start/Finish. A basic element of a flowchart represents a simple action and looks like a box, that contains a description of the action. The depicting of actions sequence is made with arrows between corresponding action boxes, as you can see on the sample diagram. Also it shows the symbols for flowchart start and finish steps. ConceptDraw Flowcharts solution provides the ability to build basic flow charts as well as the ones of any size and complexity with a minimum of actions.
Picture: How to Draw a Flowchart: Step-by-Step Guide
Related Solution:
ConceptDraw
DIAGRAM 18