
Example 1. Circle Diagrams - Diagram Leadership and Data
Business Diagrams Solution was specially designed to give you the opportunity to create professional-looking Circle Diagrams in minutes. Simply create new document and drag the desired object from the Circle-Spoke Diagrams library, type the text to the circles, and your successful and attractive diagram will be ready.

Example 2. Circle-Spoke Diagrams Library Design Elements
Pay attention to the colors, they have a great importance and help you to make your Circle-Spoke and Circle Diagrams more interesting, more successful, more attractive to the audience at the presentations, conferences, in publications. You can set the accents according to your taste, for example you can highlight the main item.

Example 3. Circle Diagrams - Social Determinants of Health
The samples you see on this page were created in ConceptDraw DIAGRAM using the Business Diagrams Solution for ConceptDraw DIAGRAM. These Circle Diagrams successfully demonstrate solution's capabilities and professional results you can achieve. An experienced user spent 5 minutes creating every of these samples.
Use the Business Diagrams Solution for ConceptDraw DIAGRAM software to create your own professional-looking Circle Diagrams of any complexity quick, easy and effective, and then successfully use them in your work or education activity.
All source documents are vector graphic documents. They are available for reviewing, modifying, or converting to a variety of formats (PDF file, MS PowerPoint, MS Visio, and many other graphic formats) from the ConceptDraw STORE. The Business Diagrams Solution is available for all ConceptDraw DIAGRAM or later users.
TEN RELATED HOW TO's:
Use Case Diagrams technology. IDEF3 Standard is intended for description and further analysis of technological processes of an enterprise. Using IDEF3 standard it is possible to examine and model scenarios of technological processes.
Picture: IDEF3 Standard
Any information system receives data flows from external sources. In order to visualize them there is a list of data flow diagram symbols that describes how the system components cooperate. If you want to create a data flow diagram, ConceptDraw DIAGRAM Solution Park has DFD Library that contains both Yourdon and Gane-Sarson notations.
This figure shows the content of vector libraries, delivered with ConceptDraw solution for data flow diagram (DFD). There are three libraries composed from about 50 vector objects used to make data flow diagrams.
They include a complete set of objects utilized by Yourdon-Coad and Gane-Sarson notations - two primary notations that are apply for data flow diagramming. Also, one can discover additional "Data flow diagram (DFD)" library that provides a data flow diagram elements for designing level 1 and context-level data flow diagrams.
Picture: Data Flow Diagram Symbols. DFD Library
Related Solution:
Bubble diagrams solution extends ConceptDraw DIAGRAM software with templates, Using ConceptDraw Connectors, you can make a bubble chart in moments. Using ConceptDraw you will be able to make a bubble chart from the ready ConceptDraw library objects or make your own objects. The created diagram can represent ideas organization, in brainstorming processes, by teachers for explaining difficult ideas or for presentations.
Picture: How To Make a Bubble Chart
Related Solution:
ConceptDraw DIAGRAM extended with Seven Management and Planning Tools Solution from the Management Area of ConceptDraw Solution Park is the best software for drawing all types of diagrams from the Seven Management and Planning Tools: Affinity Diagram, Relations Diagram, Prioritization Matrix, Root Cause Analysis Tree Diagram, Involvement Matrix, PERT Chart, and Risk Diagram (PDPC).
Picture: PDPC
Related Solution:
When thinking about data visualization, one of the first tools that comes to mind is a flowchart design. You can find flowchart symbols, shapes, stencils and icons easily on the Internet, but it might take time to systematize this information. Nevertheless, once you start flowcharting, you’ll love its simplicity and efficiency.
This diagram consists from standard flowchart symbols, approved by ANSI (American National Standard Institute) for drawing flowcharts. A flowchart is a diagram that represents a step-by-step algorithm of any process, displaying the process stages as boxes that are connected with arrows. Flowchart design makes it clear and readable.
Flowchart designed using ConceptDraw DIAGRAM flowchart software allows to make attractive and clear process presentation, it makes interpretation of the business process flow fresh and versatile. Great flowchart design view is a big advantage over the diagram created manually on a paper.
Picture: Flowchart Design: Principles, Layout, Symbols and Best Practices
Related Solution:
Computer networks nowadays are spread all across the world. The large number of parameters, such as geographic scale or communication protocols, can divide networks. One of the most common types of networks is called local area network (LAN). It convenient to represent network examples by means of diagrams.
This local area network (LAN) diagram provides an easy way to see the way the devices in a local network are interacted. The diagram uses a library containing specific symbols to represent network equipment , media and the end-user devices such as computers (PC, mac, laptop) , network printer, hubs, server and finally a modem. There are two types of network topologies: physical and logical. The current diagram represents precisely a physical type of LAN topology because it refers to the physical layout of a local network equipment.
Picture:
What is a Local Area Network?
Examples of LAN Diagrams
Related Solution:
Learn the most common process flowchart symbols used in business process diagrams and workflow charts. Includes symbol meanings, examples, and a practical reference table.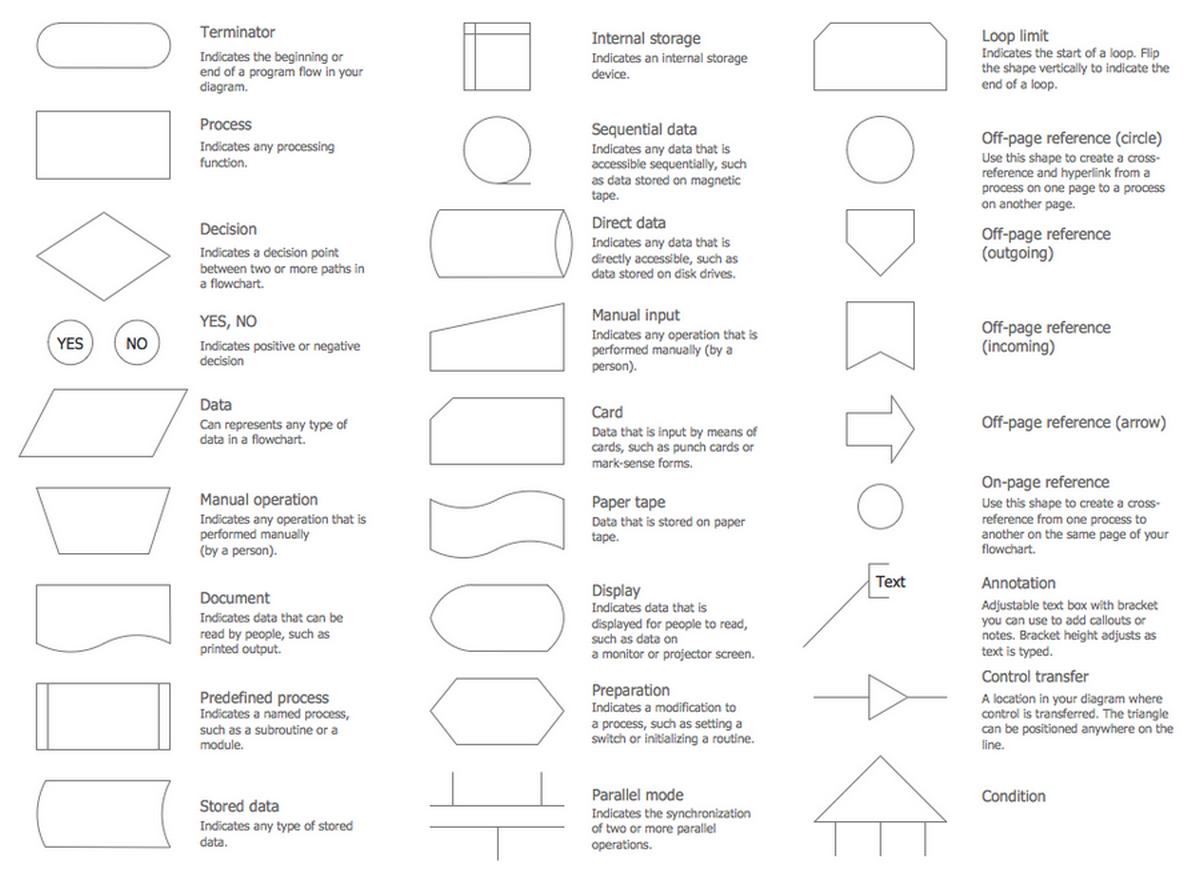
Picture: Process Flowchart Symbols: Meaning, Types and Examples
Related Solution:
This sample shows the Pie Donut Chart. It was created in ConceptDraw DIAGRAM diagramming and vector drawing software using the ready-to-use object from the Pie Charts Solution from Graphs and Charts area of ConceptDraw Solution Park.
The Pie Donut Chart visualizes the percentage of parts of the whole and looks like as a ring divided into sectors. Pie Donut Charts are widely used in the business, statistics, analytics, mass media.
Picture: Pie Donut Chart. Pie Chart Examples
Related Solution:
Create flowcharts, org charts, floor plans, business diagrams and more with ConceptDraw DIAGRAM.
Picture: Simple Diagramming
Related Solution:
Easy charting software comes with beautiful chart templates and examples. This makes it easy to create professional charts without prior experience.
Picture: Chart Examples
Related Solutions:

