eLearning for Leadership
Remote Learning
Students, consultants and experts can use the power of ConceptDraw MINDMAP together with Skype now.
eLearning for Skype solution is a modern eLearning method allows users to simplify training process for small groups via a Skype conference call and change perceptions of leadership and learning.
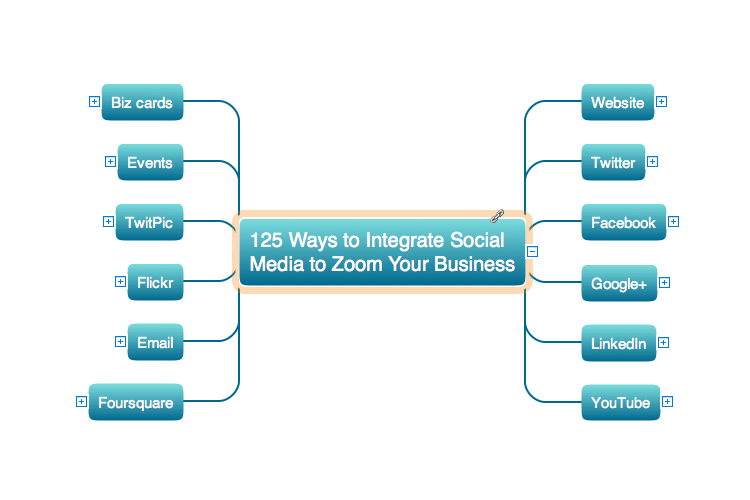
Sample 1. eLearning for Skype — 125 Ways to Integrate
Social Media to Increase Your Business
See also Samples:
-
Mind Maps
-
Mind Map Exchange
-
Marketing — Mind Maps
-
Mind Maps — Idea Communication
-
Mind Maps — Presentation Exchange
TEN RELATED HOW TO's:
Data Flow Diagram is used to depict the flow of data through the system, where it enters and exits the system, as well as where it is stored. To simplify the process of drawing a data flow diagram (DFD), ConceptDraw DIAGRAM provides a DFD Library - design elements that will help you make your diagram as informative, streamlined and understandable as possible. Data flow diagrams are useful to create a general overview of the system or to document major data flows.
Here are the library of symbols used in data flow diagrams (DFD). Data Flow diagrams are graphic means of business process visualization. Any business process may involve the data transfer. It can be easily shown using data flow diagrams. DFDs are used to represent the processing and transformation of data within a business process. One can find out the Vector library of DFD symbols, that is a component of ConceptDraw solution for Data Flow Diagramming and is welcome to use in as addition to the common Conceptdraw DIAGRAM diagramming facilities.
Picture: DFD Library — Design elements
Related Solution:
Users can start draw their own flowchart diagrams from existing examples.
Picture: Examples of Flowchart Diagram
Related Solution:
It is easy to recreate any informational system structure using diagrams. There are three main components of any ER diagram: entity, attribute and relationship. Basing on these three components, one can define other, less used elements, such as weak entity or relationship, derived attribute, recursive relationship etc.
This is the set of graphic elements of ERD Chen's notation. This ERD notation is used to represent an entity–relationship models. It involves the set of geometric forms: rectangles - depicting entities, ovals - representing attributes and diamonds depicting relationships assigned for first-class objects, that can have relationships and attributes of their own. Connections are displayed with arrowed lines. It is known that the Chen's ERD notation is used to show a detailed view of entities and relationships. ConceptDraw Entity-Relationship Diagram solution from the Software Development section of Solution Park provides the ability to create ERD of database structure for software development purposes using the Chen’s notation elements.
Picture: Components of ER Diagram
Related Solution:
How to use Skype in the Classroom: Tips for effective teaching online for organizations of all sizes. Software for online training and virtual classroom that provides an interactive learning environment.
Picture: eLerning for Skype
Related Solution:
Use Case Diagrams describes the functionality provided by a system in terms of actors, their goals represented as use cases, and any dependencies among those use cases.
Picture: Diagramming Software for Design UML Use Case Diagrams
This sample was created in ConceptDraw DIAGRAM diagramming and vector drawing software using the Bar Graphs Solution from Graphs and Charts area of ConceptDraw Solution Park. It is Bar Graphs example, Sales Growth example, Column Chart Example - Sales Report.
Picture: Sales Growth. Bar Graphs Example
Related Solution:
Unified Modeling Language (UML) is a graphical modeling language for describing, visualizing, projecting and documenting of object oriented systems. UML digram is used for modeling of organizations and their business processes, for development the big projects, the complex software applications. Comprehensive UML diagram allows to create the set of interrelated documents that gives the complete visual representation of the modeling system.
Picture: UML Sample Project
Related Solution:
The Social Media Response solution creates interactive social media flow charts and action mind maps. The solution includes a video tutorial and a number of samples helping social media teams refine and organize their response process.
Picture: How to Connect Social Media DFD Flowchart with Action Maps
Related Solution:
ConceptDraw DIAGRAM has extensive export capabilities which allow you to export your drawing to MS PowerPoint file formats. So, you can create effective presentations right from your ConceptDraw DIAGRAM documents.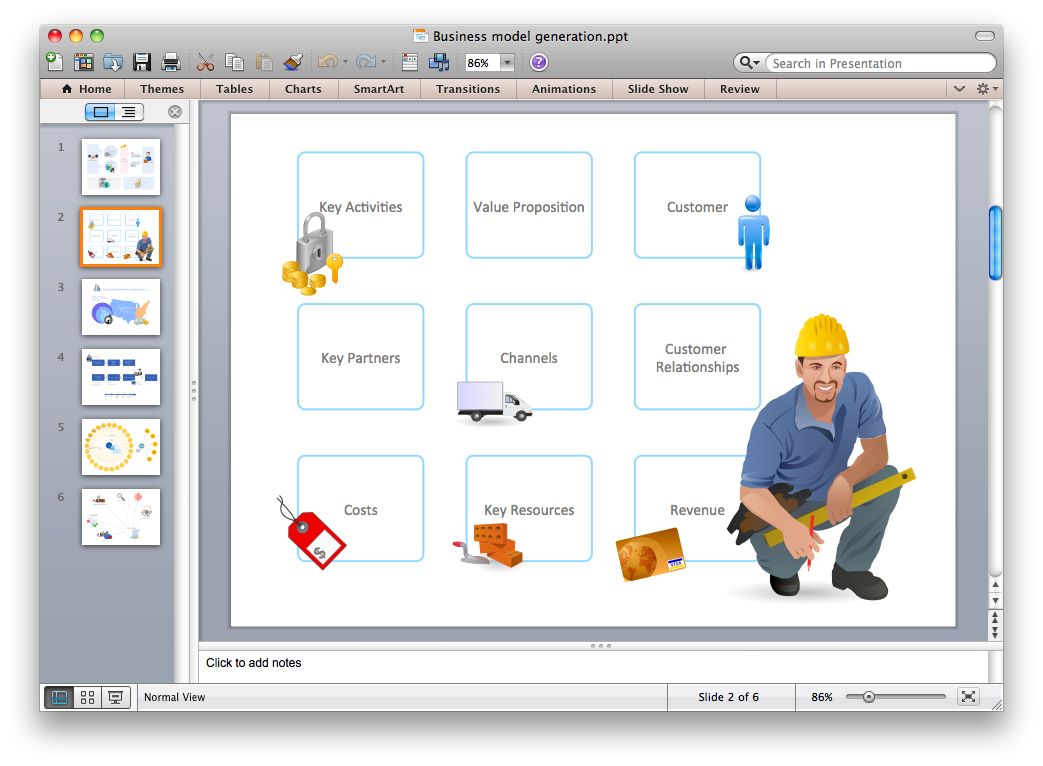
Picture: Export from ConceptDraw DIAGRAM Document to PPT or PPTX (MS PowerPoint®) File
Event-Driven Process Chain Diagrams for improvement throughout an organisation.
ConceptDraw DIAGRAM - business process mapping software that reduces the time needed to create a business process model.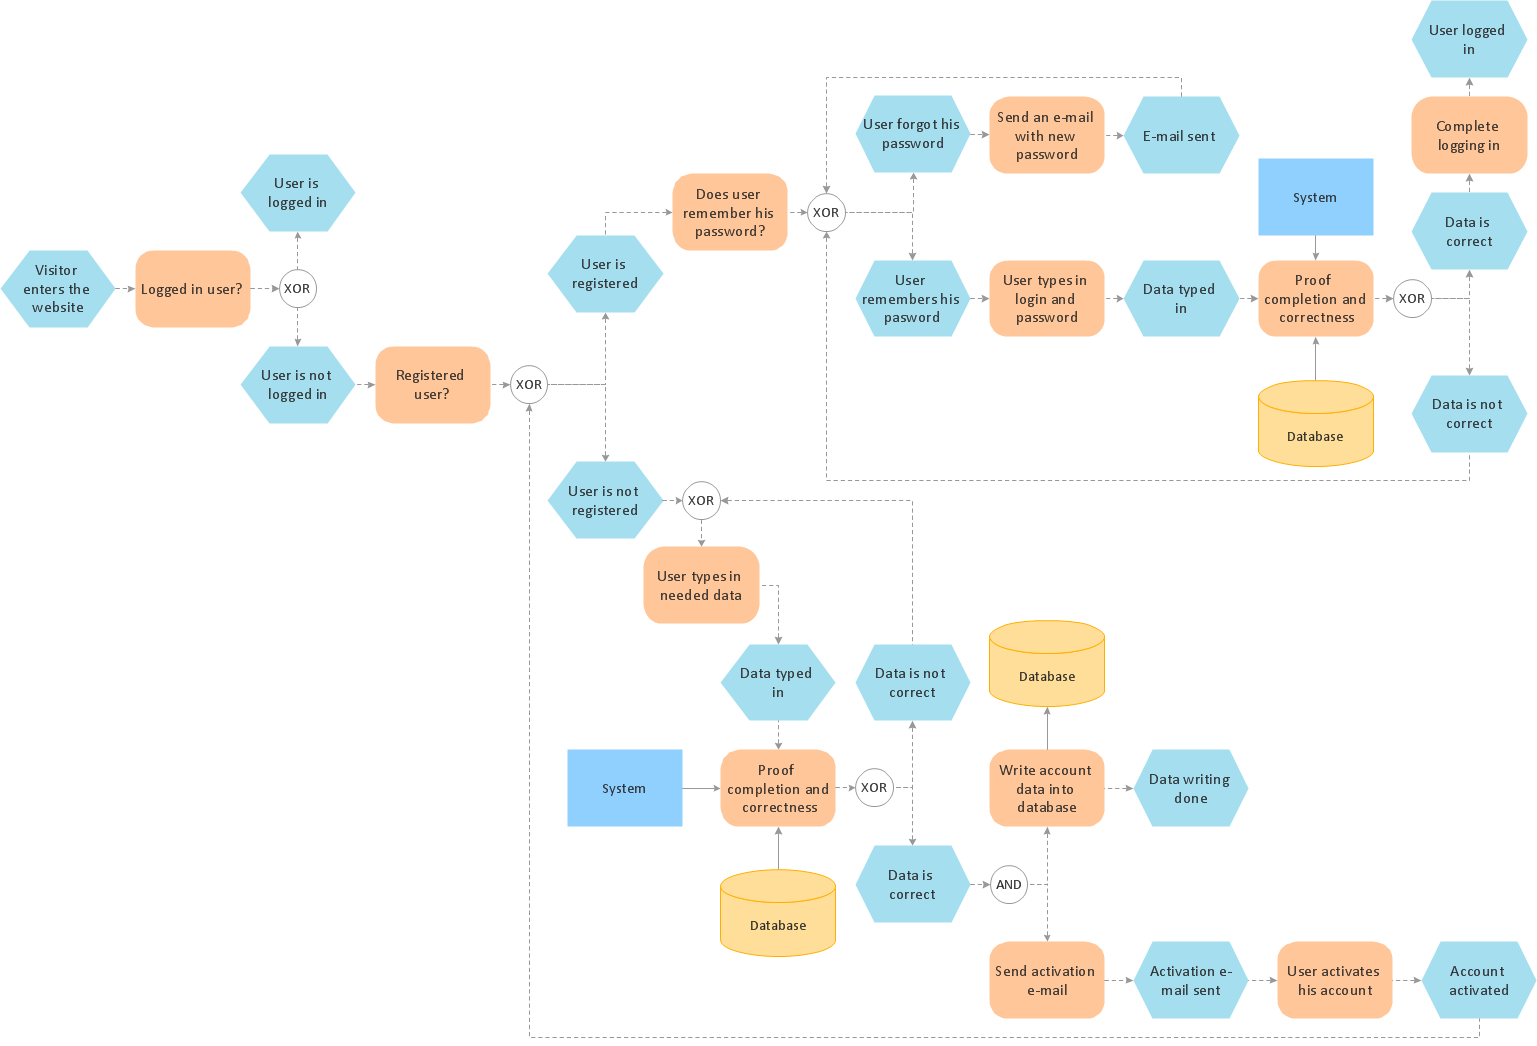
Picture: Process Modelling using Event-driven Process chain
Related Solution:
ConceptDraw
MINDMAP 16