Creating a Simple Flowchart
ConceptDraw DIAGRAM Software
Start creating your own flowcharts with ConceptDraw DIAGRAM and accomplish great results in the moment. This is the best professional flowchart software that gives users the ability to simply draw any type of flowchart.
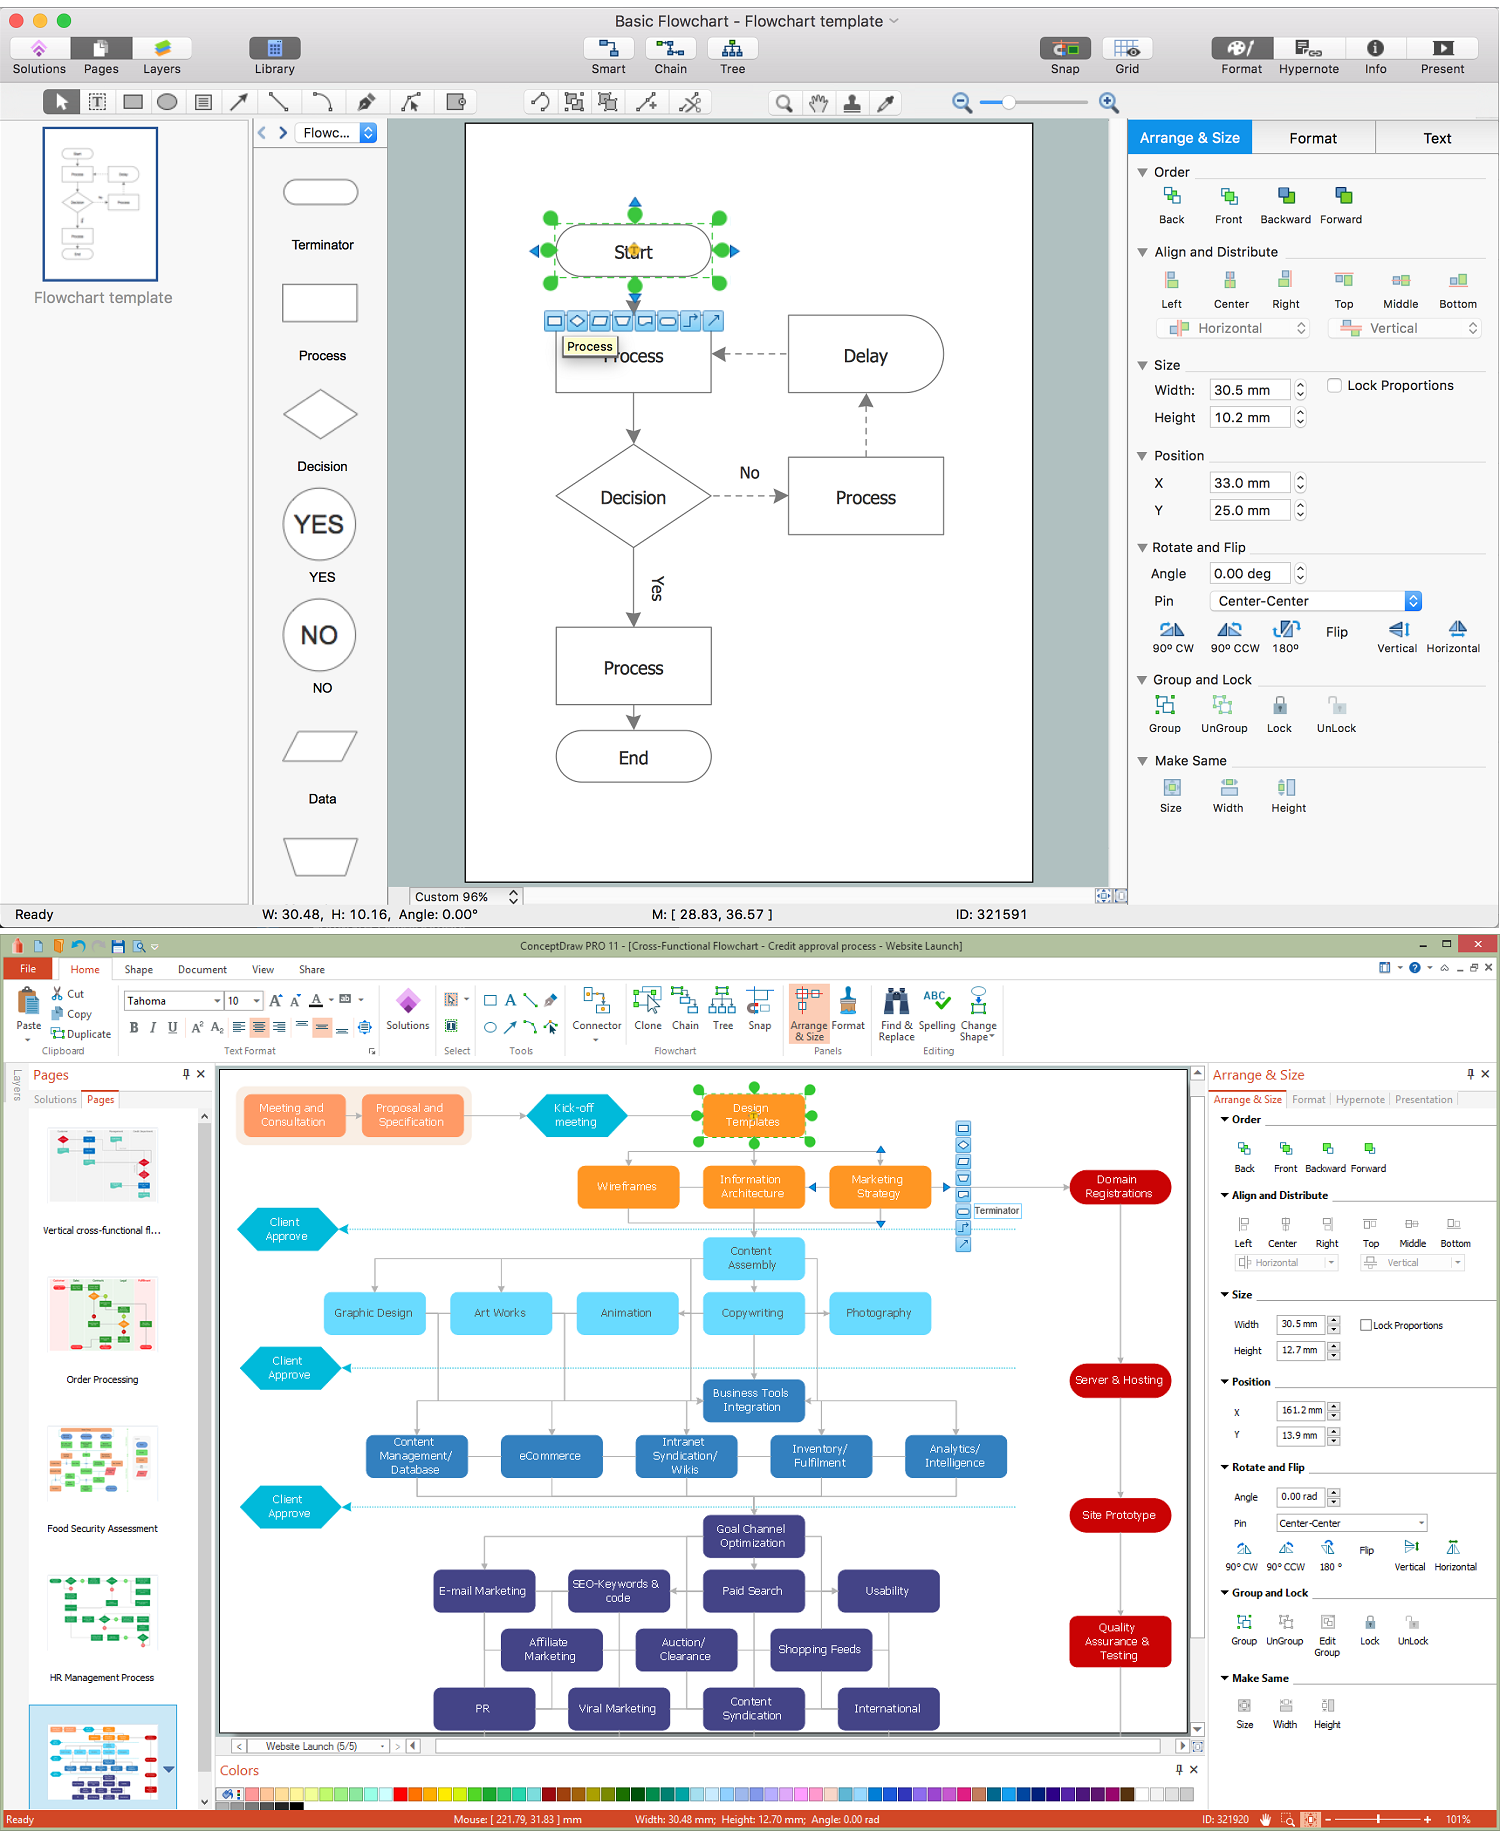
Sample 1. Creating a Simple Flowchart.
The fast creating visualization for structural data with vector stencils from object libraries by using RapidDraw technology makes ConceptDraw DIAGRAM first in drawing flow data.

Sample 2. Flow chart: Selection sorting method.
This example of computer algorithm flowchart visualizes the steps and logic of selection sorting method.
TEN RELATED HOW TO's:
It is very difficult to get into database model idea without any examples. To create one, you can use Chen’s notation for Entity Relationship Diagrams (ERD) and try to see all the peculiarities yourself. This notation describes entities and relations as basic geometric shapes like rectangles and diamonds.
Chen notation for Entity-relationship diagrams is used for designing relational databases. It depicts the database entities as a set of subjects. For example events, people, ideas, etc. All entities has common characteristics (attributes). Any object of the system is identified as the sole and unique. The name of entity should indicate the class or type of the the whole object, not a given example. The connection commonly represents a relationship between entities. Conceptdraw Entity-Relationship Diagrams (ERD) solution provides the libraries with ready-to-use ERD element fitting Chen's notation objects and relationships.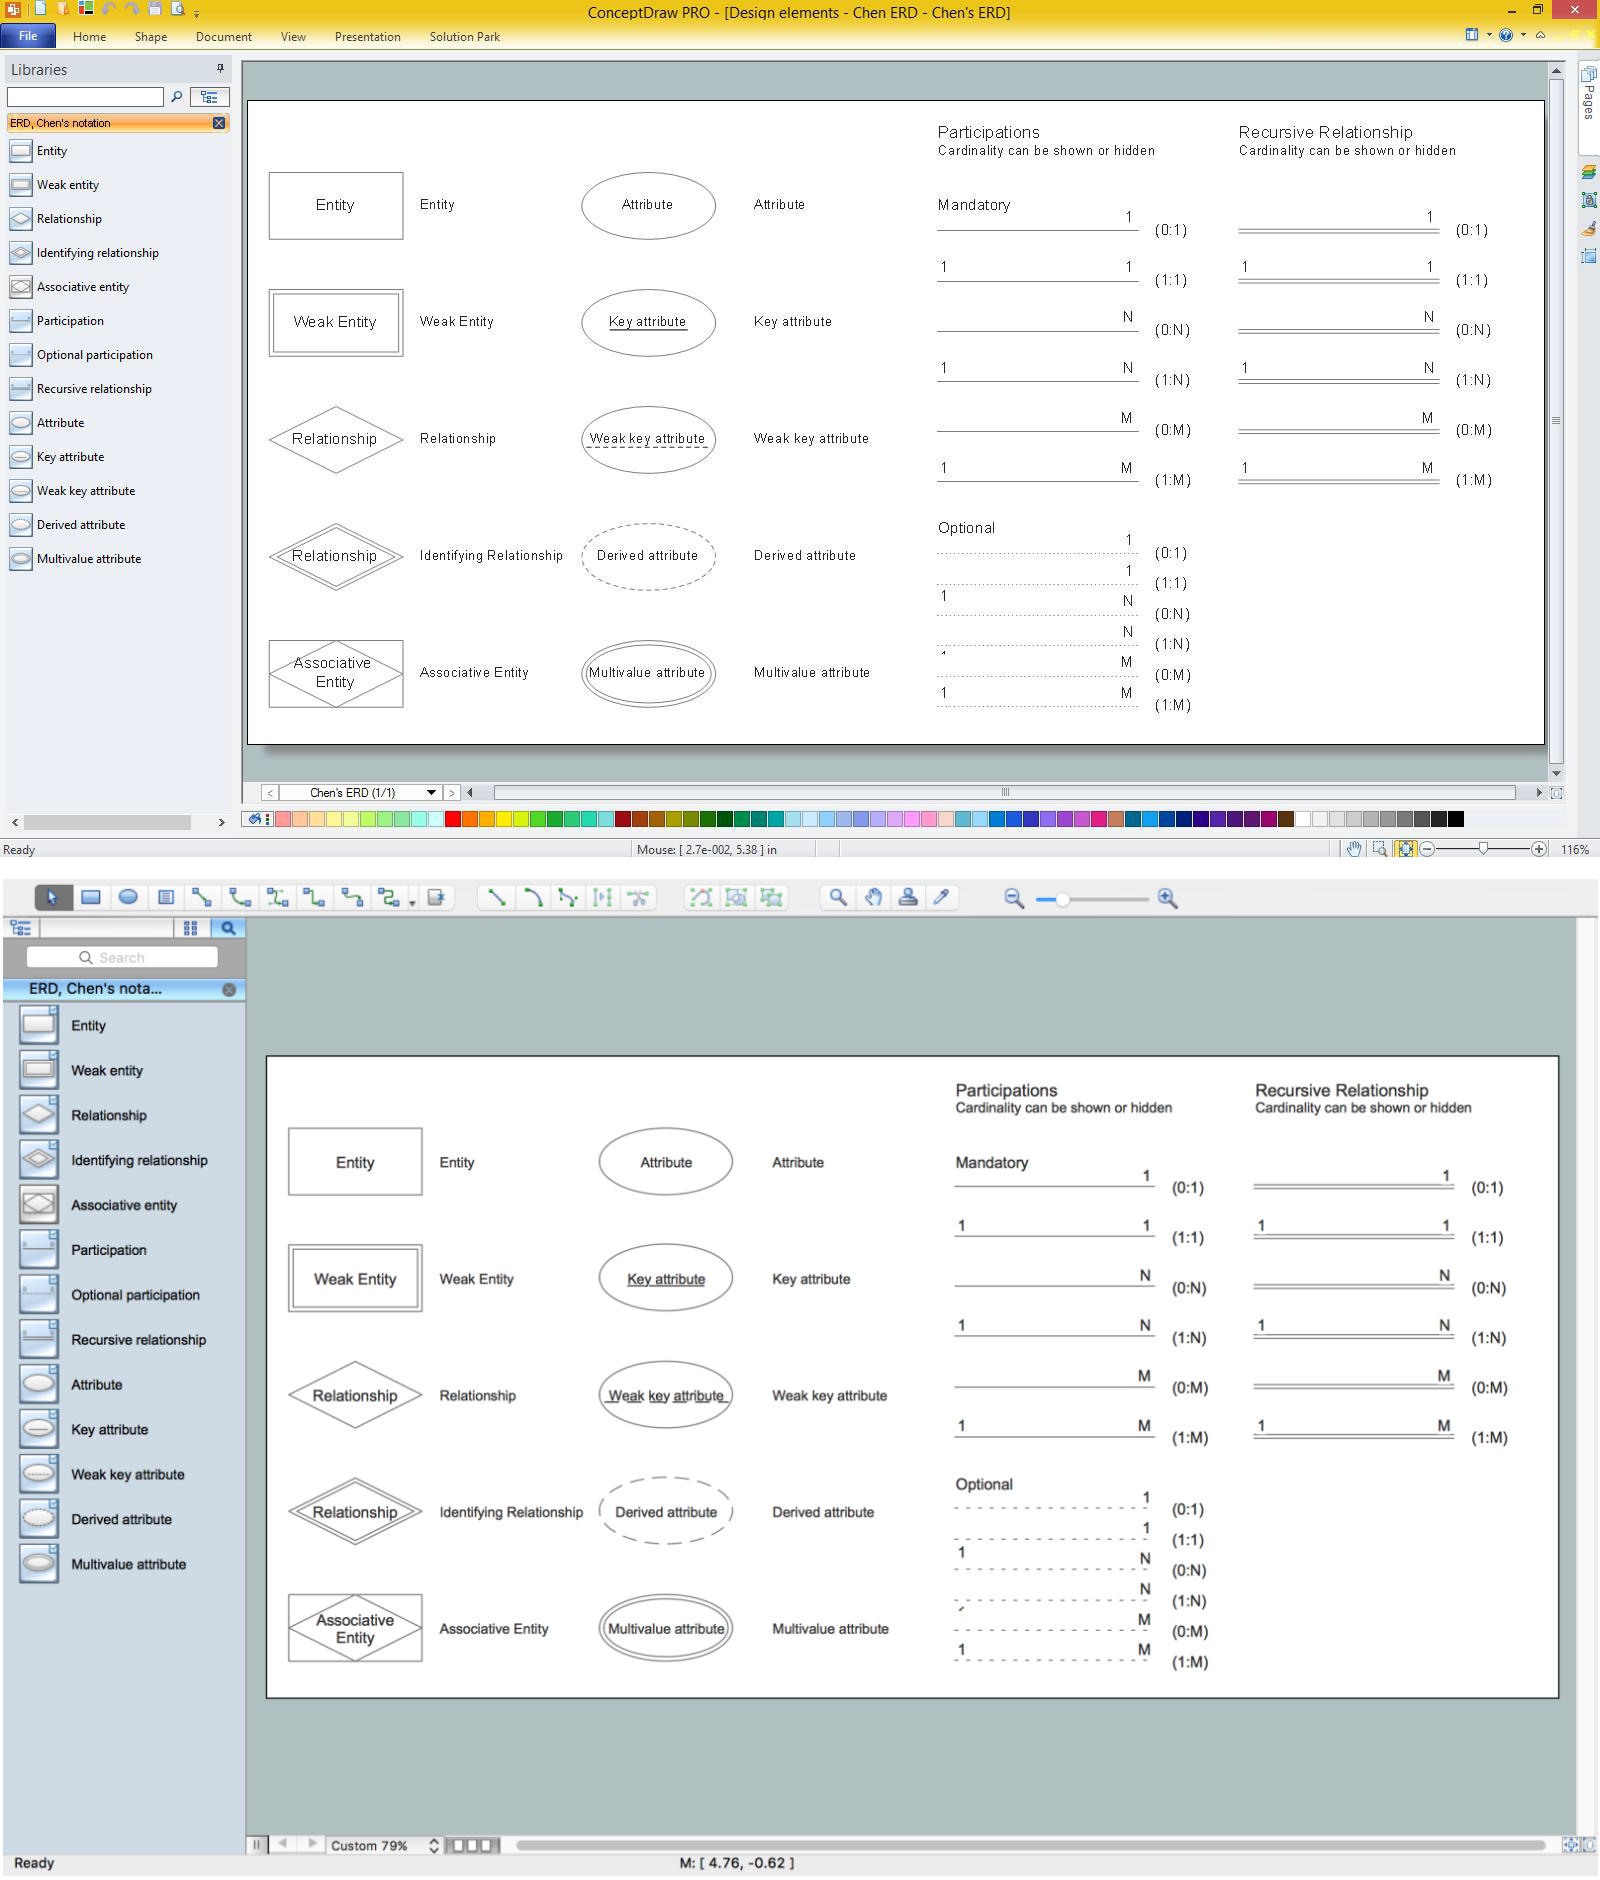
Picture: Design Element: Chen for Entity Relationship Diagram - ERD
Related Solution:
Create flowcharts, org charts, floor plans, business diagrams and more with ConceptDraw DIAGRAM.
Picture: Simple Diagramming
Related Solution:
Process Flow Charts are very popular and widely used in chemical and process engineering for representation a general flow of plant processes and equipment. If you need often draw them, the ConceptDraw DIAGRAM diagramming and vector drawing software extended with tools of Flowcharts Solution will be useful for you.
The mostly used set of process flow chart symbols includes the following: Rectangle (box) process flow chart symbol, Rounded rectangle, Circle, Diamond.
Picture: Process Flow Chart Symbol
Related Solution:
ConceptDraw DIAGRAM is a powerful software for creating professional looking Flowcharts quick and easy.
Picture:
Flowchart
What is FlowchartRelated Solution:
Templates are very useful and convenient tool for fast and easy drawing various diagrams, charts, and also flowcharts.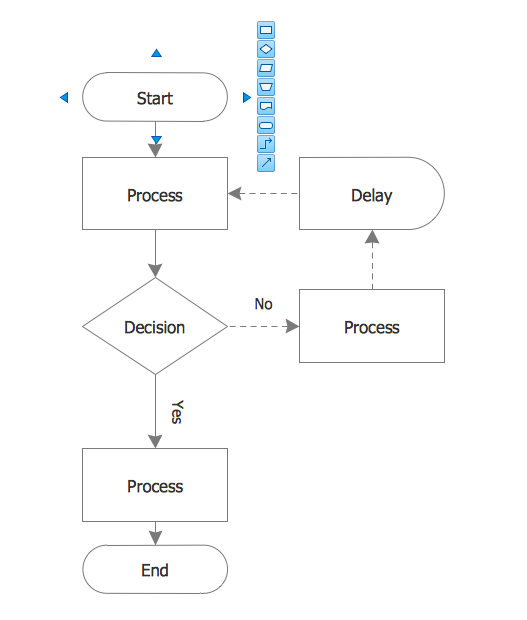
Picture: Flow Chart Template
Related Solution:
How to draw pictorial chart quick, easy and effective? ConceptDraw DIAGRAM offers the unique Pictorial Infographics Solution that will help you!
Pictorial Infographics solution contains large number of libraries with variety of predesigned vector pictograms that allows you design infographics in minutes. There are available 10 libraries with 197 vector pictograms.
Picture: How to Draw Pictorial Chart. How to Use Infograms
Related Solution:
The purchase or purchasing funnel is a consumer focused marketing model which illustrates the theoretical customer journey towards the purchase of a product or service.
Picture: Pyramid Diagram
Related Solution:
ConceptDraw the best business process modeling tool to make flow chart diagrams.
Start creating your own flowchart with ConceptDraw DIAGRAM and accomplish great results in the moment. This is the best program to make flow chart diagrams that gives users the ability to simply draw any type of flowchart. The fast creating visualization for the structural data with the vector stencils from object libraries by using RapidDraw technology makes ConceptDraw DIAGRAM the first program in drawing flow data.
Picture: Best Program to Make Flow Chart Diagrams
Related Solution:
Create bar charts for business management problem solving and data comparison using the ConceptDraw DIAGRAM diagramming and vector drawing software extended with the Bar Graphs Solution from the Graphs and Charts area of ConceptDraw Solition Park.
Picture: Bar Diagrams for Problem Solving.Create business management bar charts with Bar Graphs Solution
Related Solution:
Planning a computer network can be a challenge for a junior specialist. However, knowing how to draw a computer network diagrams isn’t a rocket science anymore. There are a lot of special software for creating such diagrams with predesigned templates and examples.
The core for Network Fault Tolerance System presented here, is the equipment of Cisco. You can see here the certified Cisco equipment icons. Generally, ConceptDraw DIAGRAM libraries contain more than half of a thousand objects representing the standardized images of Cisco equipment. ConceptDraw solution for network diagramming is a great network diagramming tool for any level skills - from students to network guru.
Picture: How to Draw a Computer Network Diagrams
Related Solution:
ConceptDraw
DIAGRAM 18