Taxi Service Data Flow Diagram
DFD Example
This sample was created in ConceptDraw DIAGRAM diagramming and vector drawing software using the Data Flow Diagrams Solution from the Software Development area of ConceptDraw Solution Park.
This sample shows the Data Flow Model Diagram of the Taxi Service and interactions between the Clients, Operators and Divers, as well as Orders and Reports databases.

Pic 1. Taxi Service Data Flow Diagram
Using the vector stencils libraries of the Data Flow Diagrams Solution for ConceptDraw DIAGRAM you can create your own professional Data Flow Diagrams (DFD) quick and easy.
TEN RELATED HOW TO's:
Computer networks nowadays are spread all across the world. The large number of parameters, such as geographic scale or communication protocols, can divide networks. One of the most common types of networks is called local area network (LAN). It convenient to represent network examples by means of diagrams.
This local area network (LAN) diagram provides an easy way to see the way the devices in a local network are interacted. The diagram uses a library containing specific symbols to represent network equipment , media and the end-user devices such as computers (PC, mac, laptop) , network printer, hubs, server and finally a modem. There are two types of network topologies: physical and logical. The current diagram represents precisely a physical type of LAN topology because it refers to the physical layout of a local network equipment.
Picture:
What is a Local Area Network?
Examples of LAN Diagrams
Related Solution:
Use ConceptDraw DIAGRAM enhanced with solutions from ConceptDraw Solution Park to create diagrams to present and explain structures, process flows, logical relationships and networks.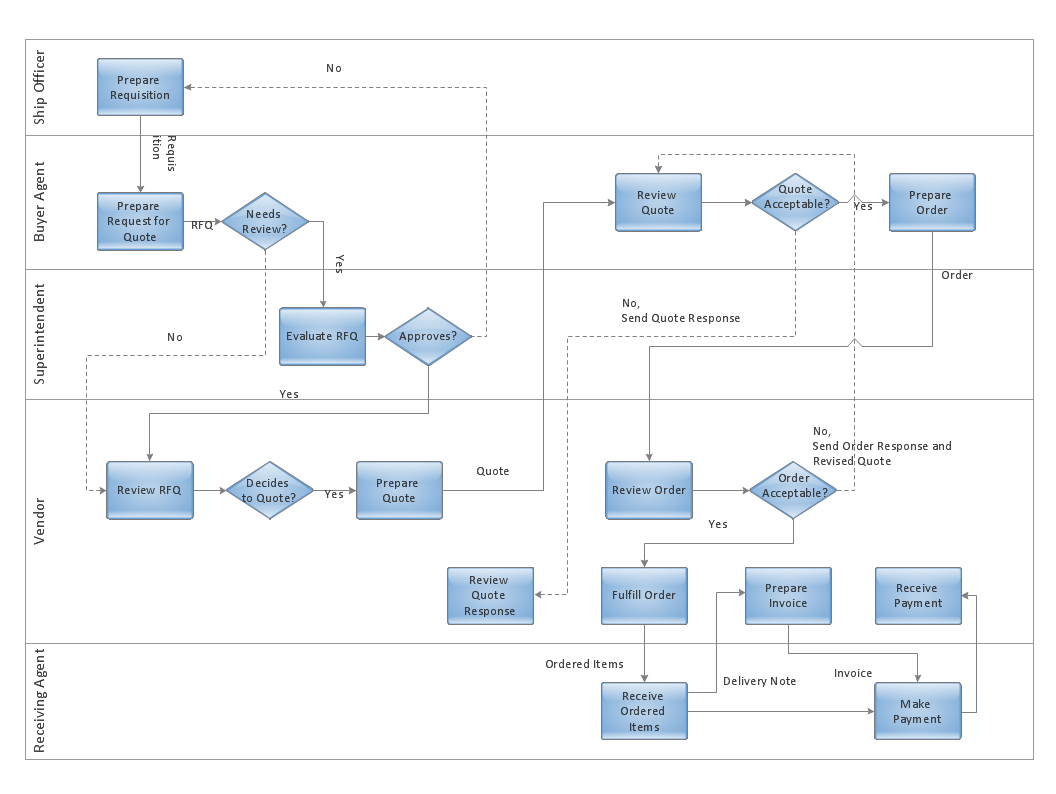
Picture: Cross-Functional Flowcharts in ConceptDraw
ConceptDraw DIAGRAM is a powerful diagramming and vector drawing software. Extended with AWS Architecture Diagrams Solution from the Computer and Networks Area, ConceptDraw DIAGRAM now is ideal software for Amazon Web Services diagrams drawing.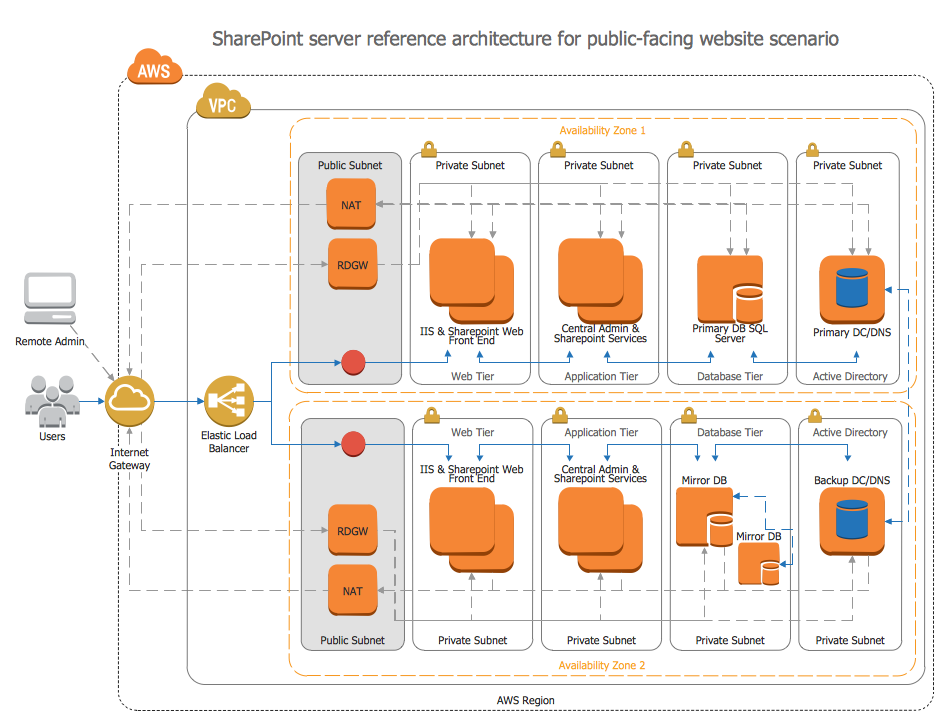
Picture: Amazon Web Services
Related Solution:
Create professional business process diagrams using ConceptDraw Events library with 17 objects from BPMN.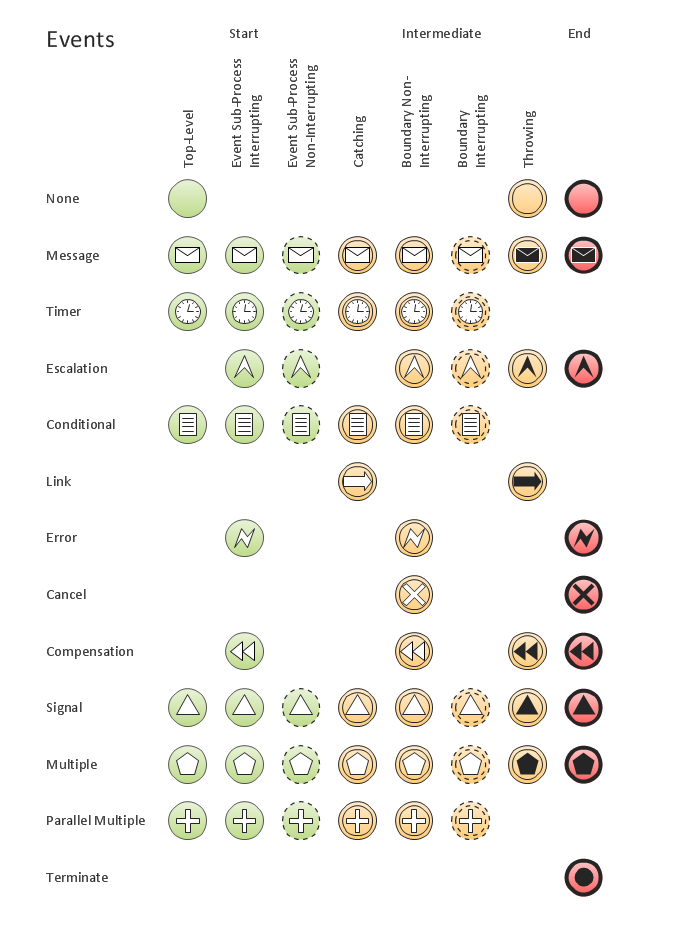
Picture: Business Process Elements: Events
The vector stencils library Aircraft contains clipart of aerospace objects, transportation vehicles, office buildings, and ancillary facilities for ConceptDraw DIAGRAM diagramming and vector drawing software.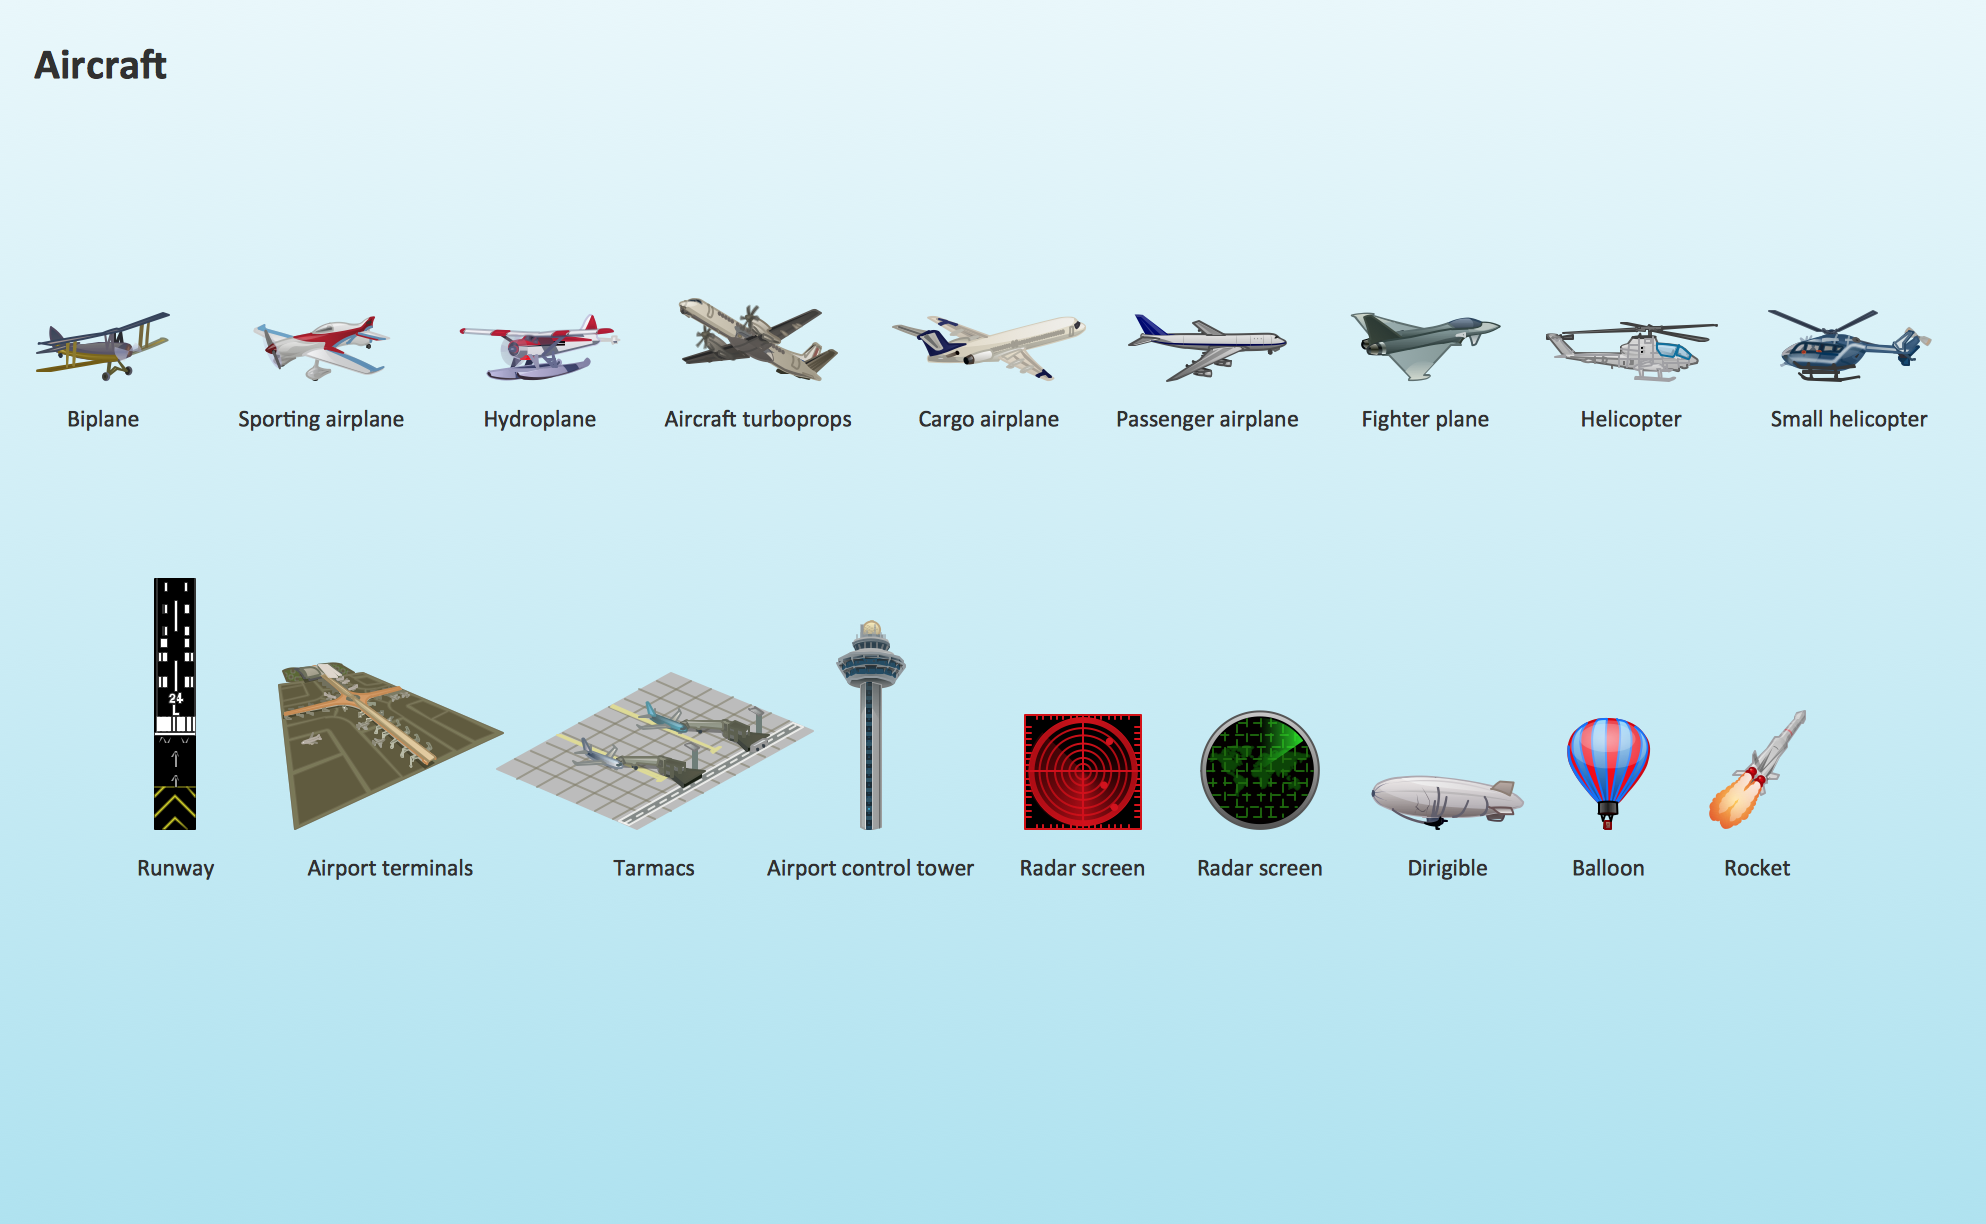
Picture: Aircraft - Design Elements
Related Solution:
ConceptDraw DIAGRAM diagramming and vector drawing software offers the Timeline Diagrams solution from the Management area which is rich for the timeline examples, samples, templates and ready-to-use vector shapes.
Picture: Timeline Examples
Related Solution:
The vector stencils library Australia contains contours of New Zealand and Australian states and mainland territories for ConceptDraw DIAGRAM diagramming and vector drawing software.
Picture: Geo Map — Australia — New Zealand
Related Solution:
Visual information is easier to perceive. You can teach even a child to make diagrams with a good flowchart example that would be interesting for it. Flowcharts can be fun, it’s not about business processes or programming algorithms.
This flowchart shows step by step process of manufacturing of Nixtamal The product which is obtained by processing maize with calcium hydroxide. We must assume that the Aztecs were very fond of this product, if the recipe of its production came to our times. This flow chart was designed using ConceptDraw DIAGRAM with its solution for designing flowcharts of various types, sizes and purposes. ConceptDraw Flowcharts solution consists from the library of flowchart symbols, containing the set vector objects. Also there are a lot of diverse templates and samples of flow charts.
Picture: Flowchart Examples and Templates
Related Solution:
When studying a business process or system involving the transfer of data, it is common to use a Data Flow Diagram (DFD) to visualize how data are processed. Being initially used exclusively in regards to the flow of data through a computer system, now DFDs are employed as the business modeling tools. They are applied to describe the business events and interactions, or physical systems involving data storage and transfer. ConceptDraw DIAGRAM is a powerful Data Flow Diagram software thanks to the Data Flow Diagrams solution from the Software Development area of ConceptDraw Solution Park.
Picture: Data Flow Diagram Software
Related Solution:
ConceptDraw DIAGRAM is workflow diagram software enhanced by numerous extentions from ConceptDraw Solution Park. It inludes many professional workflow diagrams, examples and ready to use workflow diagram and workflow symbols. Workflow symbol collections include symbols for Processes, Planning, Scheduling, Flow Control, In-Transit Process Visibility.
The best workflow diagram software you may find is ConceptDraw DIAGRAM. ConceptDraw DIAGRAM is world-known diagramming software that works for both Windows and Mac OS X platforms. The software contains complete set of features allows to draw diagrams faster. ConceptDraw DIAGRAM extended with the Workflow Diagram solution provides additional libraries, templates and samples for drawing professional workflow diagrams.
Picture: Workflow Diagram Software
Related Solution:
ConceptDraw
DIAGRAM 18