How To Collaborate via Skype
Collaboration via Skype
With ConceptDraw MINDMAP best collaboration software you are able to collaborate with a workgroup online, document your ideas and discussion and then present your results as a mind map. This tool extends Skype conference call possibilities.
ConceptDraw MINDMAP allows to
- share presentation during Skype call
- present meeting notes via Skype
- communicate visually via Skype.
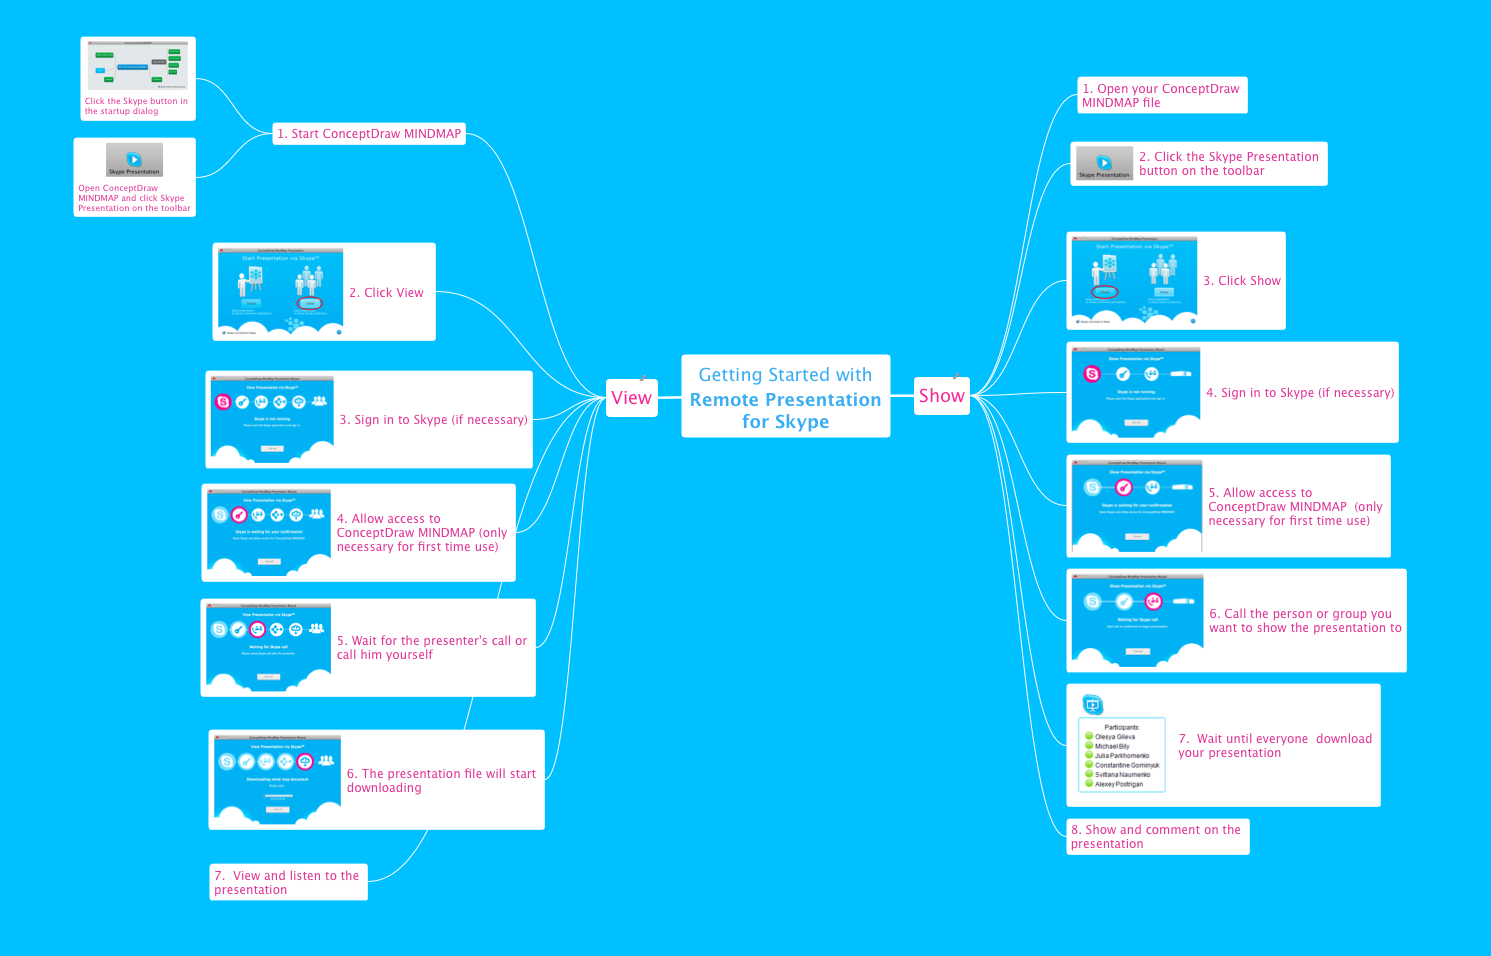
Sample 1. Getting Started
Getting Started with Remote Presentation for Skype mind map sample is created using ConceptDraw MINDMAP mind mapping software. This mind map example helps to make team collaboration via Skype.
Use this mindmap example for implementation of Remote Presentation for Skype solution from ConceptDraw Solution Park.
See also Samples:
TEN RELATED HOW TO's:
If you are an advanced diagramming software user, you might use it daily. Traversing the Internet in searching of alternative to MS Visio for MAC and PC, you can fulfill all your requirements with ConceptDraw DIAGRAM. Don’t hesitate to transfer your documents to another operating system.
When looking for a smart and simple tool for business diagrams as alternative to MS Visio for Apple OS X platform, ConceptDraw DIAGRAM certainly is the best choice. Making many kinds of business charts, numerous technical drawings is what ConcepDraw DIAGRAM is the best. One can easy create any diagram and complete it perfectly and quickly. The big collection of vector object libraries, templates and samples, make it the best Microsoft Visio alternative: ConceptDraw DIAGRAM is simpler to use, less expensive, and supports project management and mind mapping methods.
Picture:
In Searching of Alternative to MS Visio for Mac and PC
with ConceptDraw DIAGRAM
ConceptDraw DIAGRAM diagramming and vector drawing software extended with Rapid UML Solution from the Software Development Area is a powerful online diagram tool that will help you design any types of UML diagrams simply and fast.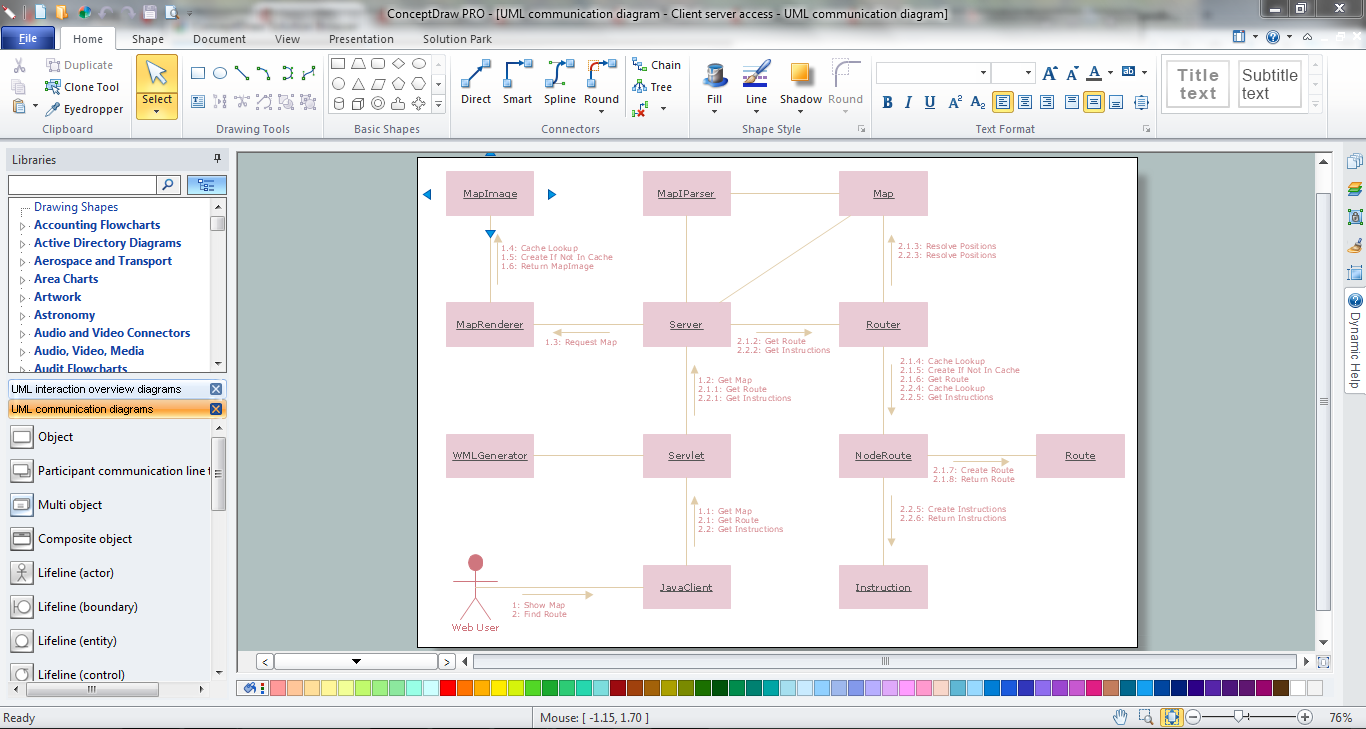
Picture: Online Diagram Tool
Related Solution:
Using mind mapping in education is very popular way to make your lecture materials more structural and clear both for you and for students. At remote learning session your students also can make notes or type questions to the current slides without interrupting slide show.
Picture: Presentations in Educational Process
Related Solution:
ConceptDraw DIAGRAM is the world’s premier cross-platform business-diagramming tool. Many, who are looking for an alternative to Visio, are pleasantly surprised with how well they can integrate ConceptDraw DIAGRAM into their existing processes. With tens of thousands of template objects, and an easy method for importing vital custom objects from existing Visio documents, ConceptDraw DIAGRAM is a powerful tool for making extremely detailed diagrams, quickly and easily.
Picture: ConceptDraw DIAGRAM : Able to Leap Tall Buildings in a Single Bound
Related Solution:
ConceptDraw MINDMAP with the ability to import presentations from Microsoft PowerPoint, as well as enhancing its existing presentation capabilities.
Picture: Best Mind Mapping Program for Making Presentations
Related Solution:
ConceptDraw DIAGRAM enhanced with Flowcharts Solution is the best flow chart maker online design software. Use it to ✔️ create clear and actionable Flowcharts, ✔️ improve decision-making, ✔️ enhance problem-solving in various scenarios, ✔️ enhance creativity and productivity across industries, ✔️ streamline workflows
Picture: Flow Chart Online
Related Solution:
The digital communication is a physical transfer of the data over a point-to-point or point-to-multipoint communication channel. Channels can be copper wires, optical fibres, wireless communication channels, etc. The data are realized as electromagnetic signals (radiowave, microwave, electrical voltage, etc.).
This example was created in ConceptDraw DIAGRAM using the Computer and Networks Area of ConceptDraw Solution Park and shows the Digital Communication Network diagram.
Picture: Digital Communications Network. Computer and Network Examples
Related Solution:
Mind map specifying various online marketing objectives for a company with specific targets outlined for each objective.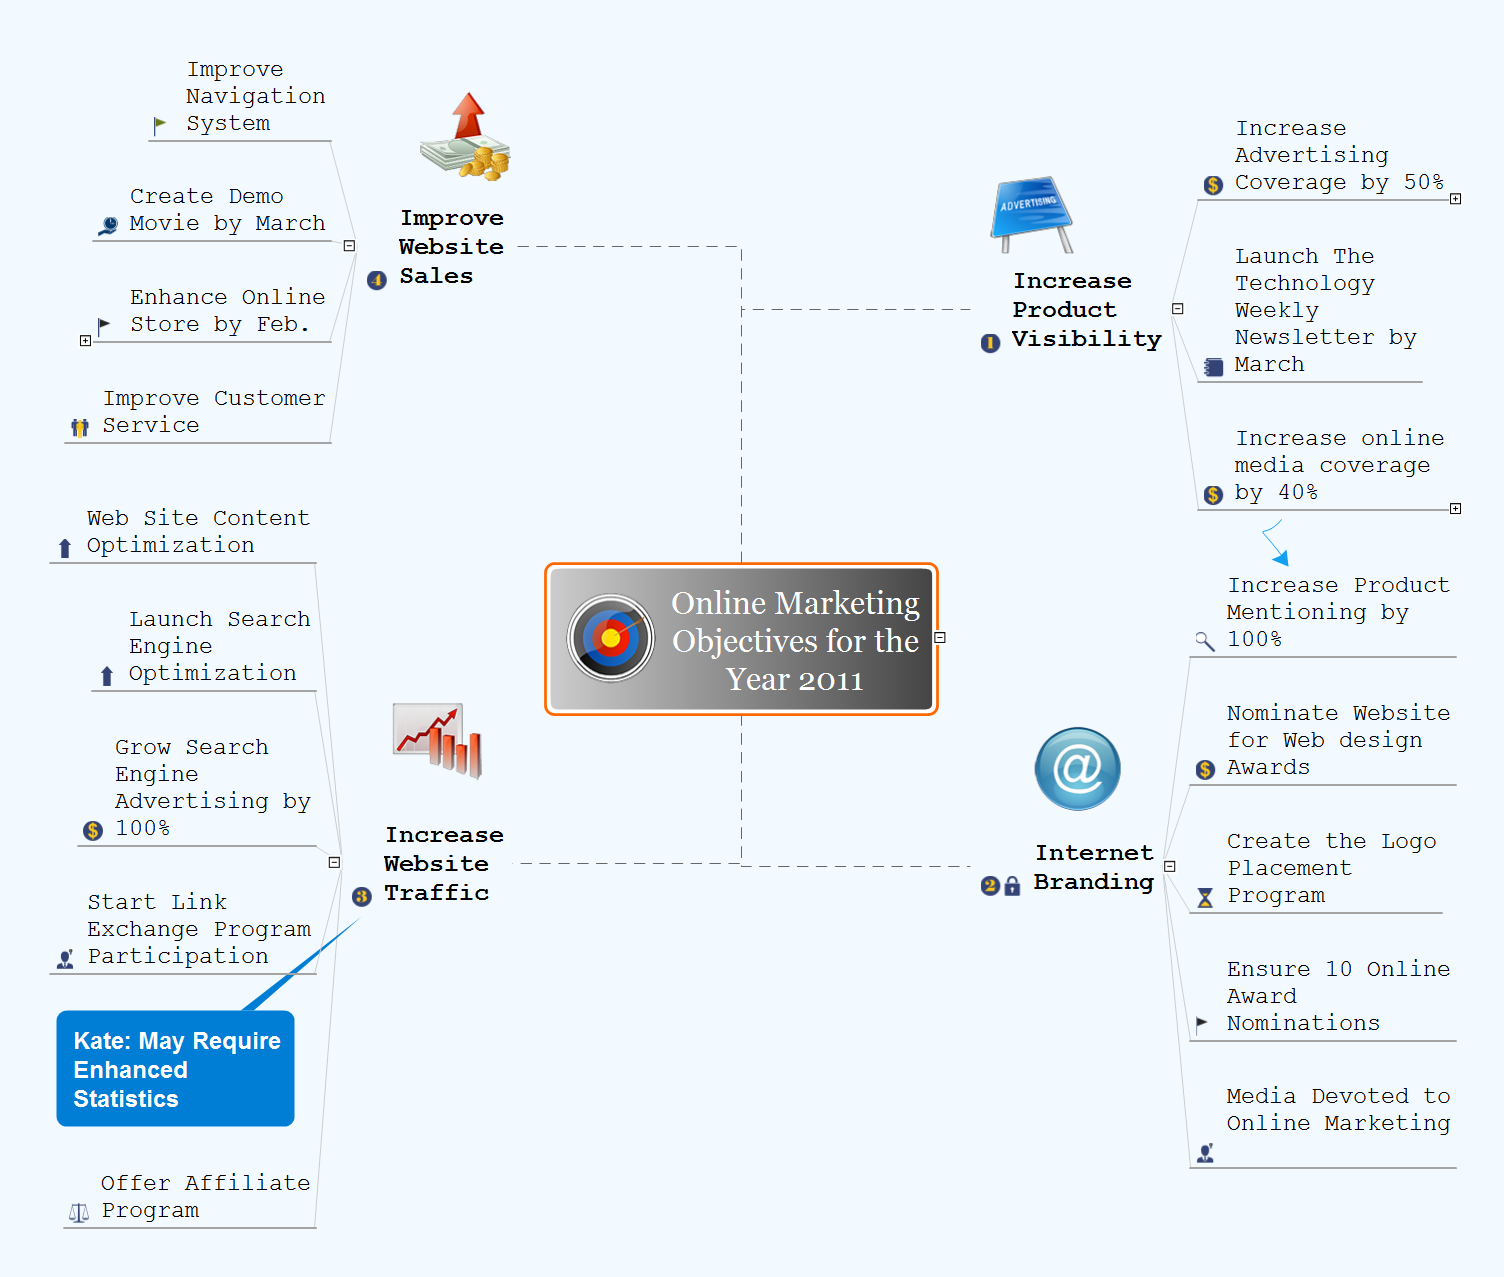
Picture: Online Marketing Objectives
Related Solution:
macOS is used increasingly often as a productivity platform by many companies and businesses across the world. SWOT Analysis is an essential business tool for companies to determine their future course of action. As a tool for digital drawing of SWOT Analysis diagrams under macOS, ConceptDraw offers Mac Tools - SWOT Analysis examples and templates are included to allow for effortless creation of SWOT and TOWS Analysis diagrams. With ConceptDraw it is equally easy to create your SWOT Analysis diagram under Microsoft Windows and macOS.
This image demonstrates the diversity of SWOT and TOWS matrix templates delivered with SWOT and TOWS Diagrams add-on for ConceptDraw DIAGRAM diagramming software. Together they compose a professional solution for performing SWOT and TOWS analysis. There are number of templates of different Matrix Diagrams. In addition to the set of embedded templates, this solution allows one to design SWOT and TOWS matrices tailored to certain business characteristics or corporate style. Using matrix template, you can easily discover Strengths, Weaknesses, Opportunities, and Threats, your business faced. This means that the first step to creating a successful business strategy, you have done.
Picture: Mac Tools - SWOT Analysis
AWS platform is great to develop reliable applications. If you are already aware of all the benefits that Amazon Web Services diagrams bring, then you'll need also a diagramming tool for architecture to share your vision. Luckily, ConceptDraw DIAGRAM has a special AWS Diagrams solution with vector icons and templates that are easy to edit.
The AWS architecture diagram, you see on this drawing, was designed using ConceptDraw Amazon Web Services Architecture Diagrams (AWS) solution. The 14 libraries, delivered with this solution introduces near 250 vector graphic images used to draw AWS Diagrams. The AWS Architecture Diagrams solution is a valuable tool for programmers, software architects and other IT professionals. It enables them to develop reliable applications with a high stage of interaction with AWS cloud.
Picture: Amazon Web Services Diagrams diagramming tool for architecture
ConceptDraw
MINDMAP 16