How To Successfully Hold a Group Meeting and Presentation
Group Meeting via Skype
With our presentation software called ConceptDraw MINDMAP you are able to successfully hold a group meeting and presentation.
ConceptDraw MINDMAP allows creating group meeting, web meeting, conference, presentation or demonstration of any kind of structured information as a mind map of a subject.
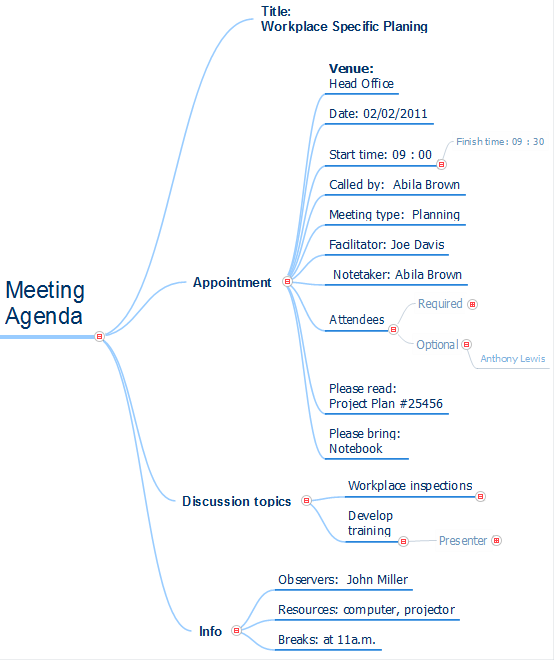
Sample 1. Meeting Agenda
Meeting agenda mind map sample is created using ConceptDraw MINDMAP mind mapping software. This mind map example helps to present the meeting agenda to workgroup as a slide show.
Use this mindmap example for implementation of Remote Presentation for Skype solution from ConceptDraw Solution Park.
See also Samples:
NINE RELATED HOW TO's:
A database is a data collection, structured into some conceptual model. Two most common approaches of developing data models are UML diagrams and ER-model diagrams. There are several notations of entity-relationship diagram symbols and their meaning is slightly different. Crow’s Foot notation is quite descriptive and easy to understand, meanwhile, the Chen notation is great for conceptual modeling.
An entity relationship diagrams look very simple to a flowcharts. The main difference is the symbols provided by specific ERD notations. There are several models applied in entity-relationship diagrams: conceptual, logical and physical. Creating an entity relationship diagram requires using a specific notation. There are five main components of common ERD notations: Entities, Actions, Attributes, Cardinality and Connections. The two of notations most widely used for creating ERD are Chen notation and Crow foot notation. By the way, the Crow foot notation originates from the Chen notation - it is an adapted version of the Chen notation.
Picture: ERD Symbols and Meanings
Related Solution:
Use the advantages of hierarchical tree structure of mind map while developing the organizational structure of your organization. Create an Organizational Chart from your map. Double click the icon to create an Organizational Chart.
The diagram is created automatically from the active page of your map by ConceptDraw DIAGRAM and will be opened in Slideshow mode.
Picture: Organizational Chart
Related Solution:
Total Quality Management (TQM) system is the management method where the confidence in quality of all organization processes is placed foremost. The given method is widely used in production, in educational system, in government organizations and so on.
Picture: Total Quality Management with ConceptDraw
ConceptDraw DIAGRAM is a powerful diagramming and vector drawing software. Extended with Matrices Solution from the Marketing Area of ConceptDraw Solution Park it became the best software for quick and easy designing various types of Matrix Diagrams, including Positioning Map.
Picture: Positioning Map
Related Solution:
Video tutorials on ConceptDraw products. Try it today!
Picture: What can you create with ConceptDraw MINDMAP?
Collaboration software for small and medium business allows communicate with partners around the globe via Skype.
Picture: How to Collaborate in Business via Skype
Related Solution:
Easy charting software comes with beautiful chart templates and examples. This makes it easy to create professional charts without prior experience.
Graphs and Charts Area provide a wide collection of professional looking predesigned templates, samples and ready-to-use vector stencils that will help you to draw the charts and diagrams of various types: Pie Charts, Donut Charts, Line Charts, Column Charts, Bar Charts, Pyramids, Scatter Charts, Venn Diagrams, Spider Charts, Area Charts, Divided Bar Graphs.
Picture: Chart Software for Better Presentations
Related Solution:
These vector illustrations and cliparts are created for drawing the Project management Illustrations and contain plenty of project management design elements. The clipart library Project management includes 35 icons.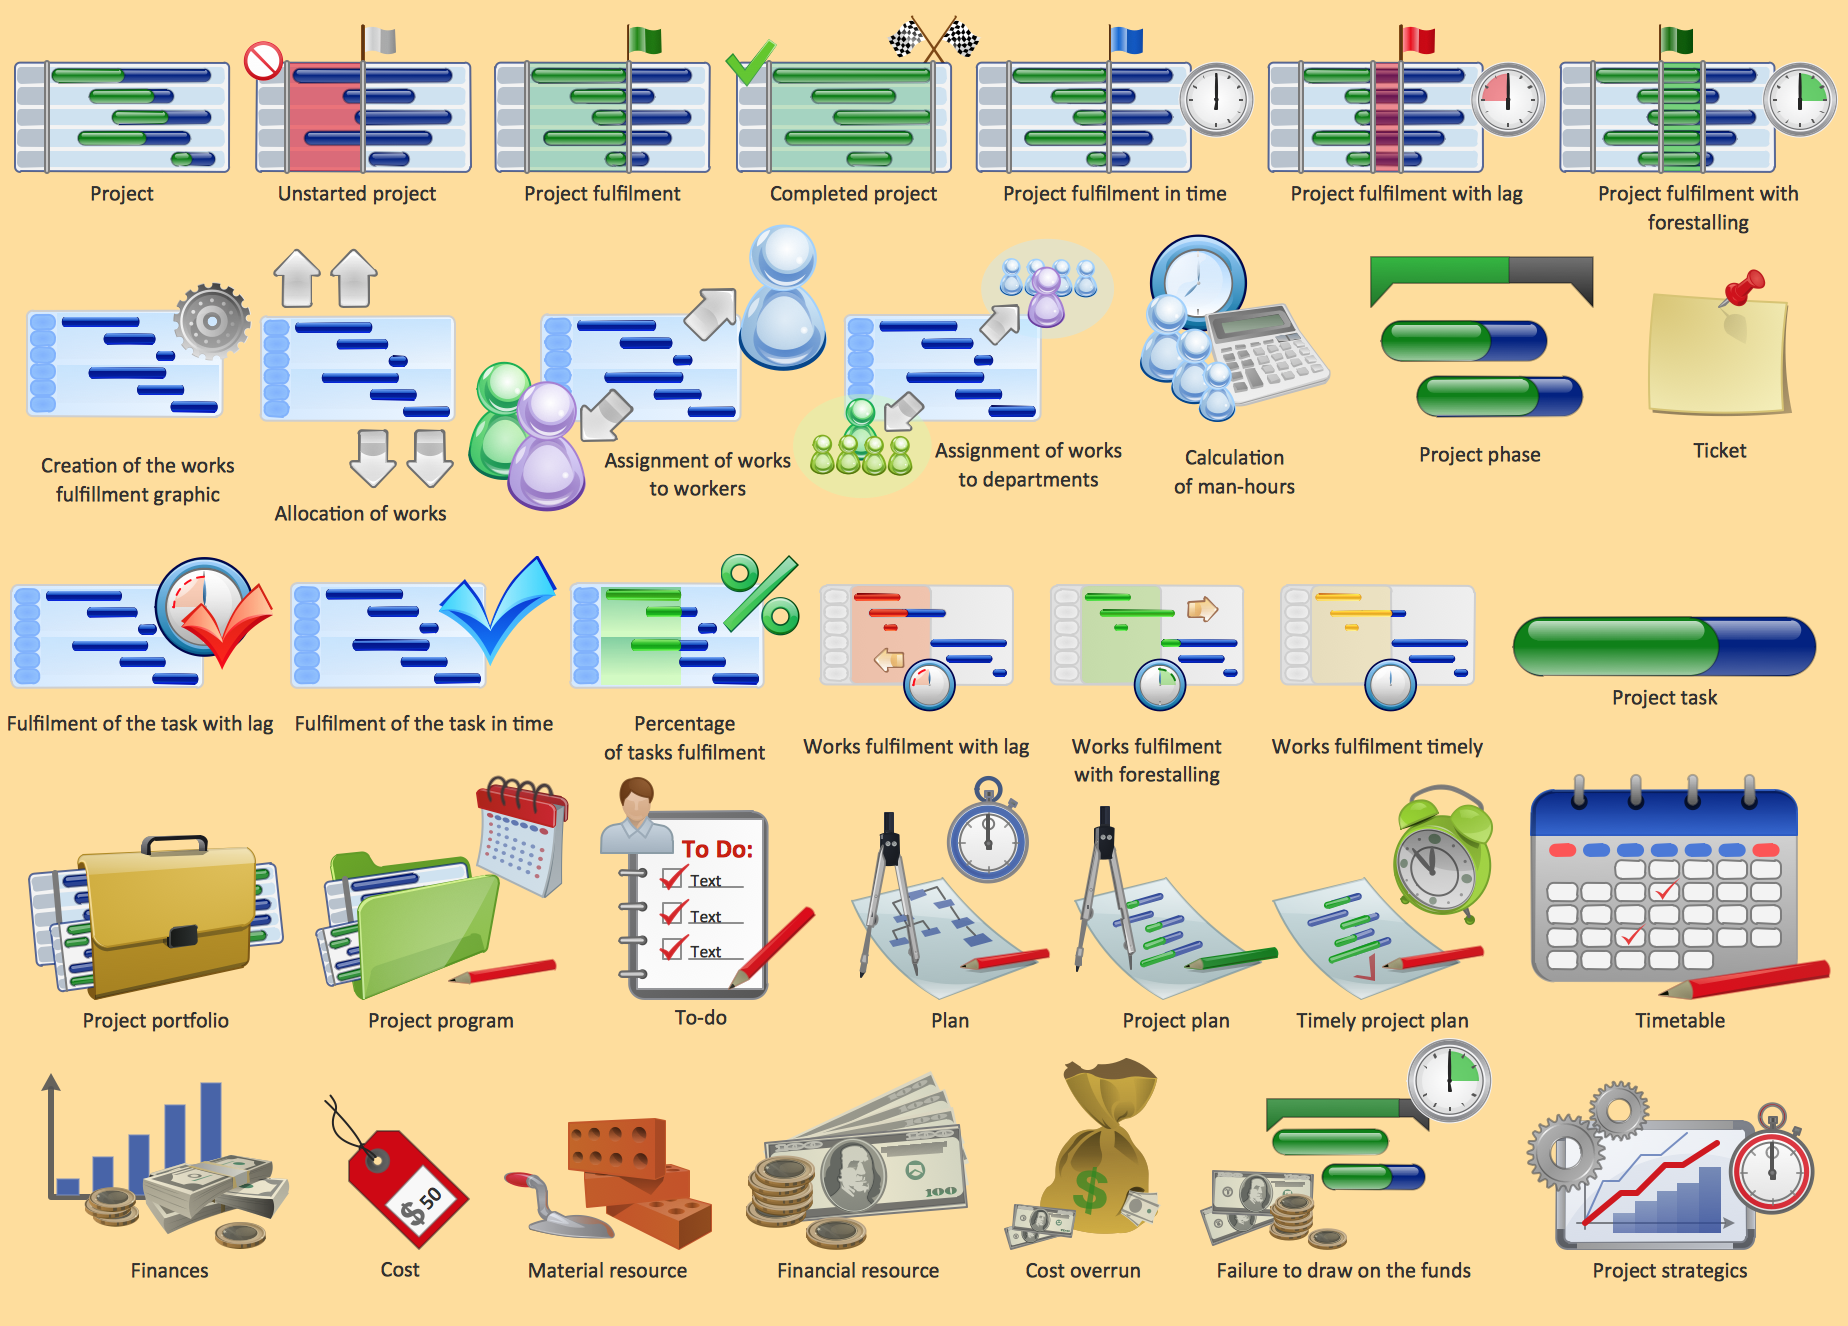
Picture: Project management - Design Elements
Related Solution:
The strategic balance is a combination of factors that can both positively and negatively affect the activity of the company. To know the factors that influence the organization success, managers should use SWOT matrix template that will define the potential inner strengths and weaknesses and potential external opportunities and threats. This matrix does not contain a ready solution, but allows to streamline all the available information.
This is a handy template of a SWOT matrix. It can serves as a visual guide for management students. To simplify the task, on the left and on the right we have added hints with examples of external and internal factors. This template one can found among numerous templates of SWOT and TOWS matrices that are included in the the eponymous solution by ConceptDraw Solution Park.
Picture: SWOT Matrix Template
ConceptDraw
MINDMAP 16