Made with
ConceptDraw
DIAGRAM 18

Product Overview

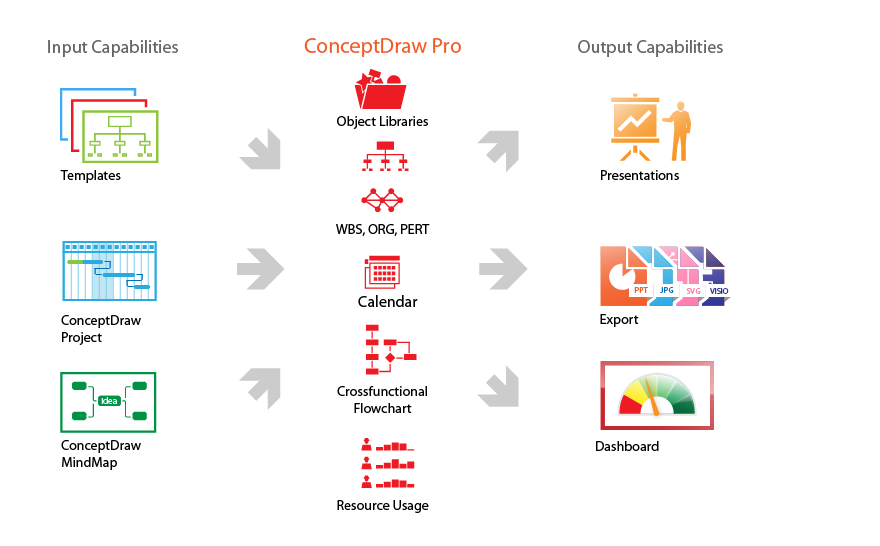
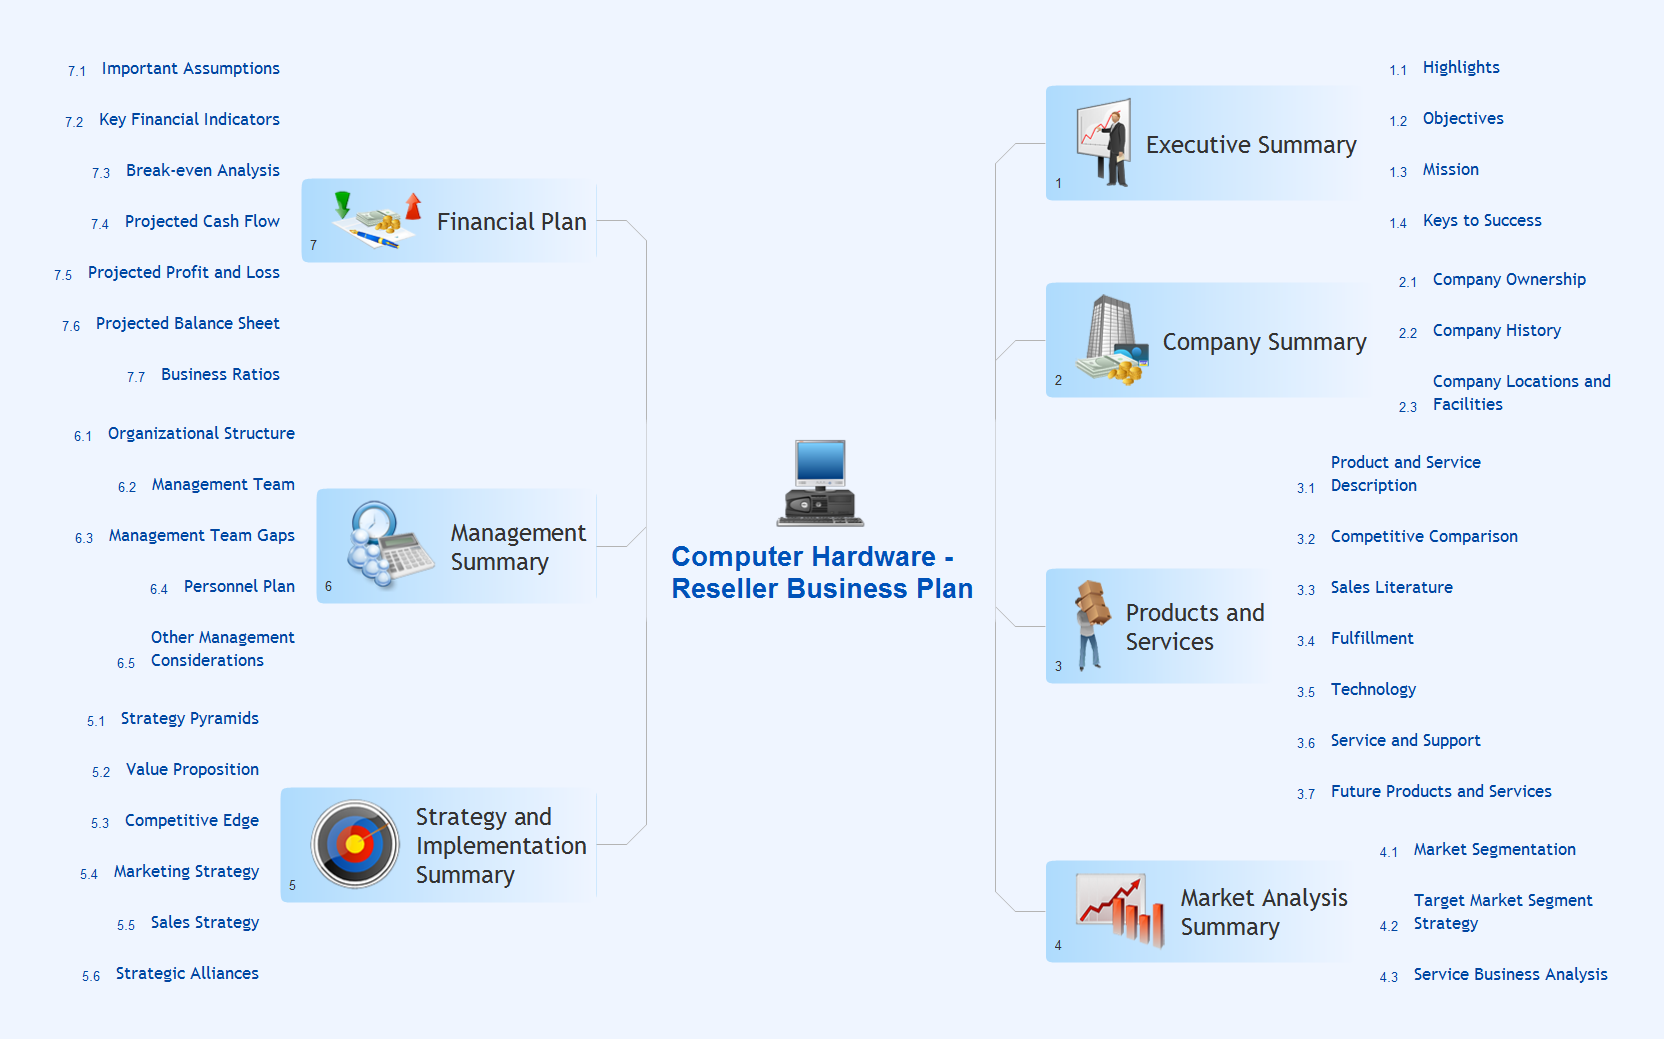
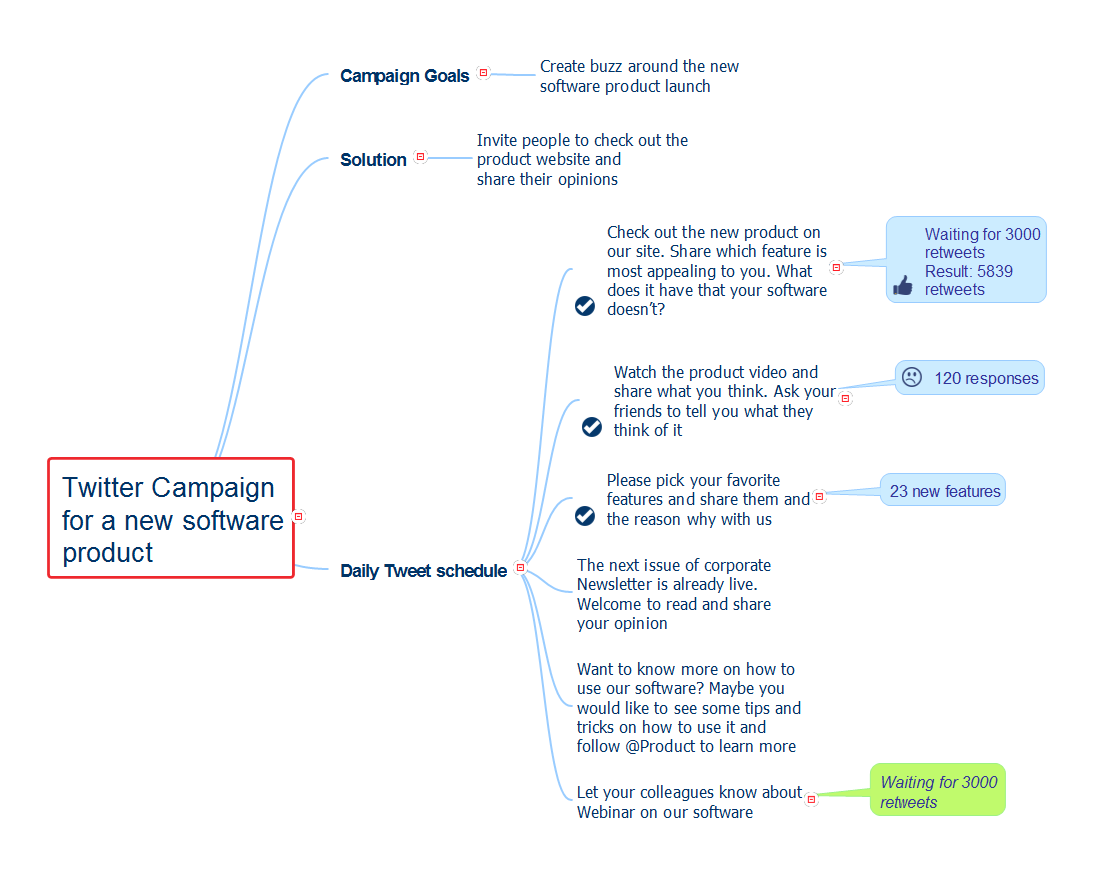
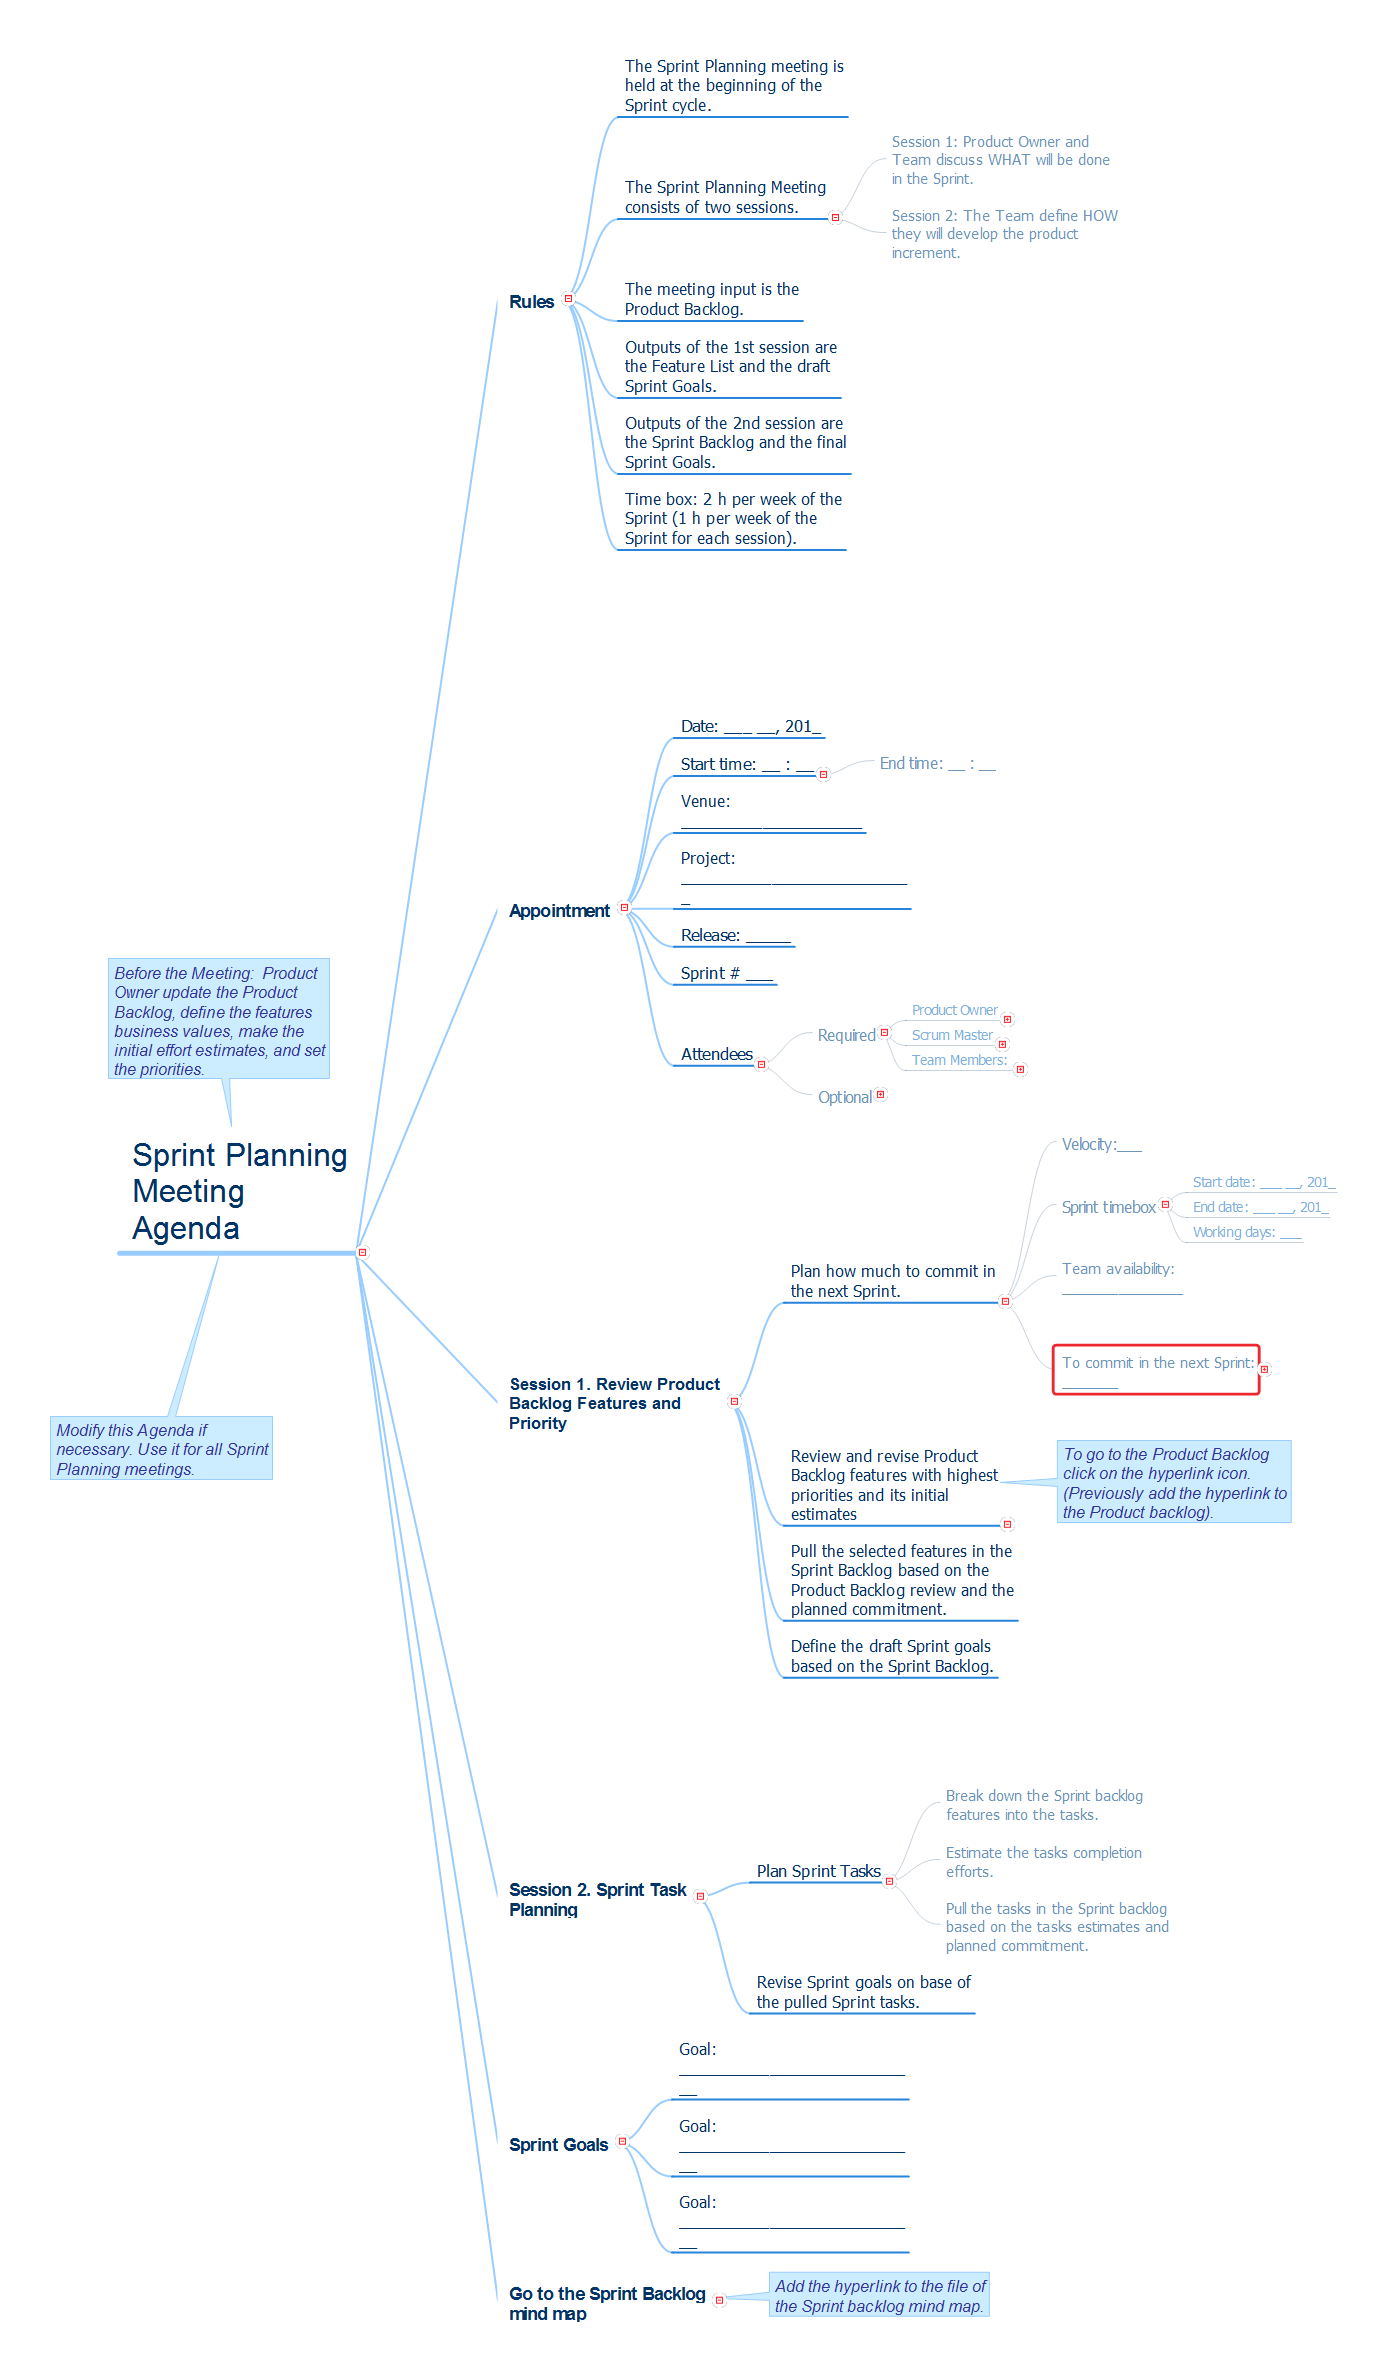
ConceptDraw MINDMAP enables you to present information as a visual map taking full advantage of pictures, symbols, text and the color, to make documents easy to comprehend and remember. ConceptDraw MINDMAP provides versatile integration with MS Office and project management software along with complete support of mind mapping and brainstorming techniques.

ConceptDraw MINDMAP as a component of ConceptDraw Office

The role of ConceptDraw MINDMAP is to organize and plan idea development and communicate between process participants. Mind maps are convenient to prepare presentations for team and management and send task lists and related information. A unique combination of ConceptDraw MINDMAP and ConceptDraw PROJECT forms the creative environment for the team working.

Feature Tour

Extract maximum productivity from knowledge working
Create environment to work the manner you do
Share information with other people and applications
Adding mind mapping features to IPod
ConceptDraw MINDMAP for Projects featured tools
Product Overview *
TEN RELATED HOW TO's:
Create value stream maps - for value stream analysis and value stream management, material and information flow mapping, using our quick start templates included with ConceptDraw.Best Value Stream Mapping mac Software *
Picture: Best Value Stream Mapping mac Software
Related Solution:
PM Made Easy allows you to plan and execute projects using mind mapping techniques, implement planning using mind mapping, and track tasks using ConceptDraw Project.Gantt Chart Diagram *
Picture: Gantt Chart Diagram
Related Solution:
Big and complex projects sometimes need some simplification of plans and schedules. That's why Program Evaluation and Review Technique was invented and first implemented in 1958. You can create PERT diagrams effortlessly with ConceptDraw DIAGRAM and share them with your colleagues. Program Evaluation Review Technique (PERT) is a method that is used to assess and analyze projects. PERT is a valuable tool for the project management practice. PERT gives an assessment and analysis of the time needed to the project completion. A PERT chart is a visual tool that delivers a graphical view of a project timeline. It is used to display the sequences and dependences of project tasks necessary to complete a project. ConceptDraw DIAGRAM delivers the possibility to build a PERT along with other diagrams applied to assist management process by using its Seven Management and Planning Tools solution.Program Evaluation and Review Technique <br>(PERT) with ConceptDraw DIAGRAM  *
Picture: Program Evaluation and Review Technique (PERT) with ConceptDraw DIAGRAM
Related Solution:
ConceptDraw MINDMAP - an excellent tool for exporting mind maps to PowerPoint to visualize and presenting your project. You can simply generate, change, update your mindmap and then make a presentation in PowerPoint.How To Do A Mind Map In PowerPoint *
Picture: How To Do A Mind Map In PowerPoint
Related Solution:
ConceptDraw Solution Park creates a single information space for messaging to teams. PM Teams provides project participants and organizations with better tools that assist in task understanding, timeframe understanding, and project events in the entire organization. Improved communication fosters positive team spirit throughout.Org Chart Diagram *
Picture: Org Chart Diagram
Related Solution:
ConceptDraw Quality MindMap solution is a perfect additional tool for the quality team of your organization.Quality issues in heir organization *
Picture: Quality issues in heir organization
Related Solution:
ConceptDraw DIAGRAM is a powerful drawing and vector diagram maker software that allows to design the professional looking Influence Diagrams quick and easy.Influence Diagram Software
Picture: Influence Diagram Software
Related Solution:
ConceptDraw DIAGRAM is effective software for a variety of activity fields. Now, extended with Sales Flowcharts solution from the Marketing area of ConceptDraw Solution Park it become also useful in the field of sales. It helps to design professional looking Sales Flowcharts, Sales Process Flowcharts, Sales Process Maps, Plans and Diagrams to effectively realize the process of selling a product or service, and to display the sales results.Sales Process *
Picture: Sales Process
Related Solution:
Identify the root causes of quality issues with Fishbone diagram. Because Fishbone diagram is hierarchical it is well-suited for capturing in a mind map for reviewing process towards proving which branch is the real root cause of an issue.Fishbone Diagram *
Picture: Fishbone Diagram
Related Solution:
ConceptDraw is a good means of visualization of information of any kind as it features powerful graphic capabilities. The conception of using ConceptDraw and open formats by the programs that work with Internet can be used for displaying any data and any structure in Internet.Internet solutions with ConceptDraw DIAGRAM *
Picture: Internet solutions with ConceptDraw DIAGRAM
ConceptDraw
DIAGRAM 18