Made with
ConceptDraw
DIAGRAM 18

BPMN

Being involved in BPMN, you might find Business Process Diagram Solution a very useful tool for making it possible to create the needed business diagrams within a short period of time getting the professionally as well as smart looking result. Having ConceptDraw DIAGRAM diagramming and drawing software downloaded from this site allows making it possible to create the representations of the business processes so they look simply good making it easier to understand the given data.

BPMN *

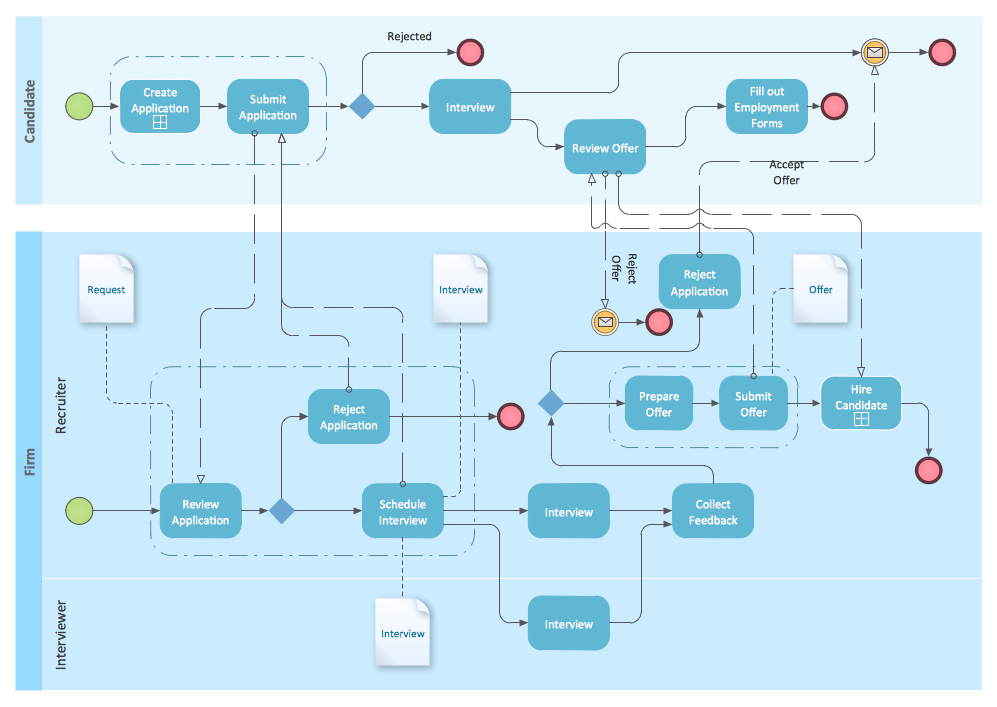
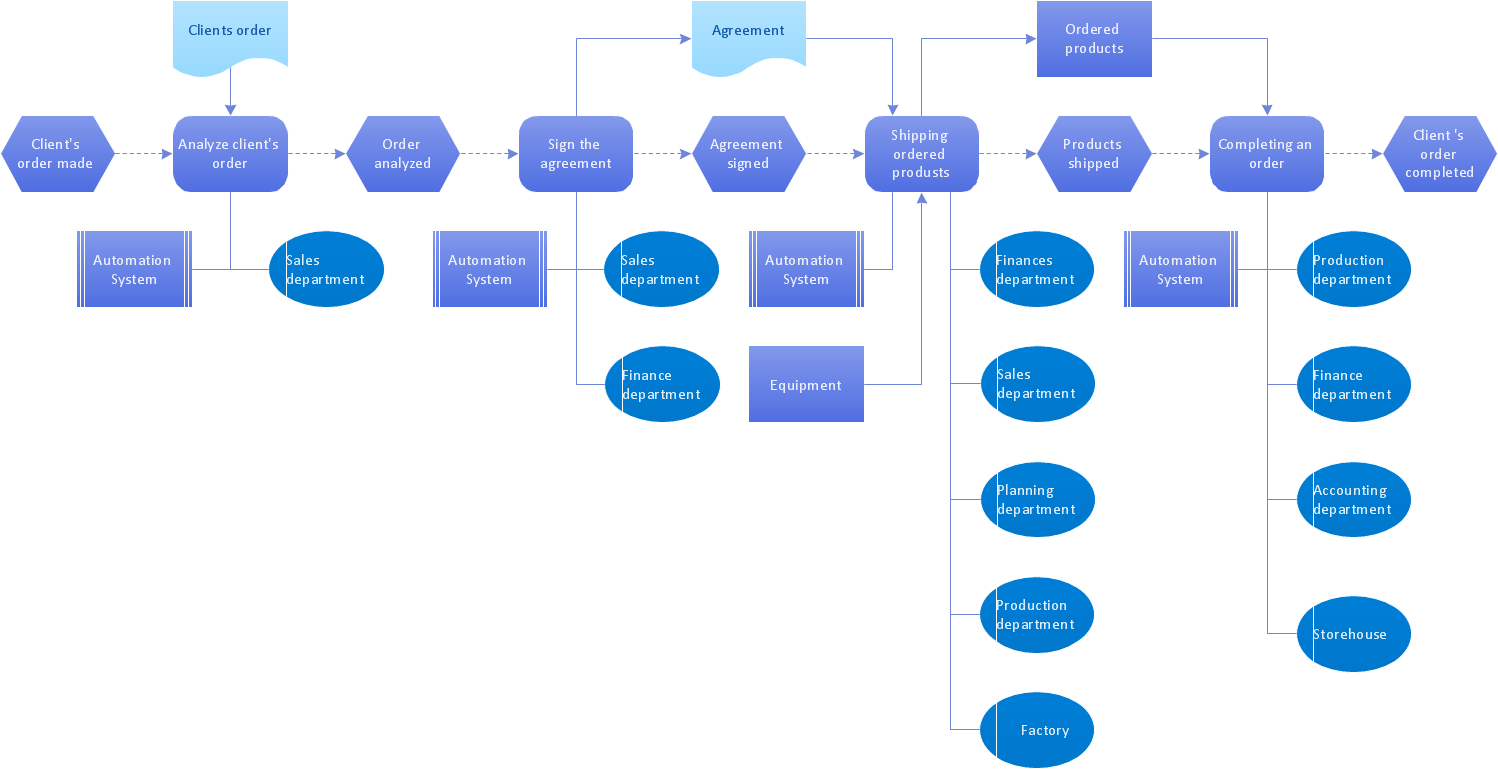
Example 1. BPMN 1.2 Diagram - Hiring Process

With the help of Business Process Diagram Solution it is always possible to illustrate such processes as hiring one, the production, the sales process, the purchase one and many other activities within the business sphere you are involved in. Having such examples of the pre-made diagrams, as “BPMN 1.2 Diagram — Hiring Process”, “BPMN Diagram — Conversation”, “Conversation BPMN 2.0 Diagram — Advertising Creation Process”, “BPMN 2.0 Diagram — Trouble Ticket System”, “A Process with Normal Flow”, “Conversation BPMN 2.0 Diagram — Recruitment and Training”, “Group in Active Plenary”, “BPMN 2.0 Diagram — Logistics Choreography”, “Business Process Diagram — Votes Collection Process”, “Collaboration BPMN 2.0 Diagram - Invoicing”, “BPMN 2.0 Diagram – Booking Process”, “Collaboration BPMN 2.0 Diagram — Public Process”, “BPMN 2.0 Diagram — Order Process”, “BPMN 1.2 Diagram — Taxi Order Process”, “Discussion Cycle Process”, “Quotation BPMN Example”, “BPMN 1.2 Diagram — Taxi Service Order Procedure”, etc.


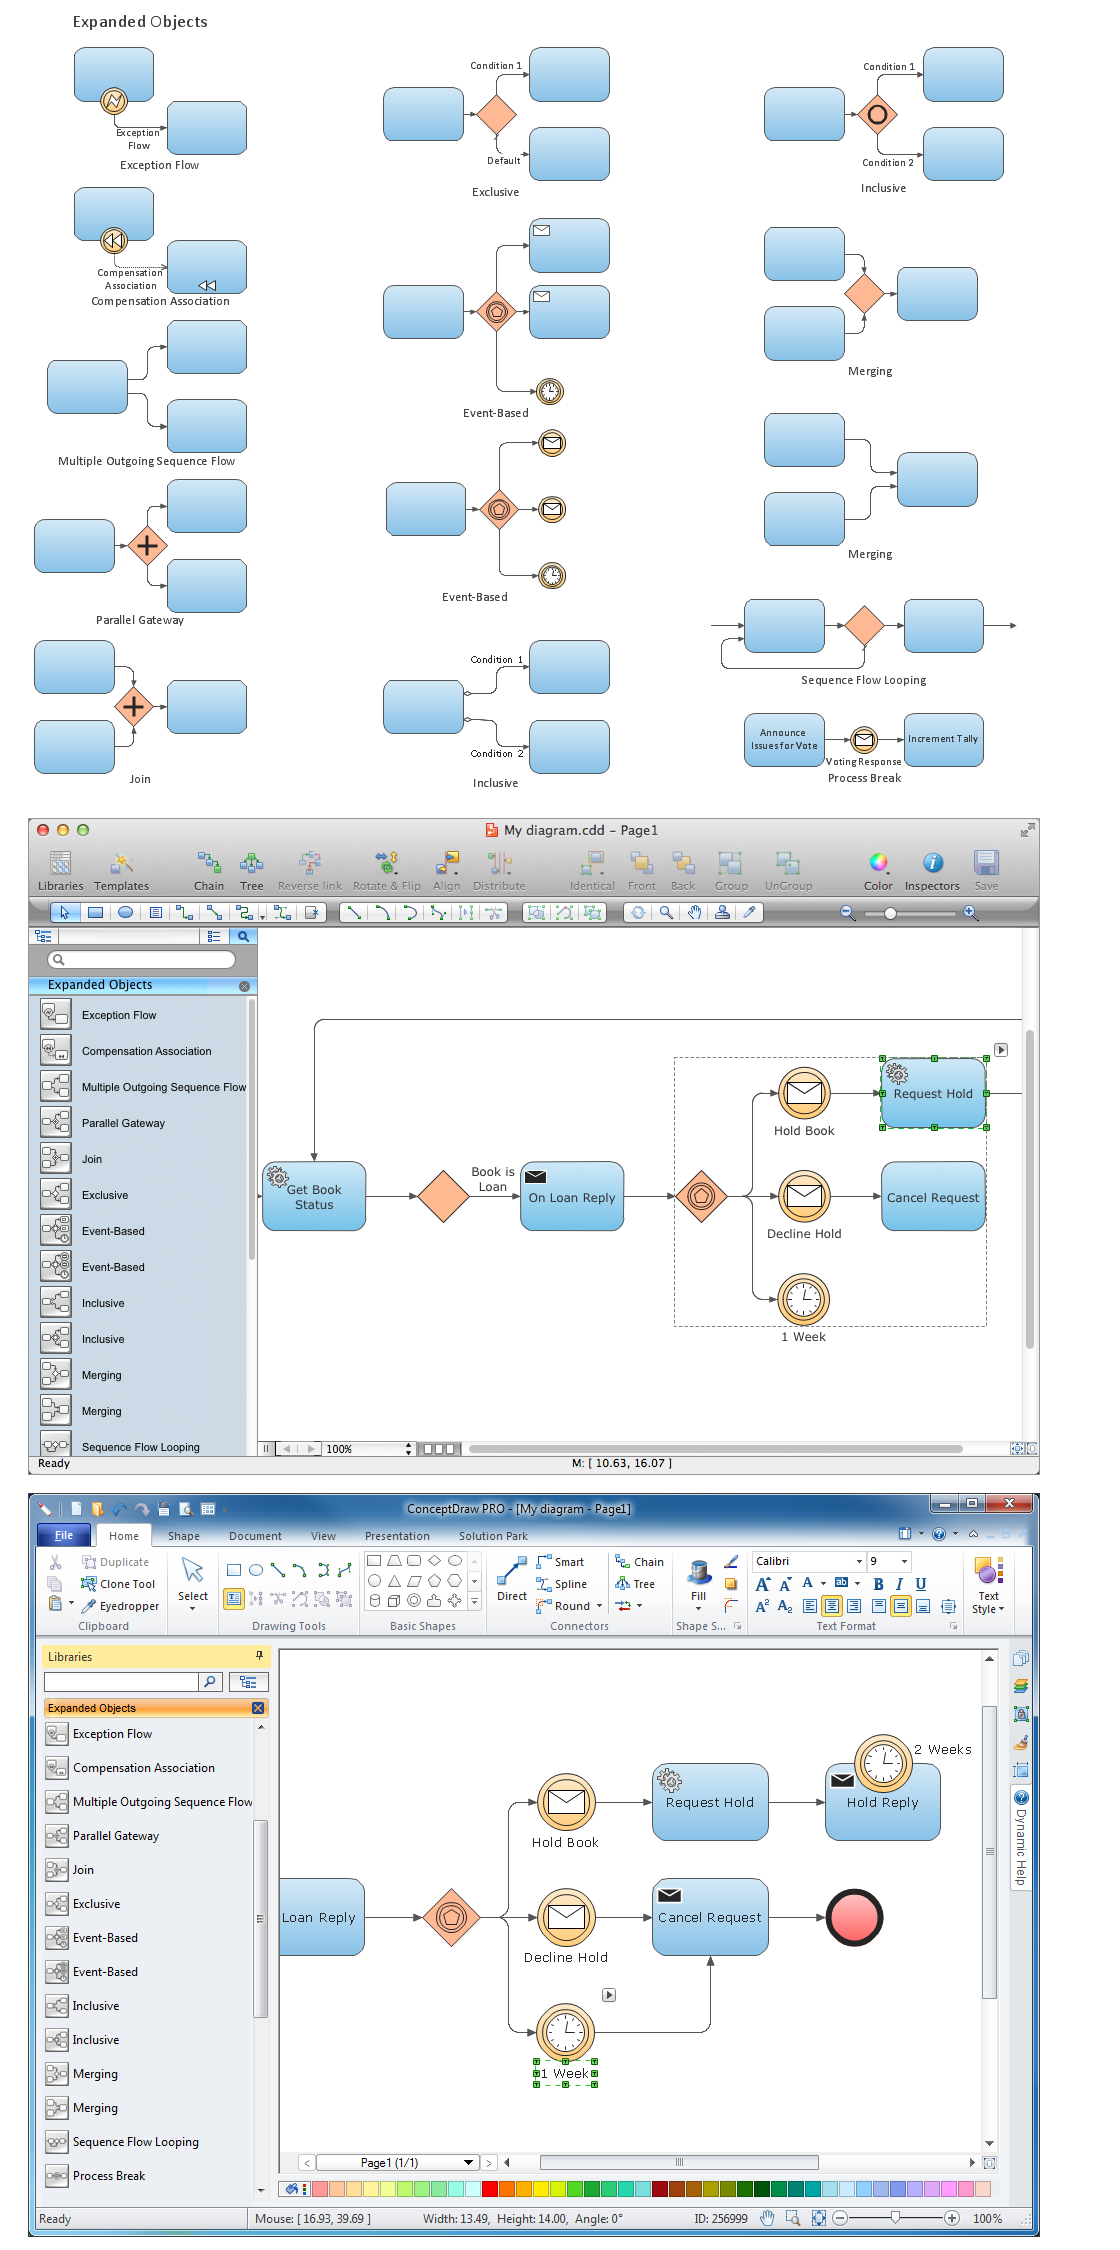
Apart from the mentioned examples, which all can be always edited so they look the way the ConceptDraw DIAGRAM users having them wish, there are also a lot of design elements which are all available to drop and drag into the ConceptDraw DIAGRAM file for putting them in the needed order getting the great looking result within only an hour or a couple of minutes. The stencil library called “Design Elements BPMN 1.2 — Activities” includes the representations of such activities, taking place within the Business Process Model and Notation (BPMN), as: Task, Collapsed sub-process, Loop process, Loop sub-process, Multiple instance, Multiple instance sub-process, Compensation, Compensation sub-process, Ad-hoc process, Ad-hoc sub-process, Transaction, Expanded sub-process, Compensation, Loop process, Ad-hoc process and Multiple instance.

Next stencil library available to all ConceptDraw DIAGRAM users who have the Business Process Diagrams Solution downloaded from the ConceptDraw STORE application is called “Design Elements BPMN 2.0 — Activities”, including the illustrations of Task, Service Task, Send task, Receive task, User task, Manual task, Business rule task, Script task, Call activity global task, Call activity sub-process from “Tasks” section, Subprocess, Subprocess Collapsed, Ad hoc sub-process collapsed, Event sub-process, Event sub-process collapsed, Transaction, Transaction collapsed from “Subprocesses” section, etc.

The “Design Elements BPMN 1.2 — Rapid Draw” stencil library offers the design symbols representing Task, Task — Document, Task — Urgent, Task — Order, Task — Email, Task — Packaging, Decision; such task types icons as Document, Urgent, Order, E-mail and Packaging; the icons for showing the start of some event, their intermediate stage and their end, as well as gateways.

The “Design Elements BPMN 2.0 — Choreographies” is another library full of design symbols, representing different tasks, activities and processes within the BPMN. There are many different representations of different connections, which all can be used from the “Design Elements BPMN 1.2 — Connections” library, such as the “Sequence flow” ones (normal, conditional and default), Message flow and Association (directed or/and non-directed).

The “Design Elements BPMN 2.0 — Conversations” library represents the Communication Element, Compound Conversation Element, Call Conversation (Global Conversation), Call Conversation (Collaboration), Pool (Participant), Pool (MI Participant), Horizontal Pool and Horizontal Pool (MI Participant), as well as the Conversation Links.

The “Design Elements BPMN 2.0 — Data” library has the Data Object, Data Input, Data Output, Collection Data Object, Data Input Collection, Data Output Collection, Data Store, Initiating Message, Non-initiating message and Data Association symbols. Next, “Design Elements BPMN 2.0 — Events” represent the Events mentioning their Start, Intermediate and End.

BPMN Diagram - Conversation

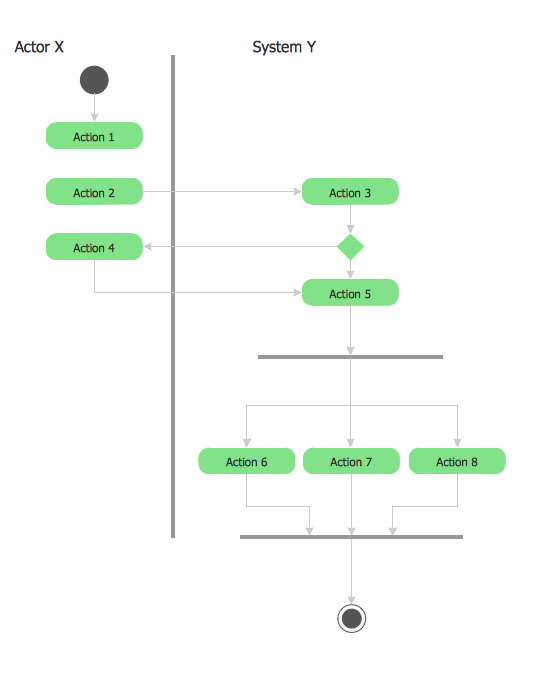
Example 2. BPMN Diagram — Conversation

Keeping in mind an opportunity to use the ConceptDraw DIAGRAM diagramming and drawing software as well as the mentioned solution (a Business Process Diagram) downloaded from ConceptDraw STORE, you can always make it possible to get the pre-designed elements and templates for making your own unique diagram of the different business processes, such as order ones, shipping ones, representing the process of production, etc.

In order to simplify all the ConceptDraw DIAGRAM users’ work of creating the needed drawings, such as the BPMN diagrams, the new product of CS Odessa — the ConceptDraw STORE application — was created. Having it means having an opportunity to download any of so many available solutions full of the pre-made samples, templates and layouts, as well as stencil libraries full of different design symbols, depending on the subject of each of the solutions itself.

Taking this opportunity to download the previously described applications may allow you to succeed in what you do by providing you, same as any other ConceptDraw DIAGRAM user, with all the needed tools for getting the final great looking as well as professional and smart looking result.


TEN RELATED HOW TO's:
In order to be successful, you have to promote your business on the market. One of the ways for planning this promotion is to create a social media DFD Flowchart which will contain all the details of your business strategy. Social media is a very influential tool, and it's a mistake to ignore it. The following flowchart represents a best way to estimate social media posts, and gives a strategy of responses. This flowchart is designed in the format of cross-functional flowchart. With this format, we can divide the process into three distinct phases. This approach helps to generate well-considered and balanced response on social networks activities. Using ConceptDraw solution for Social Media Response, your reaction to social media posts will positively mirror the values and mission of your business.How to Create a Social Media DFD Flowchart *
Picture: How to Create a Social Media DFD Flowchart
Related Solution:
Visual navigation through the stages of a response process helps you locate specific actions to be taken via Action Mind Maps. Use ConceptDraw DIAGRAM and ConceptDraw MINDMAP for organize the process of response for interactions occurring in social media.Create Response Charts *
Picture: Create Response Charts
Related Solution:
Pyramid diagrams help you visualize information as a triangle divided into horizontal slices. Labelled slices represent a hierarchy. Pyramids are used in marketing presentations to show and analyze hierarchy levels. 3D triangular diagram of DIKW pyramid has 6 levels: measurement, facts, data, information, knowledge, wisdom. The data component include different scattered signs or symbols which are merely useless until these random objective facts are somehow processed. Data is a resource which has to be manipulated or rearranged to get useful. Information can be extracted from a pile of data, it also can be mined from different data storages.Pyramid Diagram *
Picture: Pyramid Diagram
Related Solutions:
Now, thanks to the new HR Flowcharts Solution, it become also ideal for designing HR Flowcharts and visually displaying the hiring process steps.Hiring Process Steps
Picture: Hiring Process Steps
Related Solution:
Pyramid chart example is included in the Pyramid Diagrams solution from Marketing area of ConceptDraw Solution Park.Pyramid Diagram *
Picture: Pyramid Diagram
Related Solutions:
A database is a data collection, structured into some conceptual model. Two most common approaches of developing data models are UML diagrams and ER-model diagrams. There are several notations of entity-relationship diagram symbols and their meaning is slightly different. Crow’s Foot notation is quite descriptive and easy to understand, meanwhile, the Chen notation is great for conceptual modeling. An entity relationship diagrams look very simple to a flowcharts. The main difference is the symbols provided by specific ERD notations. There are several models applied in entity-relationship diagrams: conceptual, logical and physical. Creating an entity relationship diagram requires using a specific notation. There are five main components of common ERD notations: Entities, Actions, Attributes, Cardinality and Connections. The two of notations most widely used for creating ERD are Chen notation and Crow foot notation. By the way, the Crow foot notation originates from the Chen notation - it is an adapted version of the Chen notation.ERD Symbols and Meanings
Picture: ERD Symbols and Meanings
Related Solution:
If you need to pull together a quick marketing drawing, you'll find elements, samples, templates and libraries with vector clip art for drawing the Marketing Illustrations. These symbols and signs you can use in your design for Strategic Marketing, Graphic Design, Inbound and Content Marketing, Social Media, Lead Generation, Email Marketing and Automation, CRM implementation and Integration and more.Marketing - Design Elements *
Picture: Marketing - Design Elements
Related Solution:
Both Crow’s Foot and Chen’s notations are used to build database models. Each of them has its’ own features, and if you use a proper entity relationship diagram software, you’ll be able to create diagrams of any notation. Database model with clearly defined entities and relationships between them facilitates further work greatly. This ERD represents the model of Employee Certification Entity. The entity-relationship diagram is a visual instrument of database software development. It is used to structure data and to define the relationships between structured data groups. This ERD was designed with a help of ConceptDraw Entity-Relationship Diagram (ERD) solution. The solution supports the both basic ERD notations used to describe the structure of database: Chen's and Crow’s Foot notations.Entity Relationship Software *
Picture: Entity Relationship Software
Related Solution:
The purchasing process follows very specific guidelines and includes a purchasing cycle flowchart and receiving process flow chart. Common key elements of purchasing process. It is important to know how purchasing processes work and how each operation is done.Purchase Process Flow Chart,<br>Receiving Process Flow Chart,<br>Accounting Flowchart Example. *
Picture: Purchase Process Flow Chart,Receiving Process Flow Chart,Accounting Flowchart Example.
Related Solution:
ConceptDraw DIAGRAM is a powerful tool that helps you create a Cross Functional Flow Chart quickly and easily. Fine-tuning the objects in ConceptDraw DIAGRAM allows you to create a really professional finished article. ConceptDraw Arrows10 Technology gives drawing connectors a smart behavior that provides quick and precise placement, allows for easy changes and automatic rearrangement.Double-headed Cross Functional Flowchart *
Picture: Double-headed Cross Functional Flowchart
Related Solution:
ConceptDraw
DIAGRAM 18