Business Process Modeling
BPMN 2.0
ConceptDraw DIAGRAM is a software for simplу depicting the business processes based on BPMN 2.0 standard. The Business Process Diagram solution contains pre-designed libraries and templates they makes modeling of the business processes a simple point-and-click actions for create professional, presentation-ready business process diagrams quickly and efficiently.
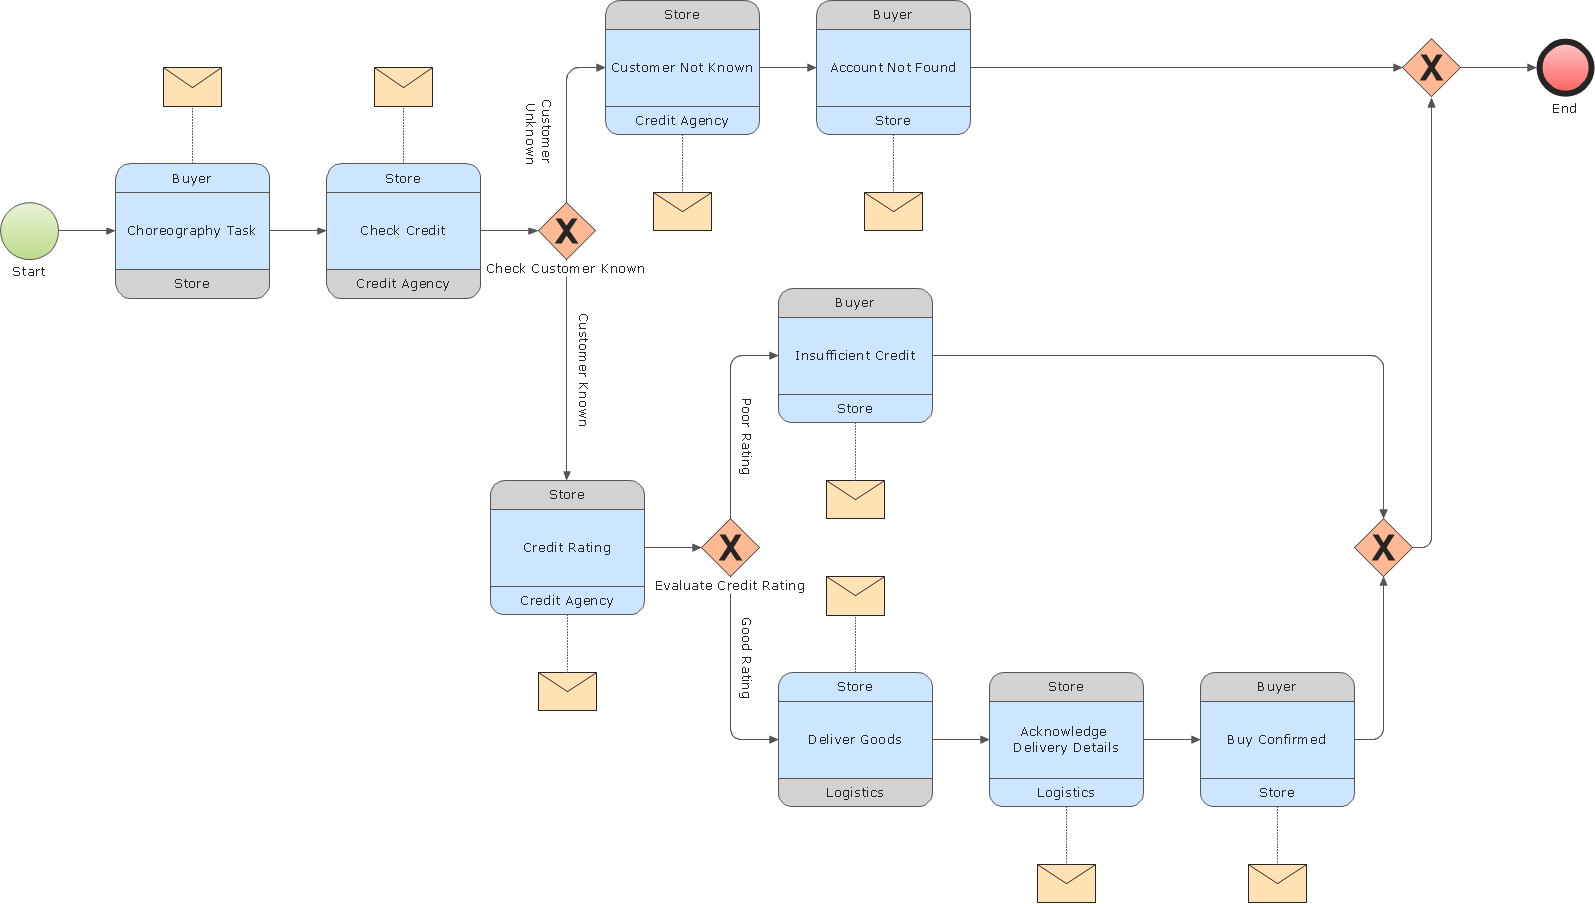
Pic.1 Choreography model diagram BPMN 2.0 sample: Logistics.
A choreography diagram defines the expected behavior between interacting participants. The choreography activities are interactions that represent a set of message exchanges which involves two or more participants. There is no central controller, responsible entity or observer of the process.
See also Samples:
TEN RELATED HOW TO's:
Swimlanes are a visual mechanism of organizing and categorizing activities, in BPMN consist of two types: Pool, Lane. Use ConceptDraw Swimlanes library with 20 objects from BPMN.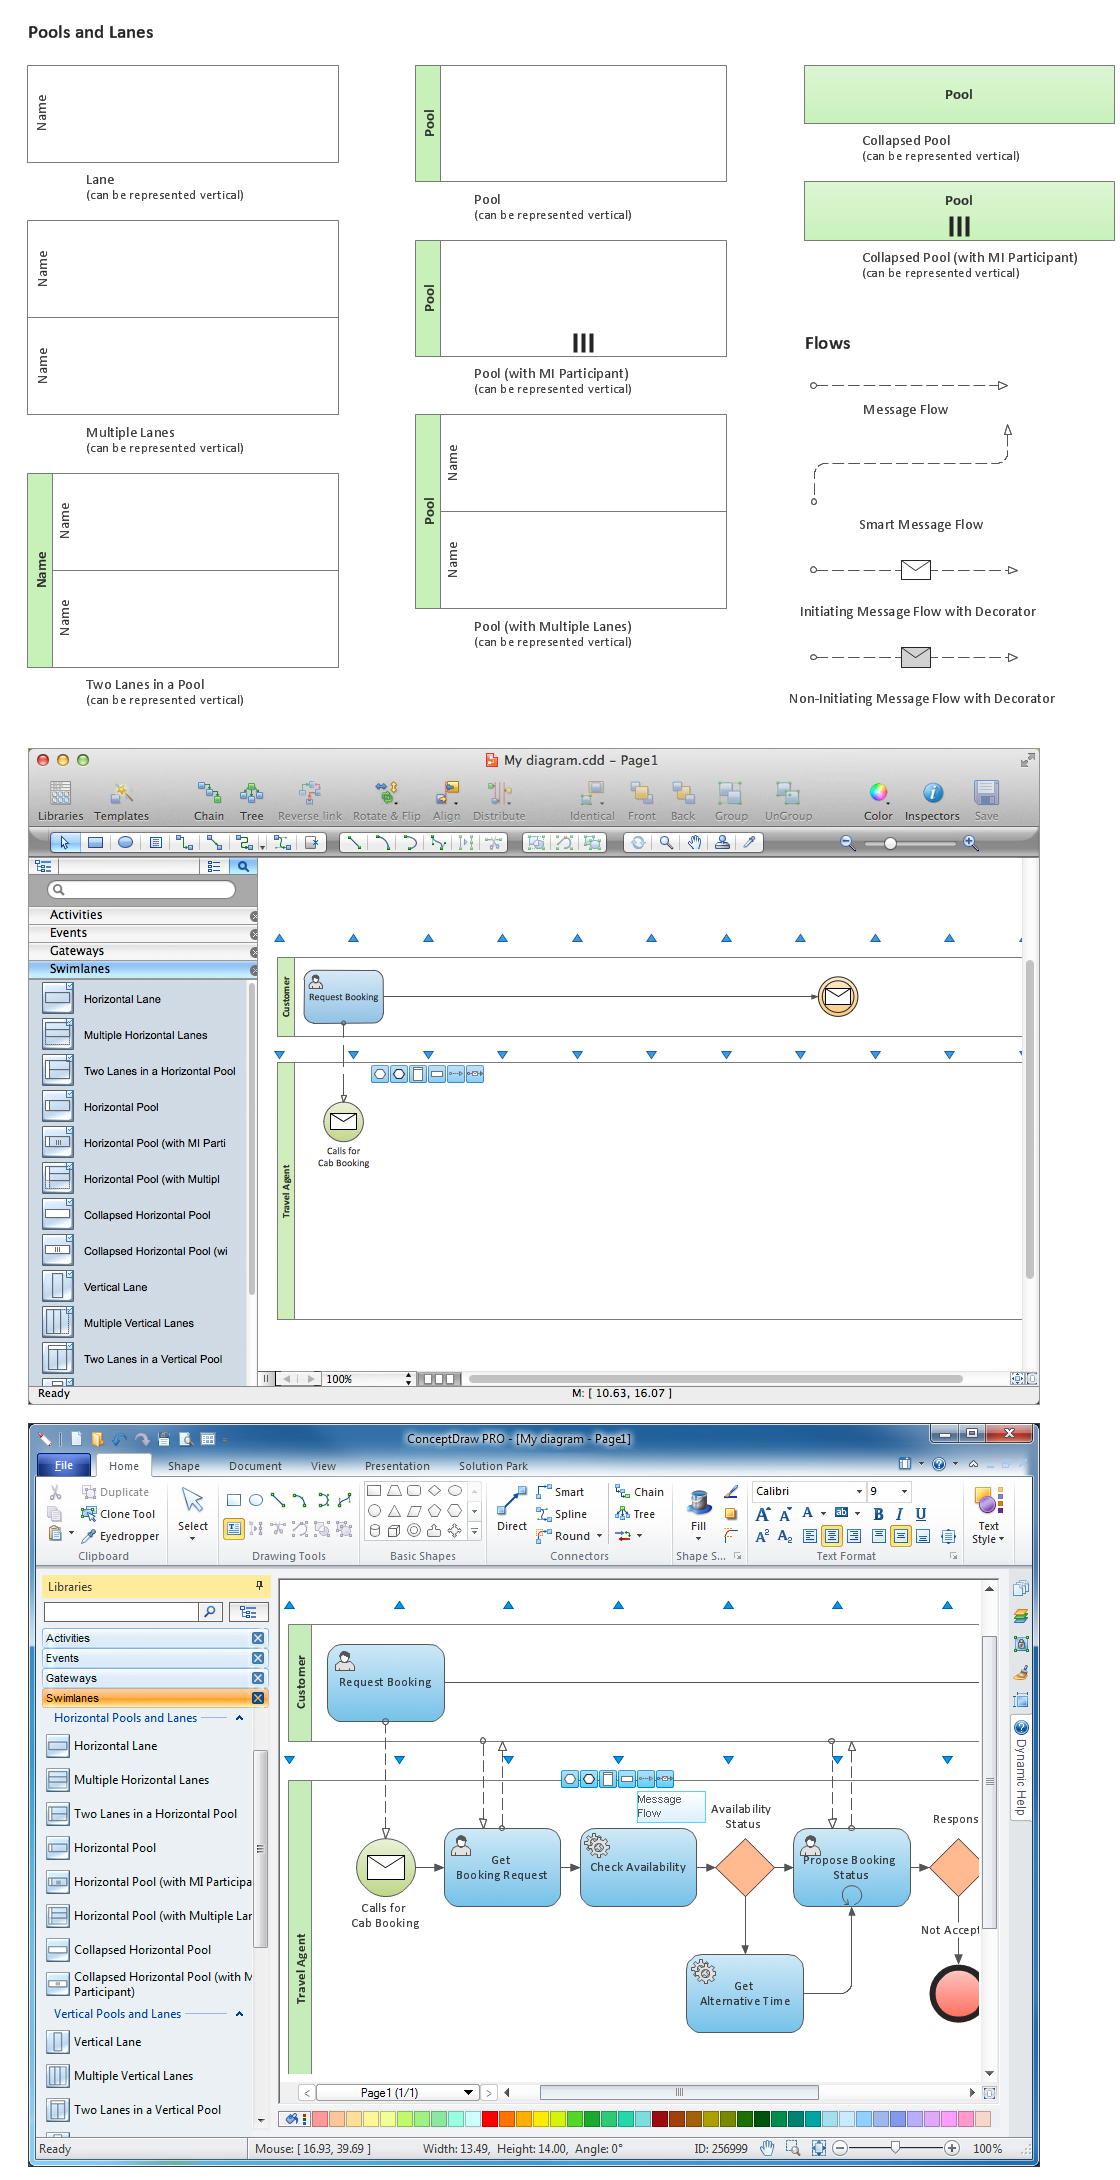
Picture: Diagramming Software for Design Business Process Diagrams
The Nature Solution addition to ConceptDraw Solution Park for ConceptDraw DIAGRAM includes new libraries that provide a wide range nature objects and it can be used to augment documentation and graphics. Draw beautiful nature scenes using ConceptDraw DIAGRAM software with Nature solution.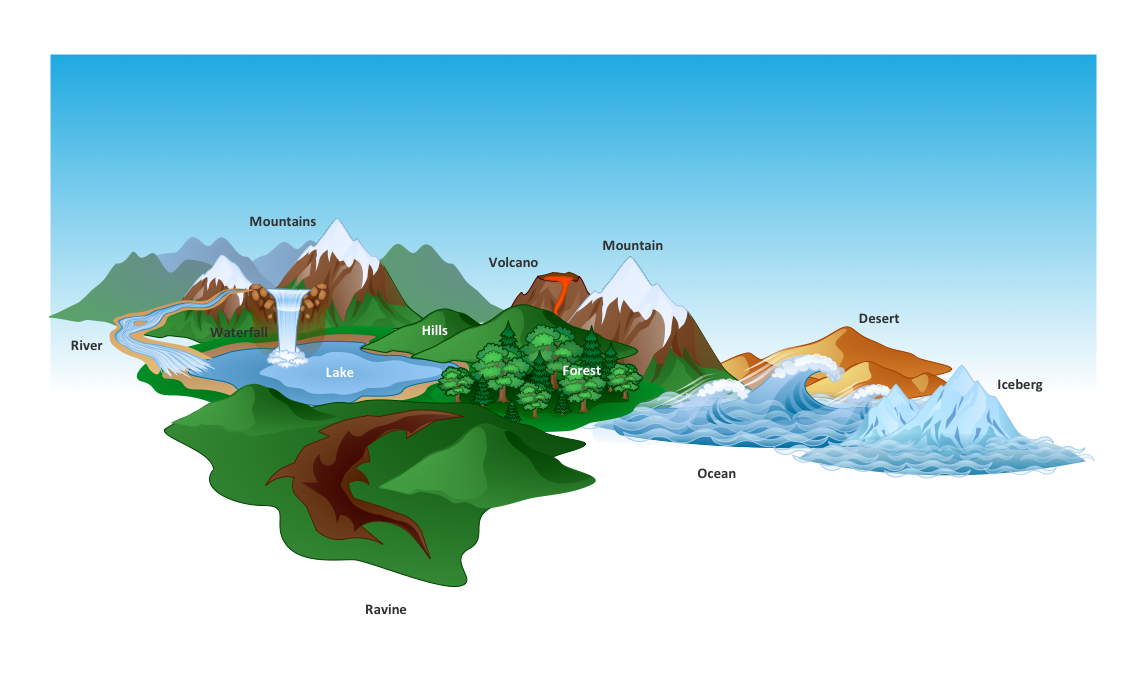
Picture: Beautiful Nature Scene: Drawing
Learn about Systems Engineering, its process and discover practical examples illustrated through diagrams. ✔️ How to draw Systems Engineering diagrams using the ConceptDraw DIAGRAM software?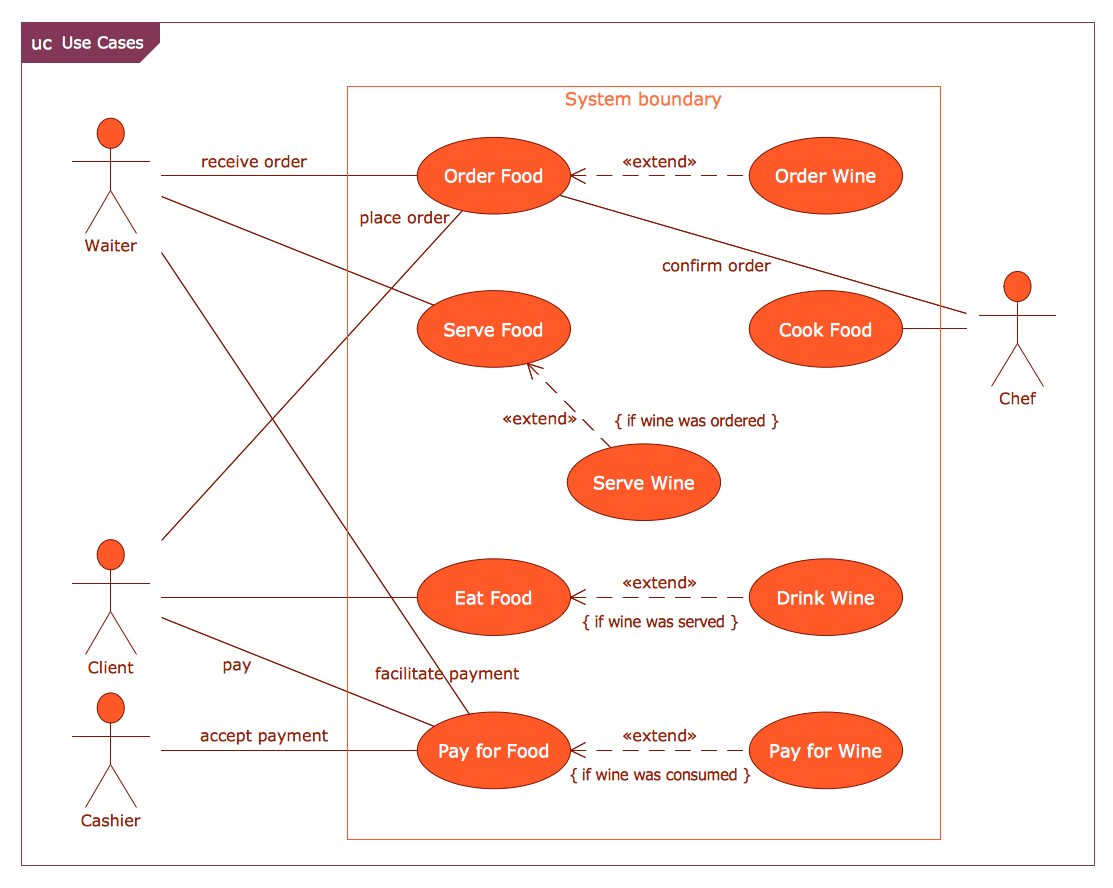
Picture:
What is a Systems Engineering?
Examples of Systems Engineering Diagrams
Related Solution:
Food Art →
Food courts are very popular places. You want to increase attendance, advertise and invite attention to your food court? Make interesting design and create pictorial and bright food art posters and signboards, and don't forget to decorate your menu with images of tasty treats!
ConceptDraw DIAGRAM diagramming and vector software supplied with Food Court solution from the Food and Beverage area of ConceptDraw Solution Park offers powerful drawing tools for effective food art.
Picture: Food Art
Related Solution:
ConceptDraw DIAGRAM diagramming and vector drawing software extended with Electrical Engineering Solution from the Industrial Engineering Area of ConceptDraw Solution Park affords you the easiest and fastest way for designing professional looking Electrical Schematics.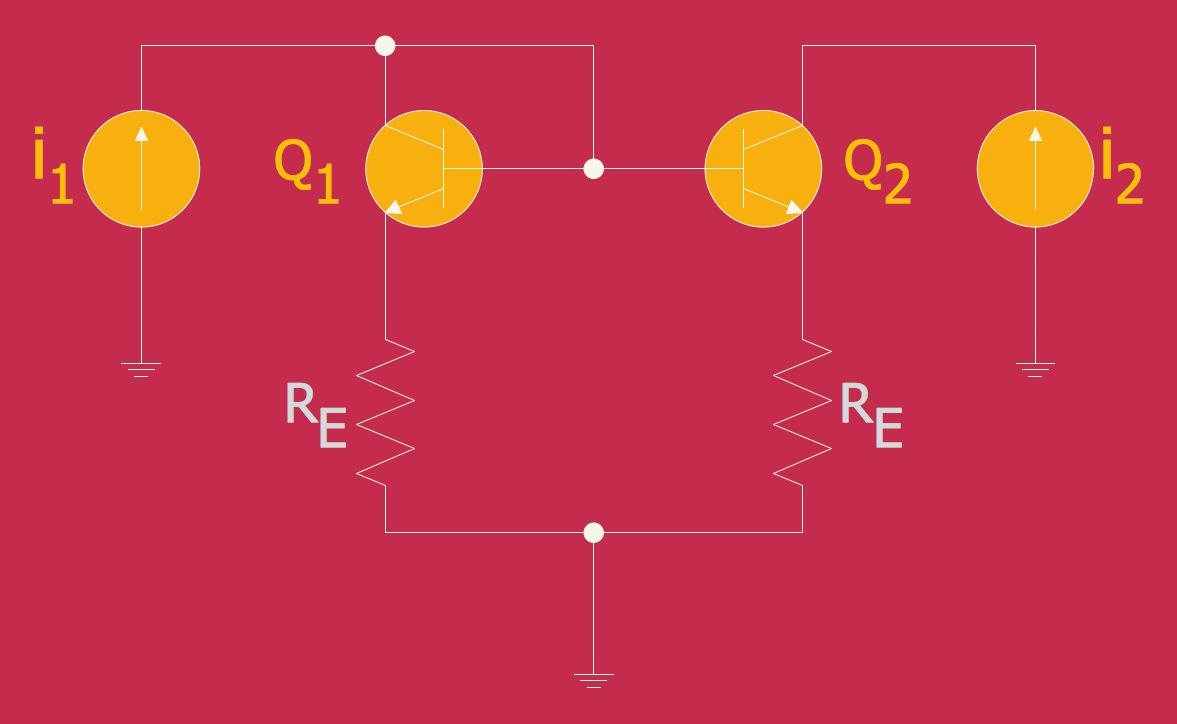
Picture: Electrical Schematics
Related Solution:
A pie chart or a circle graph is a circular chart divided into sectors, illustrating numerical proportion. In a pie chart, the arc length of each sector and consequently its central angle and area, is proportional to the quantity it represents.
Pie chart examples and templates created using ConceptDraw DIAGRAM software helps you get closer with pie charts and find pie chart examples suite your needs.
Picture: Pie Chart Examples and Templates
Related Solution:
Event-Driven Process Chain Diagrams for improvement throughout an organisation.
ConceptDraw DIAGRAM - software that reduces the time needed to create a business process model.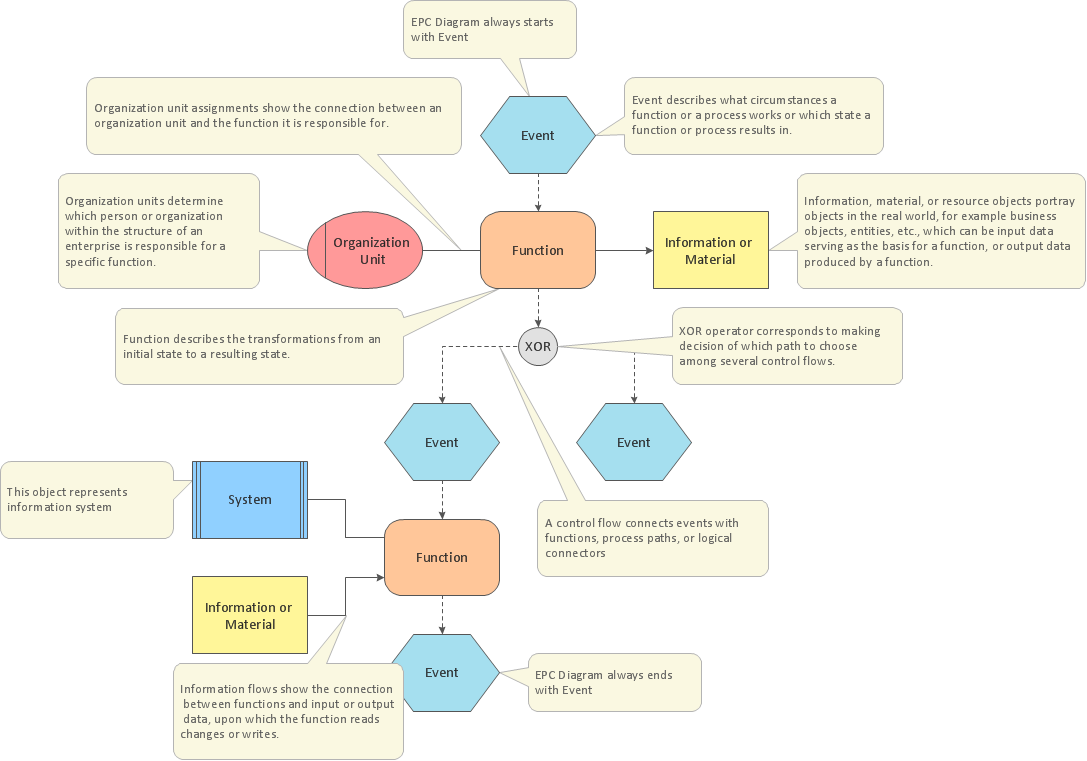
Picture: EPC for Business Process Implementation
Related Solution:
Business Process Flow Diagram is one of the main tool of business analysis and business process re-engineering that lets identify and easy understand process flows within organization. Sign up and start today.
Picture: Business Process Flow Diagram
Related Solution:
The EPC diagram shows various business processes in terms of work flows.
Event-Driven Process chain Diagrams for improvement throughout an organisation.
ConceptDraw DIAGRAM - software that reduces the time needed to create a business process model and is great business process improvement tools.
Picture: The Best Tool for Business Process Modeling
Related Solution:
A flowchart is a powerful tool for examining processes. It helps improving processes a lot, as it becomes much easier to communicate between involved people, to identify potential problems and to optimize workflow. There are flowcharts of different shapes, sizes and types of flowchart vary from quite basic process flowcharts to complex program flowcharts. Nevertheless, all these diagrams use the same set of special symbols like arrows to connect blocks, parallelogram to show data receiving or rectangles for showing process steps.
Basic flowcharts are used to represent a simple process algorithm. A basic flowchart notation consists of rectangles (business processes), arrows (the flow of information, documents, etc.). The same notation is used in items such as the "decision", which allow you to do the branching. To indicate the start of the entire business process and its termination can be used the "Terminator" element. The advantages of Basic Flowchart are simplicity and clarity. With it you can quickly describe the business process steps. Creating of Basic Flowchart does not require any special knowledge, as easily understand by employees with different levels of education and IQ.
Picture: Types of Flowchart: Comprehensive Overview
Related Solution:
ConceptDraw
DIAGRAM 18