Six Markets Model Chart
This sample shows the Six Markets Model Chart. It was created in ConceptDraw DIAGRAM diagramming and vector drawing software using the Marketing Diagrams Solution from the Marketing area of ConceptDraw Solution Park.
The six markets model defines six markets that take the central place in the relationship marketing: internal markets, supplier markets, recruitment markets, referral markets, influence markets and customer markets. The six markets model allows the organization to analyze the stakeholders and key market domains that can be important to it.
Referral marketing is method of the promotion the products or services to the new customers through referrals. Customer marketing is a strategy directed on the creating strong customer relationships. The marketing to suppliers is directed on the long-term relationships between the parties in which all understand the needs of each other. Influence marketing defines and focuses on the individuals that have the influence on the potential customers. The internal market is intended for increasing the rivalry and specialization, for larger the economies of scale and improvement the efficiency of the resources allocation. Recruitment marketing is the science of identifying the employment brand, its effectively refining and promoting to achieve the better recruitment results.

Sample 1. Six markets model chart.
Using the ready-to-use objects from the Marketing Diagrams Solution for ConceptDraw DIAGRAM you can create your own professional looking Marketing Diagrams quick and easy.
TEN RELATED HOW TO's:
The Total Quality Management Diagram solution helps your organization visualize business and industrial processes. Create Total Quality Management diagrams for business process with ConceptDraw software.
Picture: Identifying Quality Management System
Related Solution:
This method of problem analysis is widely used in IT, manufacture industries and chemical engineering. If you want to take a fresh look on your problem, you can draw a fishbone diagram with ConceptDraw DIAGRAM software, which supports both MAC OS and Windows. You can see and download fishbone diagram samples and templates in ConceptDraw Solution Park.
This Fishbone (Ishikawa) diagram can be applied as template for performing the cause and effect analysis of a service industry problems. It can help to determine factors causing problems. Causes in this diagram are categorized according to the 4S’s principle that means Surroundings, Suppliers, Systems and Skills. Grouping causes allows to reveal main interactions between different events. This diagram was made using ConceptDraw Fishbone diagrams solution. It can help to reveal the causes effected a complicated issue. Of course it can be used together with other methods of approaching to the problem solving.
Picture: Draw Fishbone Diagram on MAC Software
Related Solution:
Working as a designer, you might find developing projects exciting and difficult at the same time. It is a challenging task to create a usable interior design that will fulfill all the customer’s requirements. So, in order to aid yourself, you can use special software to create site plans, landscape designs, furniture layouts.
This example of an interior plan introduces an internal area of a small cafe. The floor plan demonstrates interior angle "view from above". It involves many different elements of furniture such as tables , chairs and various cushioned furniture. Also it includes a kitchen fixtures and furniture. Making this plan was managed by the ConceptDraw Cafe and Restaurant Floor Plan solution. The libraries, composing this solution contain about vector graphic 300 objects. It can be use to help interior designers to develop interior design proposals, communicate ideas and concepts that relate to a interior design.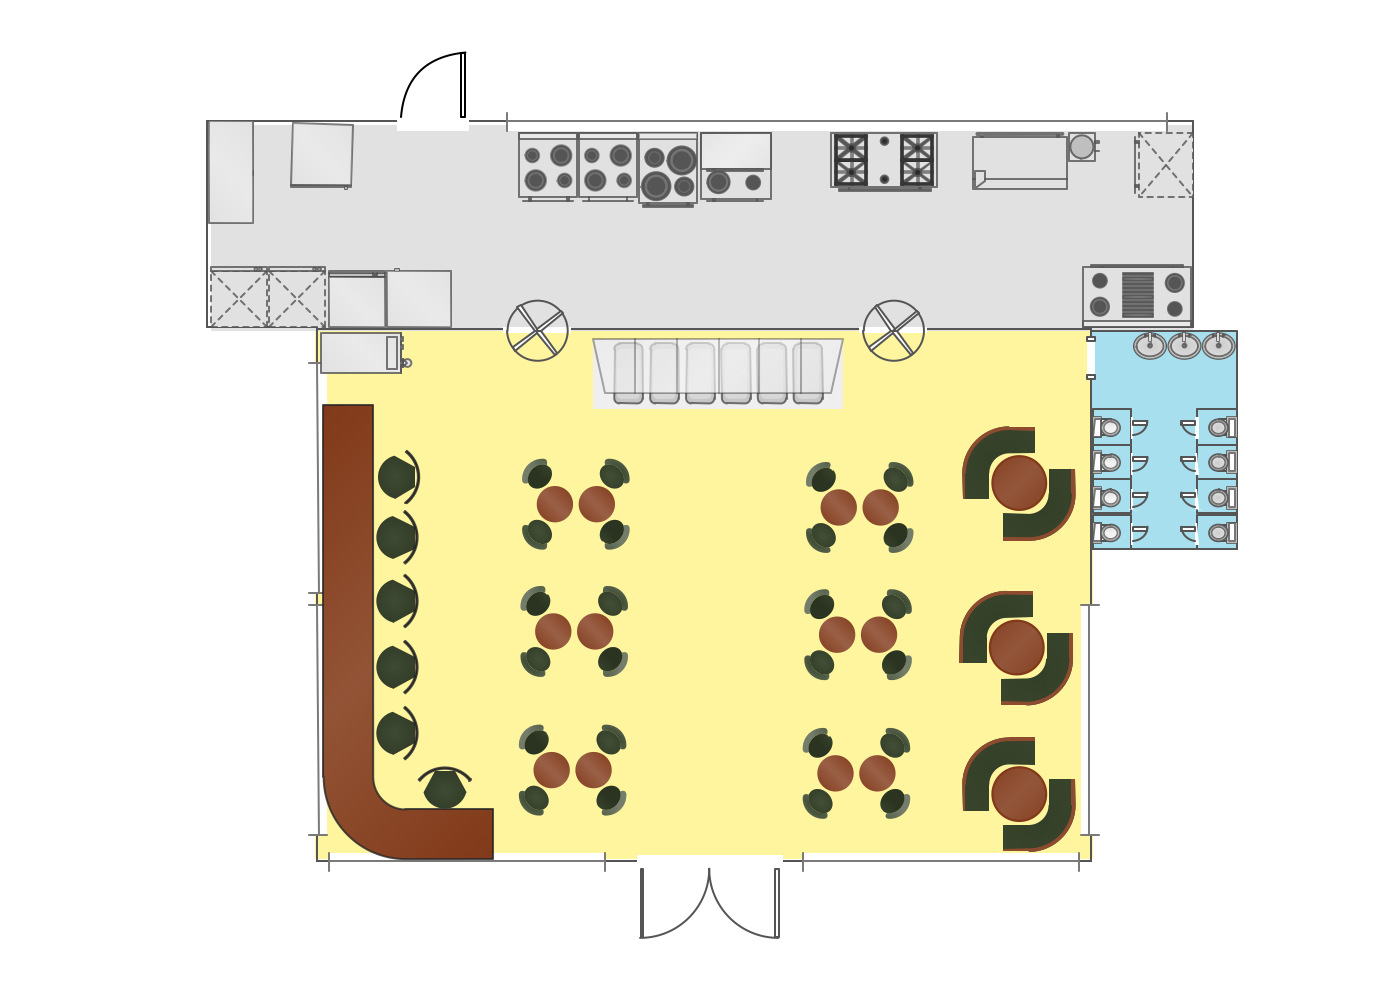
Picture: Interior Design
Related Solution:
While creating flowcharts and process flow diagrams, you should use special objects to define different statements, so anyone aware of flowcharts can get your scheme right. There is a short and an extended list of basic flowchart symbols and their meaning. Basic flowchart symbols include terminator objects, rectangles for describing steps of a process, diamonds representing appearing conditions and questions and parallelograms to show incoming data.
This diagram gives a general review of the standard symbols that are used when creating flowcharts and process flow diagrams. The practice of using a set of standard flowchart symbols was admitted in order to make flowcharts and other process flow diagrams created by any person properly understandable by other people. The flowchart symbols depict different kinds of actions and phases in a process. The sequence of the actions, and the relationships between them are shown by special lines and arrows. There are a large number of flowchart symbols. Which of them can be used in the particular diagram depends on its type. For instance, some symbols used in data flow diagrams usually are not used in the process flowcharts. Business process system use exactly these flowchart symbols.
Picture: Flowchart Symbols: Meaning and Examples
Related Solution:
To draw an effective workflow you have to have an ability to focus on thinking, not drawing. This becomes possible with ConceptDraw DIAGRAM software. Thanks to Arrows10 technology, you are able to place steps and relations onto your workflow diagram without thinking of how to do this, or which stencil to use. This is the most natural and effective way of drawing workflows.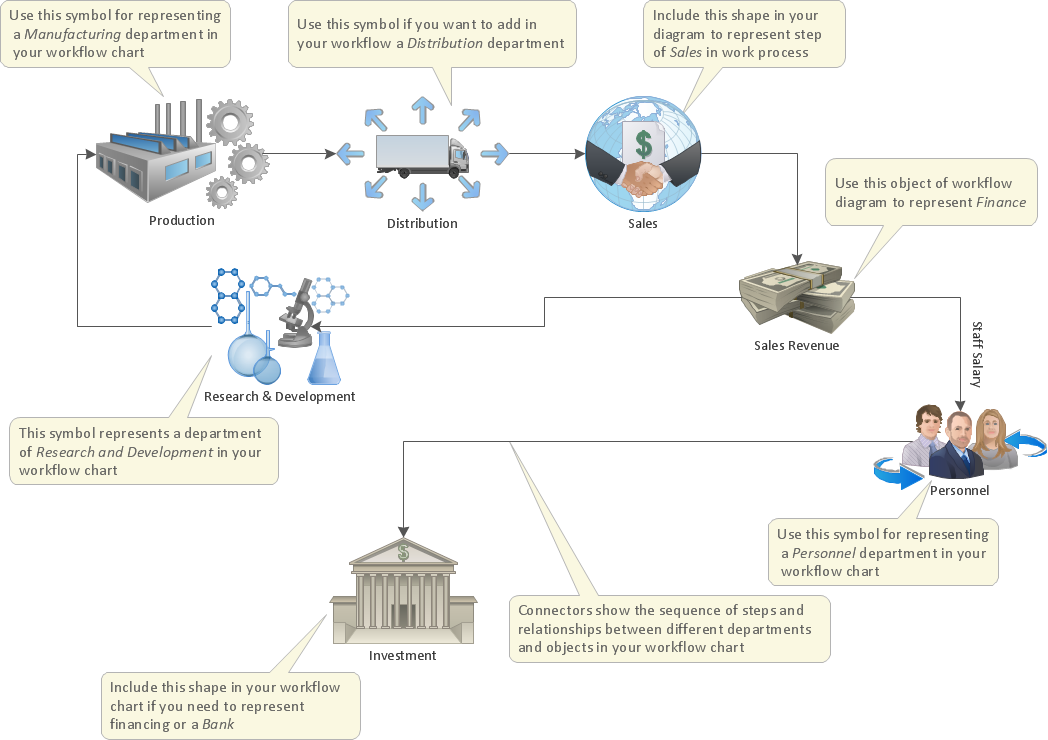
Picture: How to Draw an Effective Workflow
Related Solution:
An example flowchart of marketing analysis shows main steps you have to challenge writing a marketing analysis.
Picture: Flowchart Example: Flow Chart of Marketing Analysis
Related Solution:
Developing a software project supposes architecture first. To make it proper, you can use data flow diagram model in your current project.
The data flow diagram represents the Model of small traditional production enterprise that is made using Yourdon and Coad notation. It shows how the data is transfered through a process. According to the notation of Yourdon and Coad a process is represented by circles and data stores are drawn using parallel lines. This DFD was created using the ConceptDraw Data Flow Diagrams solution. Using this solution one can visualize data flow accordingly to the rules of two basic notations used for data flow modeling.
Picture: Data Flow Diagram Model
Related Solution:
ConceptDraw DIAGRAM diagramming and vector drawing software extended with Sales Flowcharts solution from the Marketing area of ConceptDraw Solution Park offers the set of extensive tools for quick and easy drawing professional looking Sales Process Flowcharts.
Picture: Sales Process Flowcharts
Related Solution:
There are numerous articles about the advantages of flowcharting, creating business graphics and developing different charts. Nevertheless, these articles are almost useless without the main component - the examples of flowcharts, org charts and without a fine example, it is difficult to get all the conveniences of creating diagrams. You can find tons of templates and vivid examples on Solution Park.
This illustration shows a variety of business diagrams that can be created using ConceptDraw DIAGRAM. It comprises a different fields of business activities: management, marketing, networking, software and database development along with design of infographics and business illustrations. ConceptDraw DIAGRAM provides a huge set of sample drawings including business process modeling diagrams,, network diagrams, UML diagrams, orgcharts, DFD, flowcharts, ERD, geographical maps and more.
Picture: Examples of Flowcharts, Org Charts and More
Related Solution:
Venn diagrams are illustrations used in the branch of mathematics known as set theory.
Use ConceptDraw DIAGRAM to quick and easy design your own Venn Diagram of any complexity.
Picture: Venn Diagram
Related Solution: