
Pic. 2. Papua New Guinea
Geo Map - Asia - Papua New Guinea Contour
Capital - Port Moresby

Pic. 3. Papua New Guinea Contour
Geo Map - Asia
Asia contains 48 countries(UN members) and 6 other states.
Area 44,579,000 km2 (17,212,000 sq mi). Population 4,164,252,000.

Pic. 4. Asia Map
Geo Map - Asia Contour
A contour map is a map illustrated with contour lines.

Pic. 5. Asia Contour
Geo Map - contours of Asia countries
Use the map contours library "Asia" to design thematic maps using the ConceptDraw DIAGRAM diagramming and vector drawing software.
The vector stencils library "Asia" contains 57 map contours: Asia political map, map contours of countries.

Pic. 6. Contours of Asia countries
All ConceptDraw DIAGRAM documents are vector graphic files and are available for reviewing, modifying, and converting to a variety of formats: image, HTML, PDF file, MS PowerPoint Presentation, Adobe Flash, MS Visio (.VDX, .VSDX).
See also Geo Maps of Asia Countries :
TEN RELATED HOW TO's:
Laos, officially the Lao People's Democratic Republic, is a landlocked country in Southeast Asia, bordered by Burma and China to the northwest, Vietnam to the east, Cambodia to the south, and Thailand to the west.
The vector stencils library Laos contains contours for ConceptDraw DIAGRAM diagramming and vector drawing software. This library is contained in the Continent Maps solution from Maps area of ConceptDraw Solution Park.
Picture: Geo Map - Asia - Laos
Related Solution:
Process Flow Chart is a visual illustration of overall flow of activities in producing a product or service. How do you make a Process Flow Chart usually? Drawing process flow charts, diagrams and maps is quite complex and lengthy process, especially if you draw free-hand. But now thanks to the ConceptDraw DIAGRAM diagramming and vector drawing software extended with Flowcharts solution from the Diagrams area of ConceptDraw Solution Park this process became simple and fast. A confirmation of this can serve many Process Flow Chart examples included in Flowcharts solution.
Picture: Process Flow Chart Examples
Related Solution:
This sample was created in ConceptDraw DIAGRAM diagramming and vector drawing software using the Flowcharts solution from the Diagrams area of ConceptDraw Solution Park.
This sample shows the Flowchart that displays the procedures of 2PP (two-party preferred) voting and counting the voters. The two-party-preferred vote is the result of the elections that was distributed to the final two parties.
Picture: Basic Flowchart Images. Flowchart Examples
Related Solution:
Turkey, officially the Republic of Turkey, is a contiguous transcontinental country, located mostly on Anatolia in Western Asia, and on East Thrace in Southeastern Europe.
The vector stencils library Turkey contains contours for ConceptDraw DIAGRAM diagramming and vector drawing software. This library is contained in the Continent Maps solution from Maps area of ConceptDraw Solution Park.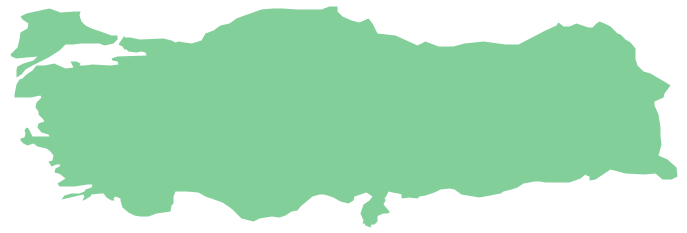
Picture: Geo Map - Asia - Turkey
Related Solution:
Georgia is a country in the Caucasus region of Eurasia.
The vector stencils library Georgia contains contours for ConceptDraw DIAGRAM diagramming and vector drawing software. This library is contained in the Continent Maps solution from Maps area of ConceptDraw Solution Park.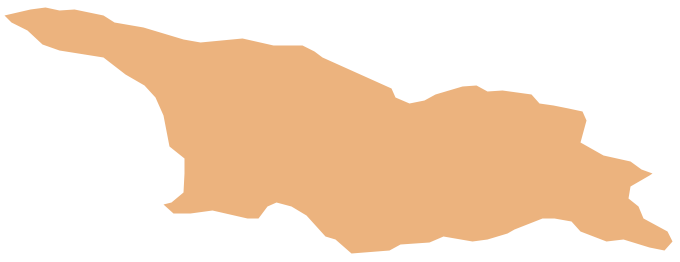
Picture: Geo Map - Asia - Georgia
Related Solution:
Mongolia is a landlocked country in Central Asia.
The vector stencils library Mongolia contains contours for ConceptDraw DIAGRAM diagramming and vector drawing software. This library is contained in the Continent Maps solution from Maps area of ConceptDraw Solution Park.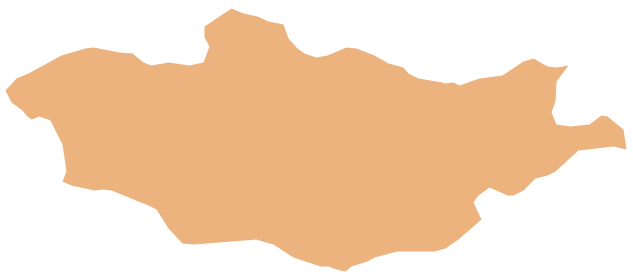
Picture: Geo Map - Asia - Mongolia
Related Solution:
These libraries of vector objects depict the Site Accessories and Parking and Roads elements. They are needed to draw architectural and landscape plans that show the architectural elements around buildings: parking spaces, hiking and biking trails, drainage systems, lights, and vehicle access control elements. These libraries are included into ConcepDraw solution for Site Planning. Site Accessories and Parking, Roads libraries contain near 40 vector images that will help depict an a surrounding territory at building plans.
These libraries of vector objects depict the Site Accessories and Parking and Roads elements. They are needed to draw architectural and landscape plans that show the architectural elements around buildings: parking spaces, hiking and biking trails, drainage systems, lights, and vehicle access control elements. These libraries are included into ConcepDraw solution for Site Planning. Site Accessories and Parking, Roads libraries contain near 40 vector images that will help depict an a surrounding territory at building plans.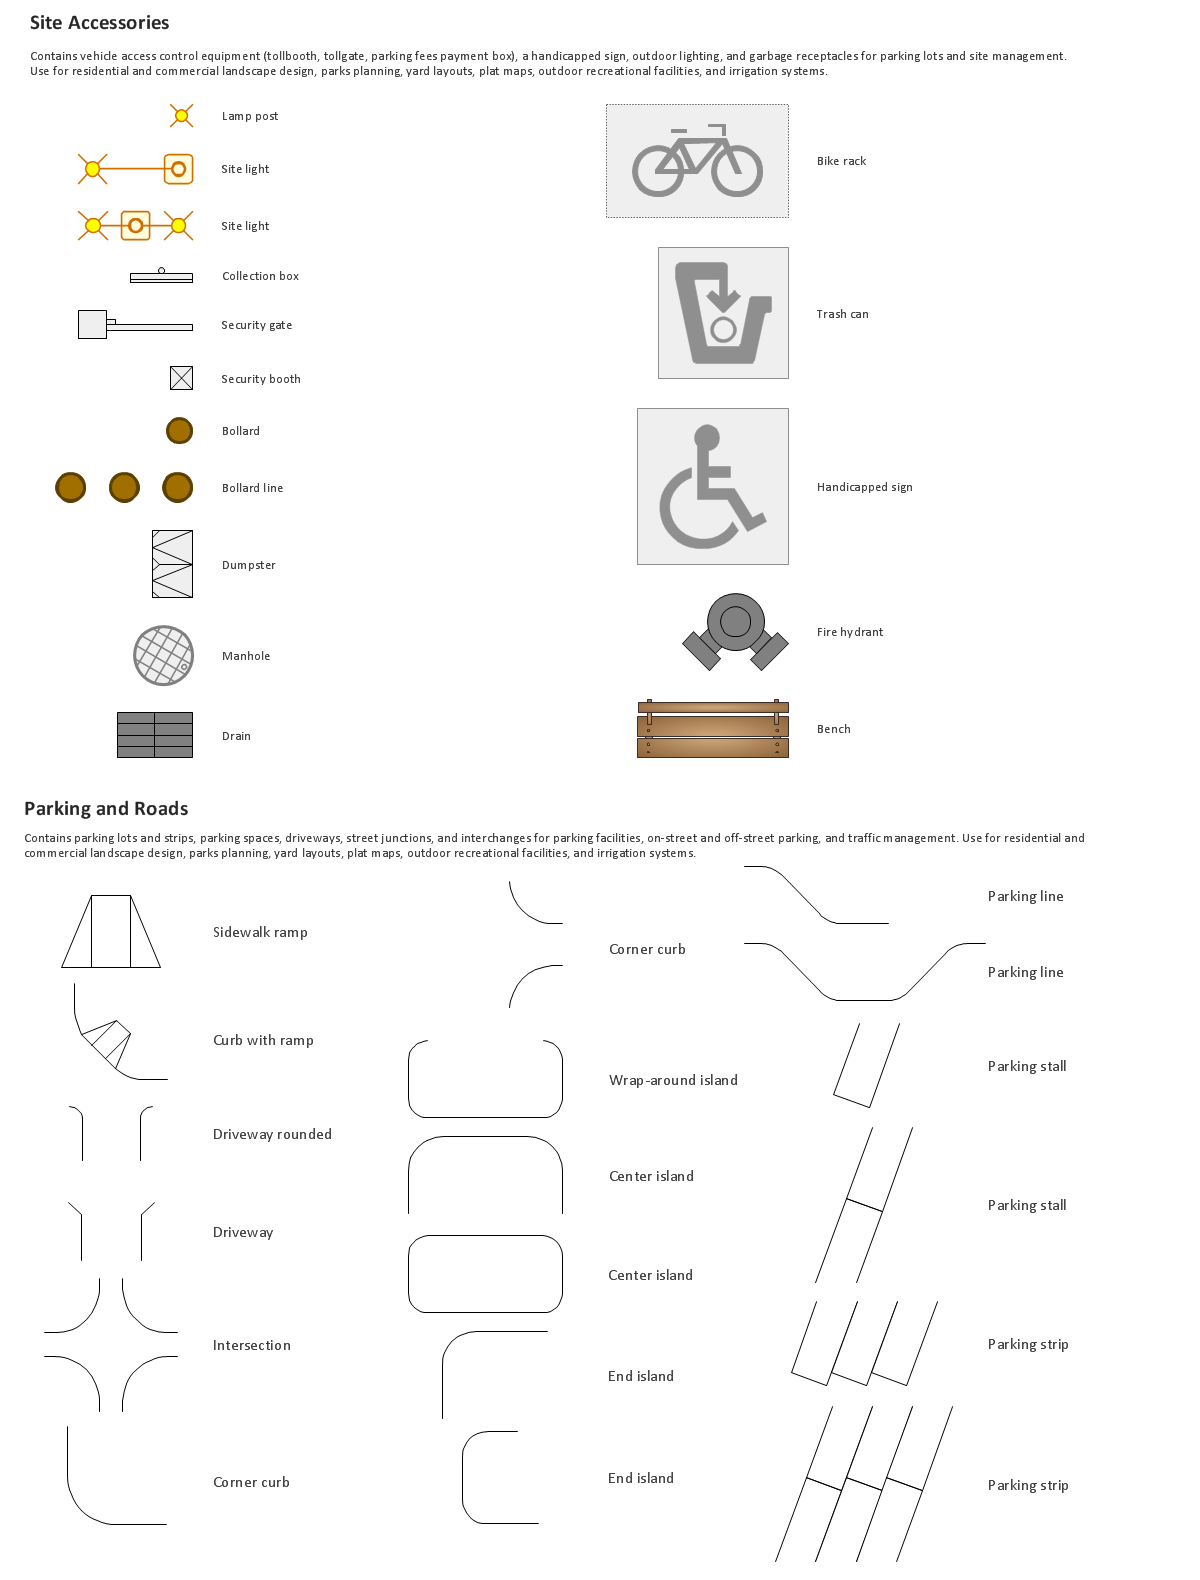
Picture: Building Drawing. Design Element Site Plan
Related Solution:
Uruguay, officially the Oriental Republic of Uruguay or the Eastern Republic of Uruguay or the Republic East of the Uruguay (River), is a country in the southeastern region of South America.
The vector stencils library Uruguay contains contours for ConceptDraw DIAGRAM diagramming and vector drawing software. This library is contained in the Continent Maps solution from Maps area of ConceptDraw Solution Park.
Picture: Geo Map - South America - Uruguay
Related Solution:
Syria, officially the Syrian Arab Republic, is a country in Western Asia, bordering Lebanon and the Mediterranean Sea to the west, Turkey to the north, Iraq to the east, Jordan to the south and Israel to the southwest.
The vector stencils library Syria contains contours for ConceptDraw DIAGRAM diagramming and vector drawing software. This library is contained in the Continent Maps solution from Maps area of ConceptDraw Solution Park.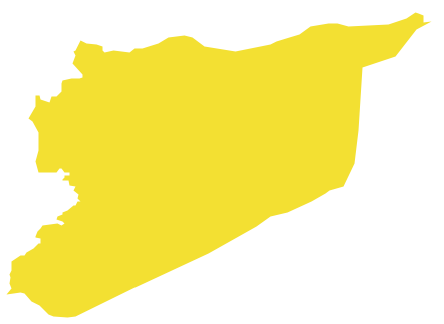
Picture: Geo Map - Asia - Syria
Related Solution:
Victoria (abbreviated as Vic.) is a state in the south-east of Australia. Victoria is Australia's most densely populated state and its second-most populous state overall.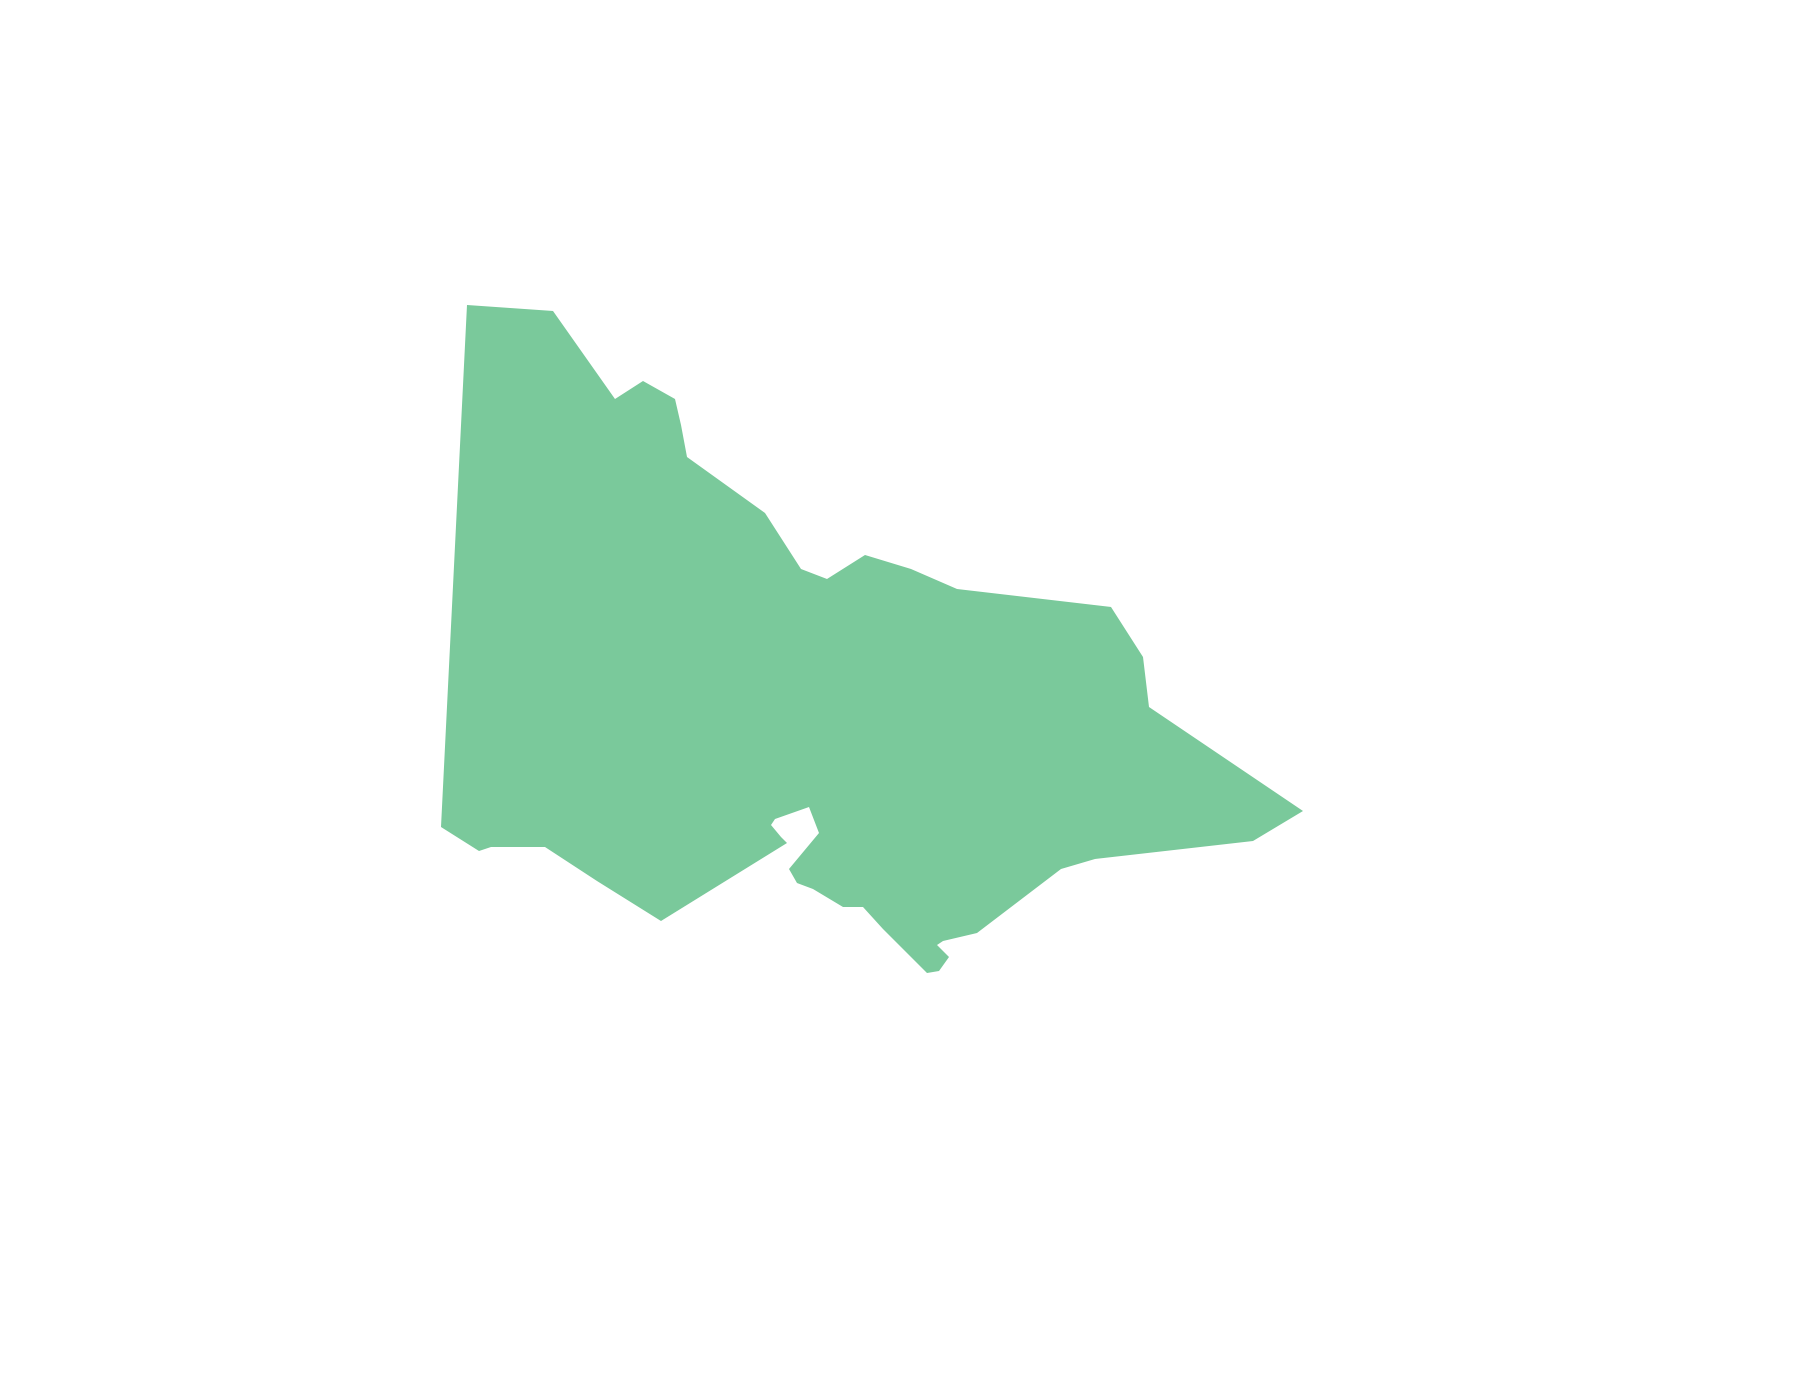
Picture: Geo Map - Australia - Victoria
Related Solution:


