Geo Map - Asia - South Korea
Maps of Asia - Republic of Korea
"South Korea, officially the Republic of Korea, is a country in East Asia, constituting the southern part of the Korean Peninsula. The name Korea is derived from Goryeo, a dynasty which ruled in the Middle Ages. It shares land borders with North Korea to the north, and oversea borders with China to the west and Japan to the east. South Korea lies in the north temperate zone with a predominantly mountainous terrain. It comprises an estimated 50 million residents distributed over 99,392 km2 (38,375 sq mi). The capital and largest city is Seoul, with a population of 10 million."
The vector stencils library South Korea contains contours for ConceptDraw DIAGRAM diagramming and vector drawing software. This library is contained in the Continent Maps solution from Maps area of ConceptDraw Solution Park.

Pic. 1. Continent Maps Solution
Use the South Korea library to draw thematic maps, geospatial infographics and vector illustrations for your business documents, presentations and websites.
Geo Map - Asia - Republic of Korea
South Korea has a population of over 51.5 million and an area 100,210 km2(38,691 sq mi).
Pic. 2. South Korea
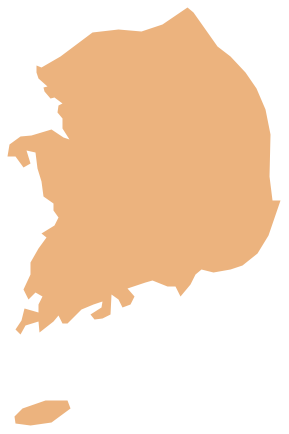
Geo Map - Asia - South Korea Contour
Capital - Seoul

Pic. 3. South Korea Contour
Geo Map - Asia
Asia contains 48 countries(UN members) and 6 other states.
Area 44,579,000 km2 (17,212,000 sq mi). Population 4,164,252,000.

Pic. 4. Asia Map
Geo Map - Asia Contour
A contour map is a map illustrated with contour lines.

Pic. 5. Asia Contour
Geo Map - contours of Asia countries
Use the map contours library "Asia" to design thematic maps using the ConceptDraw DIAGRAM diagramming and vector drawing software.
The vector stencils library "Asia" contains 57 map contours: Asia political map, map contours of countries.

Pic. 6. Contours of Asia countries
All ConceptDraw DIAGRAM documents are vector graphic files and are available for reviewing, modifying, and converting to a variety of formats: image, HTML, PDF file, MS PowerPoint Presentation, Adobe Flash, MS Visio (.VDX, .VSDX).
See also Geo Maps of Asia Countries :
- Afghanistan
- Armenia
- Azerbaijan
- Bahrain
- Bangladesh
- Bhutan
- Brunei
- Cambodia
- China
- Cyprus
- Georgia
- India
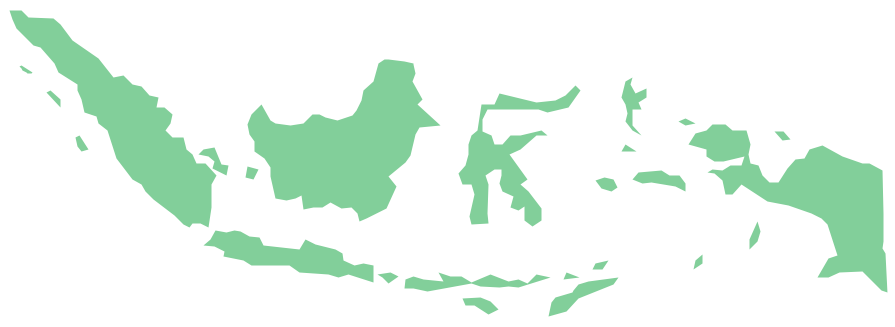
- Indonesia
- Iran
- Iraq
- Israel
- Japan
- Jordan
- Kazakhstan
- Kuwait
- Kyrgyzstan
- Laos
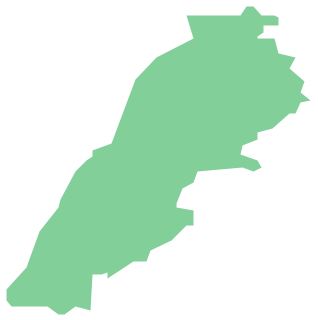
- Lebanon
- Malaysia
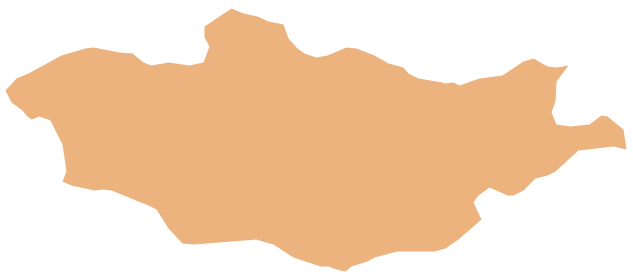
- Mongolia
- Myanmar
- Nepal
- North Korea
- Oman
- Pakistan
- Papua New Guinea
- Philippines
- Qatar
- Saudi Arabia
- Singapore
- South Korea
- Sri Lanka
- Syria
- Tajikistan
- Thailand
- Turkey
- Turkmenistan
- United Arab Emirates
- Uzbekistan
- Vietnam
- Yemen