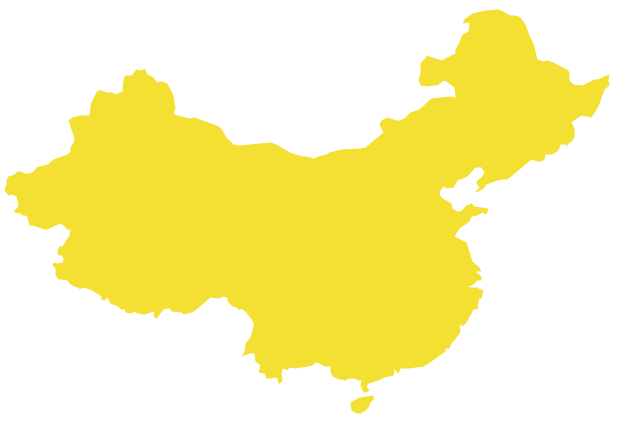
Geo Map - Asia - China
Maps of Asia - People's Republic of China
"China, officially the People's Republic of China, is a sovereign state located in East Asia. It is the world's most populous country, with a population of over 1.35 billion. The PRC is a single-party state governed by the Communist Party, with its seat of government in the capital city of Beijing. It exercises jurisdiction over 22 provinces, five autonomous regions, four direct-controlled municipalities (Beijing, Tianjin, Shanghai, and Chongqing), and two mostly self-governing special administrative regions (Hong Kong and Macau). The PRC also claims Taiwan – which is controlled by the Republic of China (ROC), a separate political entity – as its 23rd province, a claim which is controversial due to the complex political status of Taiwan." [China. Wikipedia]
The vector stencils library China contains contours for ConceptDraw DIAGRAM diagramming and vector drawing software. This library is contained in the Continent Maps solution from Maps area of ConceptDraw Solution Park.

Use the China library to draw thematic maps, geospatial infographics and vector illustrations for your business documents, presentations and websites.
Geo Map - Asia - People's Republic of China
Geo Map - Asia - China Contour

Geo Map - Asia

Geo Map - Asia Contour

Geo Map - contours of Asia countries

See also Geo Maps of Asia Countries :
TEN RELATED HOW TO's:
Guyana, officially the Co-operative Republic of Guyana, is a sovereign state on the northern coast of South America.
The vector stencils library Guyana contains contours for ConceptDraw DIAGRAM diagramming and vector drawing software. This library is contained in the Continent Maps solution from Maps area of ConceptDraw Solution Park.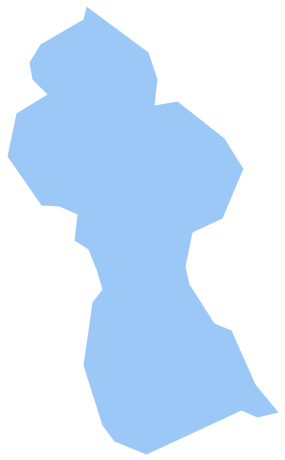
Picture: Geo Map - South America - Guyana
Related Solution:
For depicting the onion model are actively used Stakeholder Onion Diagrams. The ConceptDraw DIAGRAM diagramming and vector drawing software extended with Stakeholder Onion Diagrams Solution from the Management Area of ConceptDraw Solution Park offers the number of useful tools and Stakeholder Onion Diagram template for their easy design.
Picture: Stakeholder Onion Diagram Template
Related Solution:
ConceptDraw DIAGRAM is idea to draw the geological maps of World from the pre-designed vector geo map shapes.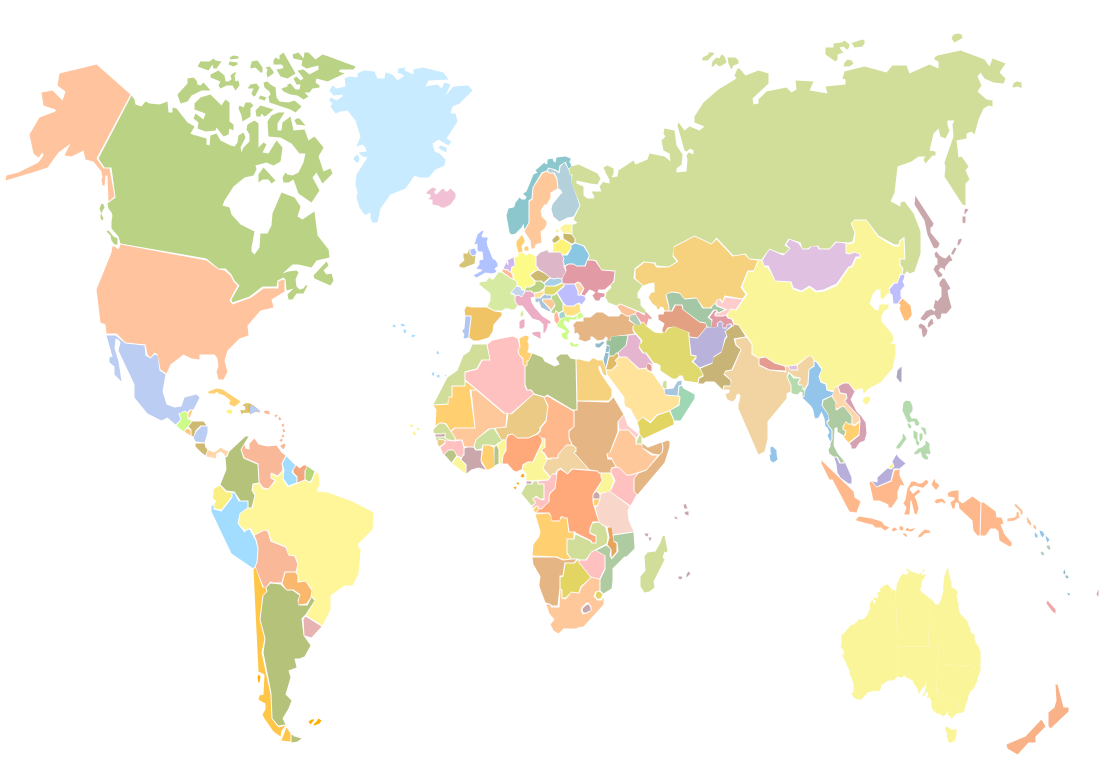
Picture: Geo Map - World
Related Solution:
Iran, also known as Persia, officially the Islamic Republic of Iran since 1980, is a country in Western Asia.
The vector stencils library Iran contains contours for ConceptDraw DIAGRAM diagramming and vector drawing software. This library is contained in the Continent Maps solution from Maps area of ConceptDraw Solution Park.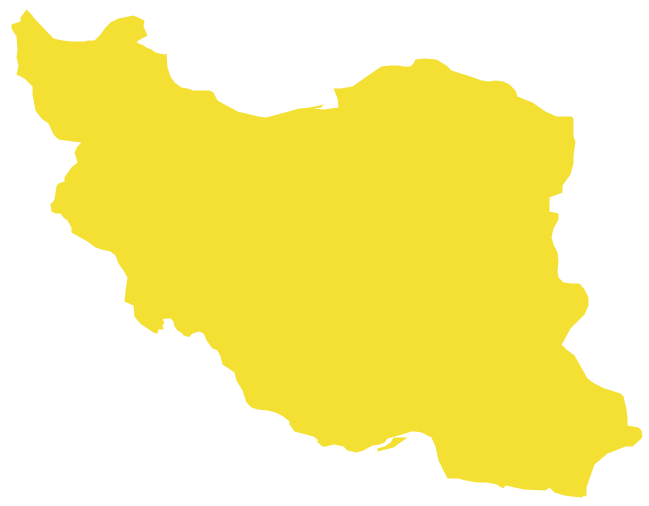
Picture: Geo Map - Asia - Iran
Related Solution:
There are many ways to define the flow of information within a system. Structured-systems analysis method often uses data flow diagrams to show data flow, data storages and data processing visualization. These diagrams are easy to develop and quite useful.
Here is a dataflow diagram presenting an example of the manufacturing process flow. The oval process shapes represent a process that controls data within the current system. The process may produce data or make some action based on data. Data flows are represented by lines. They show the movement of information through the system. The direction of the data flow is depicted by the arrow. The external entities are shown by rectangles. They represent the external entities interacting with the system. The data store objects (unclosed rectangles) are used to show data bases participating in a process flow.
Picture: Data Flow Diagram
Related Solution:
VSM symbols are the best for a production process designing. The entire Value Stream Mapping method uses a graphical representation of the manufacturing process, factors' pros and cons, that all stakeholders can easily understand. Value Stream Mapping is a graphical technique that provides possibilities to improve analysis of a manufacturing process, at the stage of the transferring information or materials that required to deliver a product or service to the customer.
Picture: Value Stream Mapping Symbols
Related Solution:
If you need to pull together a quick marketing drawing, you'll find elements, samples, templates and libraries with vector clip art for drawing the Marketing Illustrations.
These symbols and signs you can use in your design for Strategic Marketing, Graphic Design, Inbound and Content Marketing, Social Media, Lead Generation, Email Marketing and Automation, CRM implementation and Integration and more.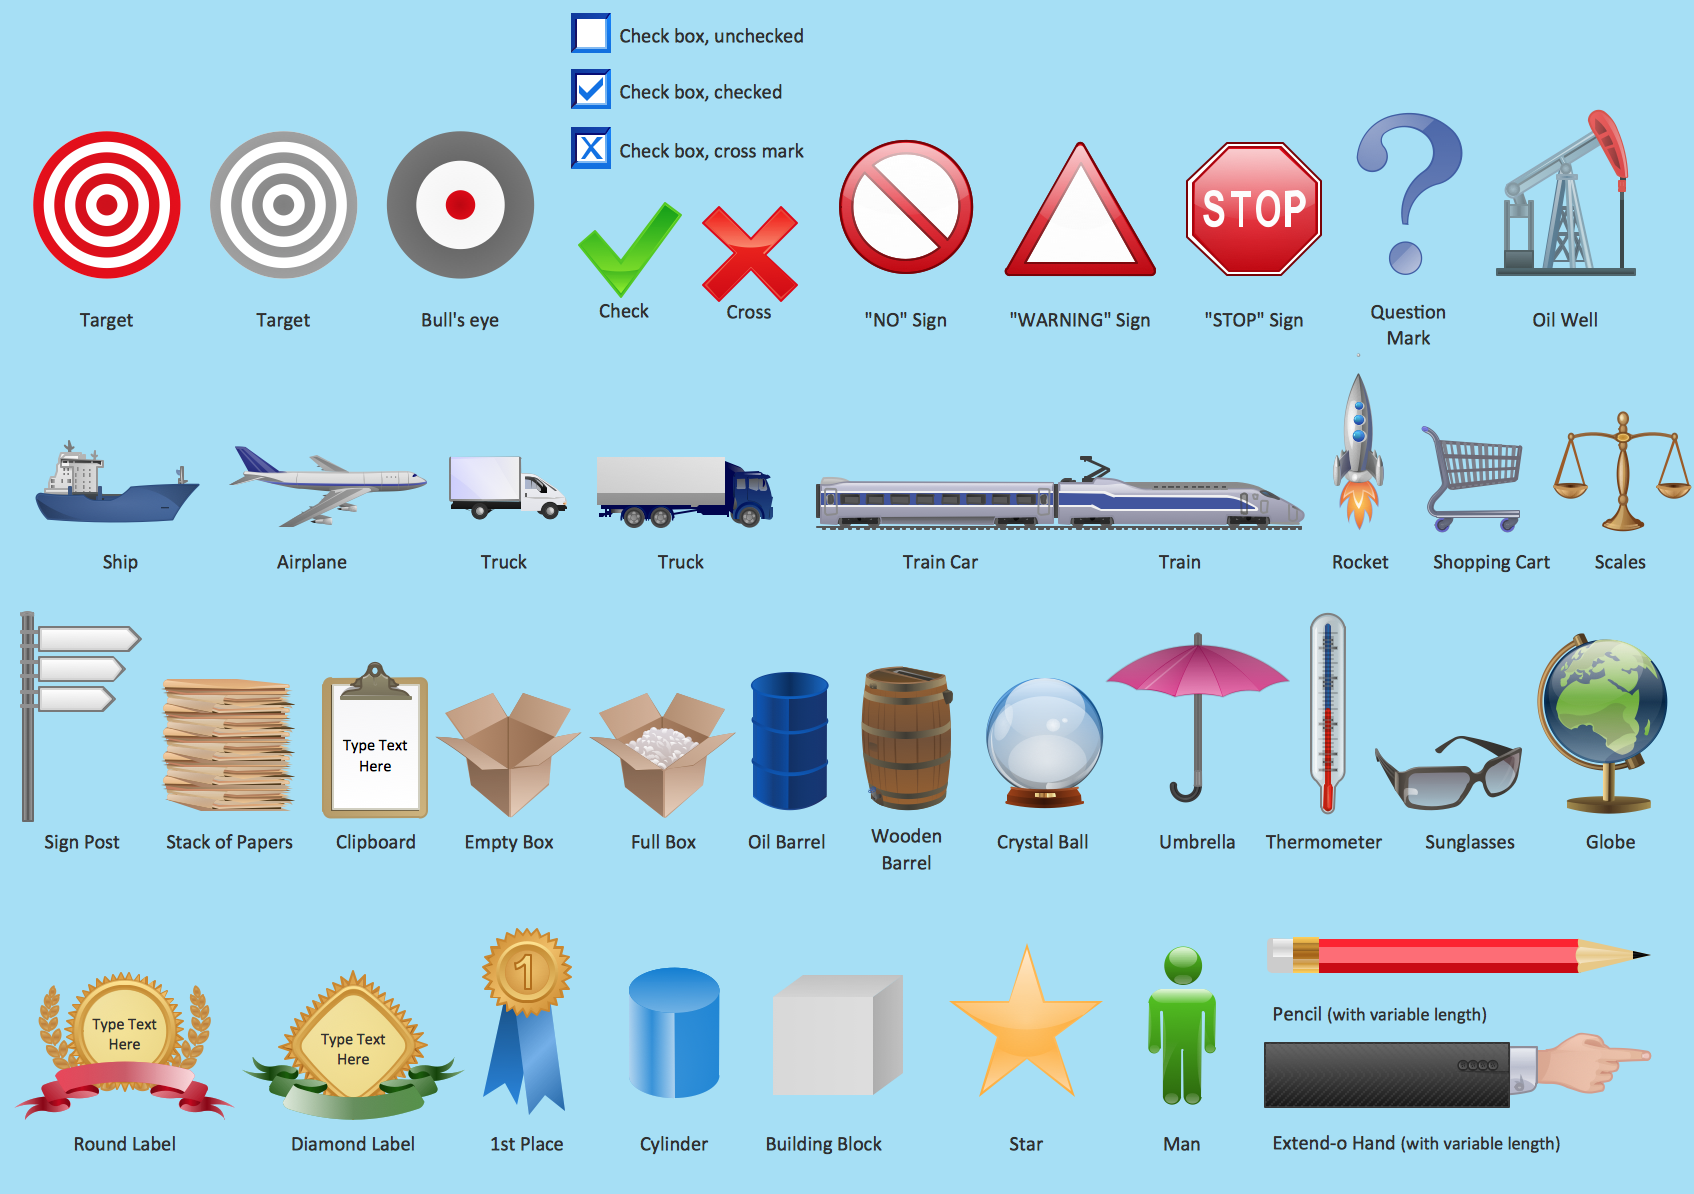
Picture: Marketing - Design Elements
Related Solution:
Acquaintance with flowcharting starts from getting into basic terms. First of all, flowchart definition is quite clear – a flowchart is a graphical representation of a process or an algorithm made of special symbols. Secondly, flowcharting is an irreplaceable tool for IT specialists, project managers, and anyone who wants a clear understanding of any imaginable process.
Picture: Flowchart Definition: A Complete Guide
Related Solution:
Georgia is a state located in the southeastern United States.
The vector stencils library Georgia contains contours for ConceptDraw DIAGRAM diagramming and vector drawing software. This library is contained in the Continent Maps solution from Maps area of ConceptDraw Solution Park.
Picture: Geo Map — USA — Georgia
Related Solution:
The vector stencils library Switzerland contains contours for ConceptDraw DIAGRAM diagramming and vector drawing software. This library is contained in the Continent Maps solution from Maps area of ConceptDraw Solution Park.
Picture: Geo Map - Europe - Switzerland
Related Solution:


