_Win_Mac.png)
Example 1. Entity Relationship Diagram Software
Design Elements — Chen (Windows, Macintosh).
Entity-Relationship Diagram (ERD) solution offers the ERD Chen's Notation library with variety of ERD symbols for Chen notation. Simply drag the predesigned ERD objects from the library, arrange them, type the text and title to get the excellent result – your own ER Diagram in minutes. It’s a fastest way of drawing, and the most important – you don’t need to be the painter for this.

Example 2. Entity-Relationship Diagram Solution in ConceptDraw STORE
You can also use the ready samples or templates offered by Entity-Relationship Diagram (ERD) solution in ConceptDraw STORE as the base for your own diagrams.

Example 3. ER Diagram, Chen Notation
The samples you see on this page were created in ConceptDraw DIAGRAM software in Mac OS X and Windows using the Entity-Relationship Diagram (ERD) solution and show the ER Diagrams created with Chen notation. An experienced user spent 10 minutes creating these samples.
Use the Entity-Relationship Diagram (ERD) Solution for ConceptDraw DIAGRAM to create quick and easy your own Entity-Relationship Diagrams using the Chen and Crow's Foot notations.
All source documents are vector graphic documents. They are available for reviewing, modifying, or converting to a variety of formats (PDF file, MS PowerPoint, MS Visio, and many other graphic formats) from the ConceptDraw STORE. The Entity-Relationship Diagram (ERD) Solution is available for all ConceptDraw DIAGRAM or later users.
TEN RELATED HOW TO's:
Samples, templates and libraries contain vector clip art for drawing the Road Transport Illustrations.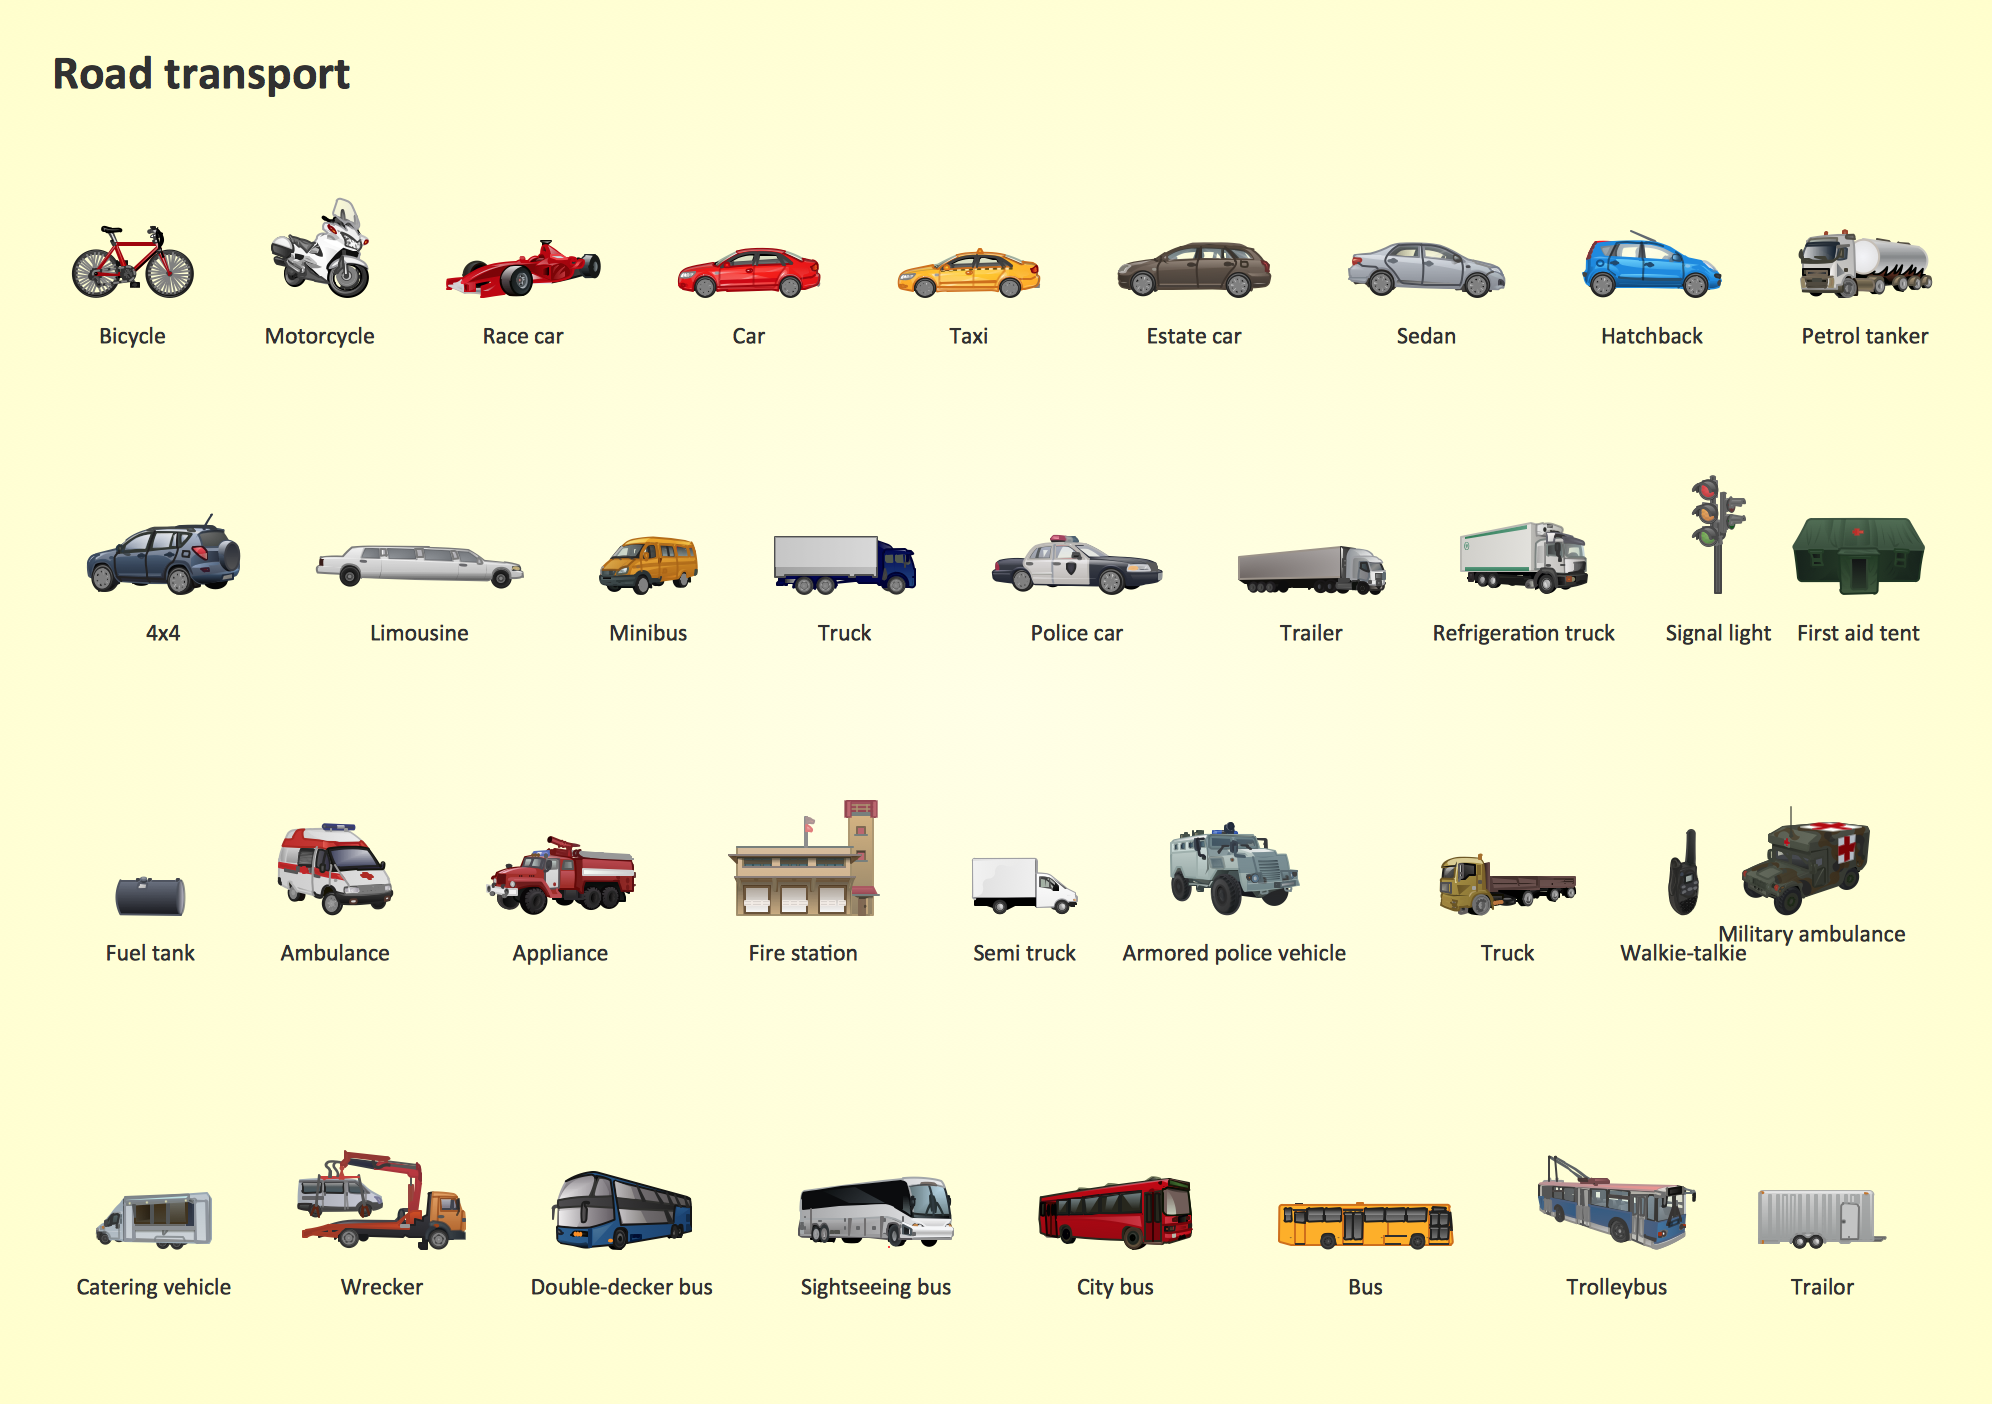
Picture: Road Transport - Design Elements
Related Solution:
Data structure diagram (DSD) is intended for description of conceptual models of data (concepts and connections between them) in the graphic format for more obviousness. Data structure diagram includes entities description, connections between them and obligatory conditions and requirements which connect them. Create Data structure diagram with ConceptDraw DIAGRAM.
Picture: Data structure diagram with ConceptDraw DIAGRAM
ConceptDraw helps you to start designing your own UML Collaboration Diagrams with examples and templates.
Picture: Diagramming Software for Design UML Collaboration Diagrams
While creating flowcharts and process flow diagrams, you should use special objects to define different statements, so anyone aware of flowcharts can get your scheme right. There is a short and an extended list of basic flowchart symbols and their meaning. Basic flowchart symbols include terminator objects, rectangles for describing steps of a process, diamonds representing appearing conditions and questions and parallelograms to show incoming data.
This diagram gives a general review of the standard symbols that are used when creating flowcharts and process flow diagrams. The practice of using a set of standard flowchart symbols was admitted in order to make flowcharts and other process flow diagrams created by any person properly understandable by other people. The flowchart symbols depict different kinds of actions and phases in a process. The sequence of the actions, and the relationships between them are shown by special lines and arrows. There are a large number of flowchart symbols. Which of them can be used in the particular diagram depends on its type. For instance, some symbols used in data flow diagrams usually are not used in the process flowcharts. Business process system use exactly these flowchart symbols.
Picture: Flowchart Symbols: Meaning and Examples
Related Solution:
A network diagram represents the set of computers and network devices and the connections among them. This scheme can be developed for any institution or establishment. To illustrate this concept let’s take for example, a hotel network topology diagram or a school network diagram. These diagrams depict access points, servers, workstations, firewalls and another equipment needed to provide a network.
On this masterpiece drawing one will see a simple scheme a of connecting computers together. Such form of connecting can be applied for a hotel, guest house, bungalow, hut or something else. This diagram shows the images of the real LAN components. So, it represents a physical category of a network construction. It looks similar to a star - so this network configuration is named a star topology. The typical feature of this construction is a center point - usually it is hub, or router. The rays of this star means network connections. Computers, peripherals and other network details are placed on the ends of the star rays.
Picture: Hotel Network Topology Diagram
Related Solution:
ConceptDraw DIAGRAM diagramming and vector drawing software enhanced with Network Security Diagrams Solution from the Computer and Networks Area of ConceptDraw Solution Park is the best for effective design professional, colorful and attractive Network Security Diagram of any complexity and degree of detailing.
Picture: Network Security Diagram
Related Solution:
Designing landscapes nowadays doesn’t require any special skills. Therefore, it’s not rocket science how to use landscape design software and create detailed plans and projects. Special Landscape & Garden Solution from the Building Plans area of ConceptDraw Solution Park provides vivid ready-to-use vector objects of trees, bushes, fences, furniture etc.
Picture: How To use Landscape Design Software
Related Solution:
Use the ConceptDraw DIAGRAM software that has vector clipart of numerous cable connectors, examples, and templates for drawing different types of audio and video connection diagrams. Paste icon of the receiver or another device to page and layout sockets and plugs. Further connect plugs with each other, and now you have well-designed connection diagram.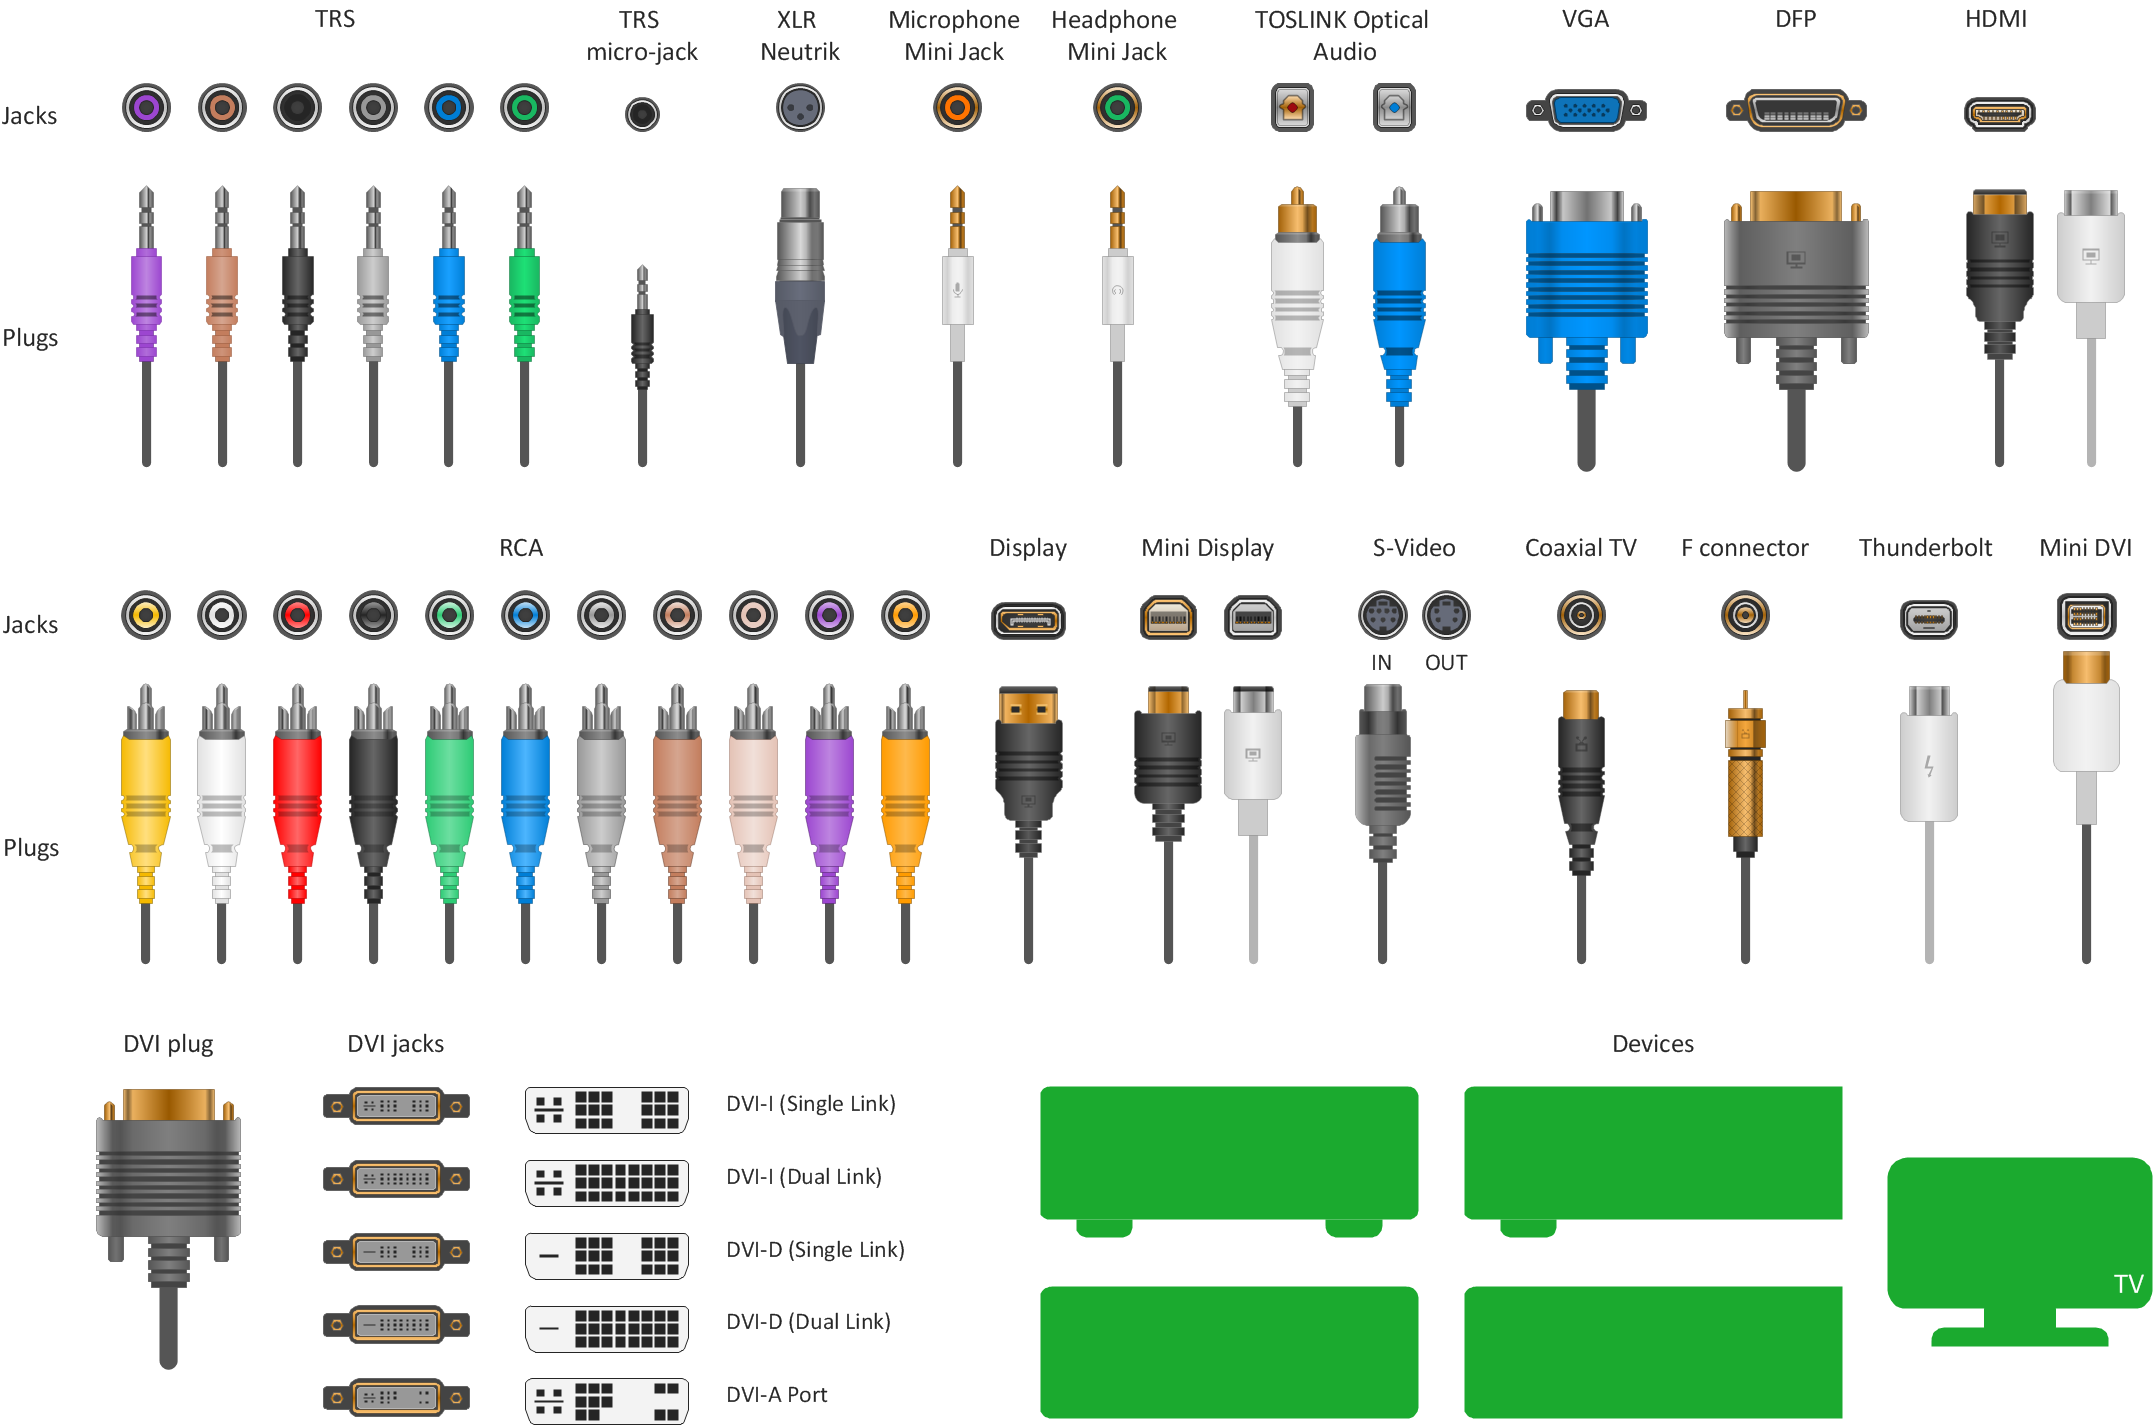
Picture: How to Make Audio and Video Connections
Related Solution:
Every corporate network is unique, though there are guidelines and best practices in developing networks. As it is quite difficult to implement a pure topology within a company, using a hybrid network topology is considered a better solution. As a rule, such network assembles advantages and features of source topologies.
This diagram is an example of the Hybrid network. This type of network topology means a conjunction of other network topologies. Such as star-bus, ring-mesh topologies, etc. It should be obviously diverse networks. The final computer network inherits both advantages and disadvantages of its ingredients. Using the ConceptDraw Computer and Networks solution including vector graphic libraries and templates one can develop professional custom network diagrams of any topology and complexity.
Picture: Hybrid Network Topology
Related Solution:
The vector stencils library Watercraft contains clipart of ships, boats, yachts, submarines for ConceptDraw DIAGRAM diagramming and vector drawing software.
Use it to draw illustrations of vessels and water transport over a sea, ocean, lake, canal, river.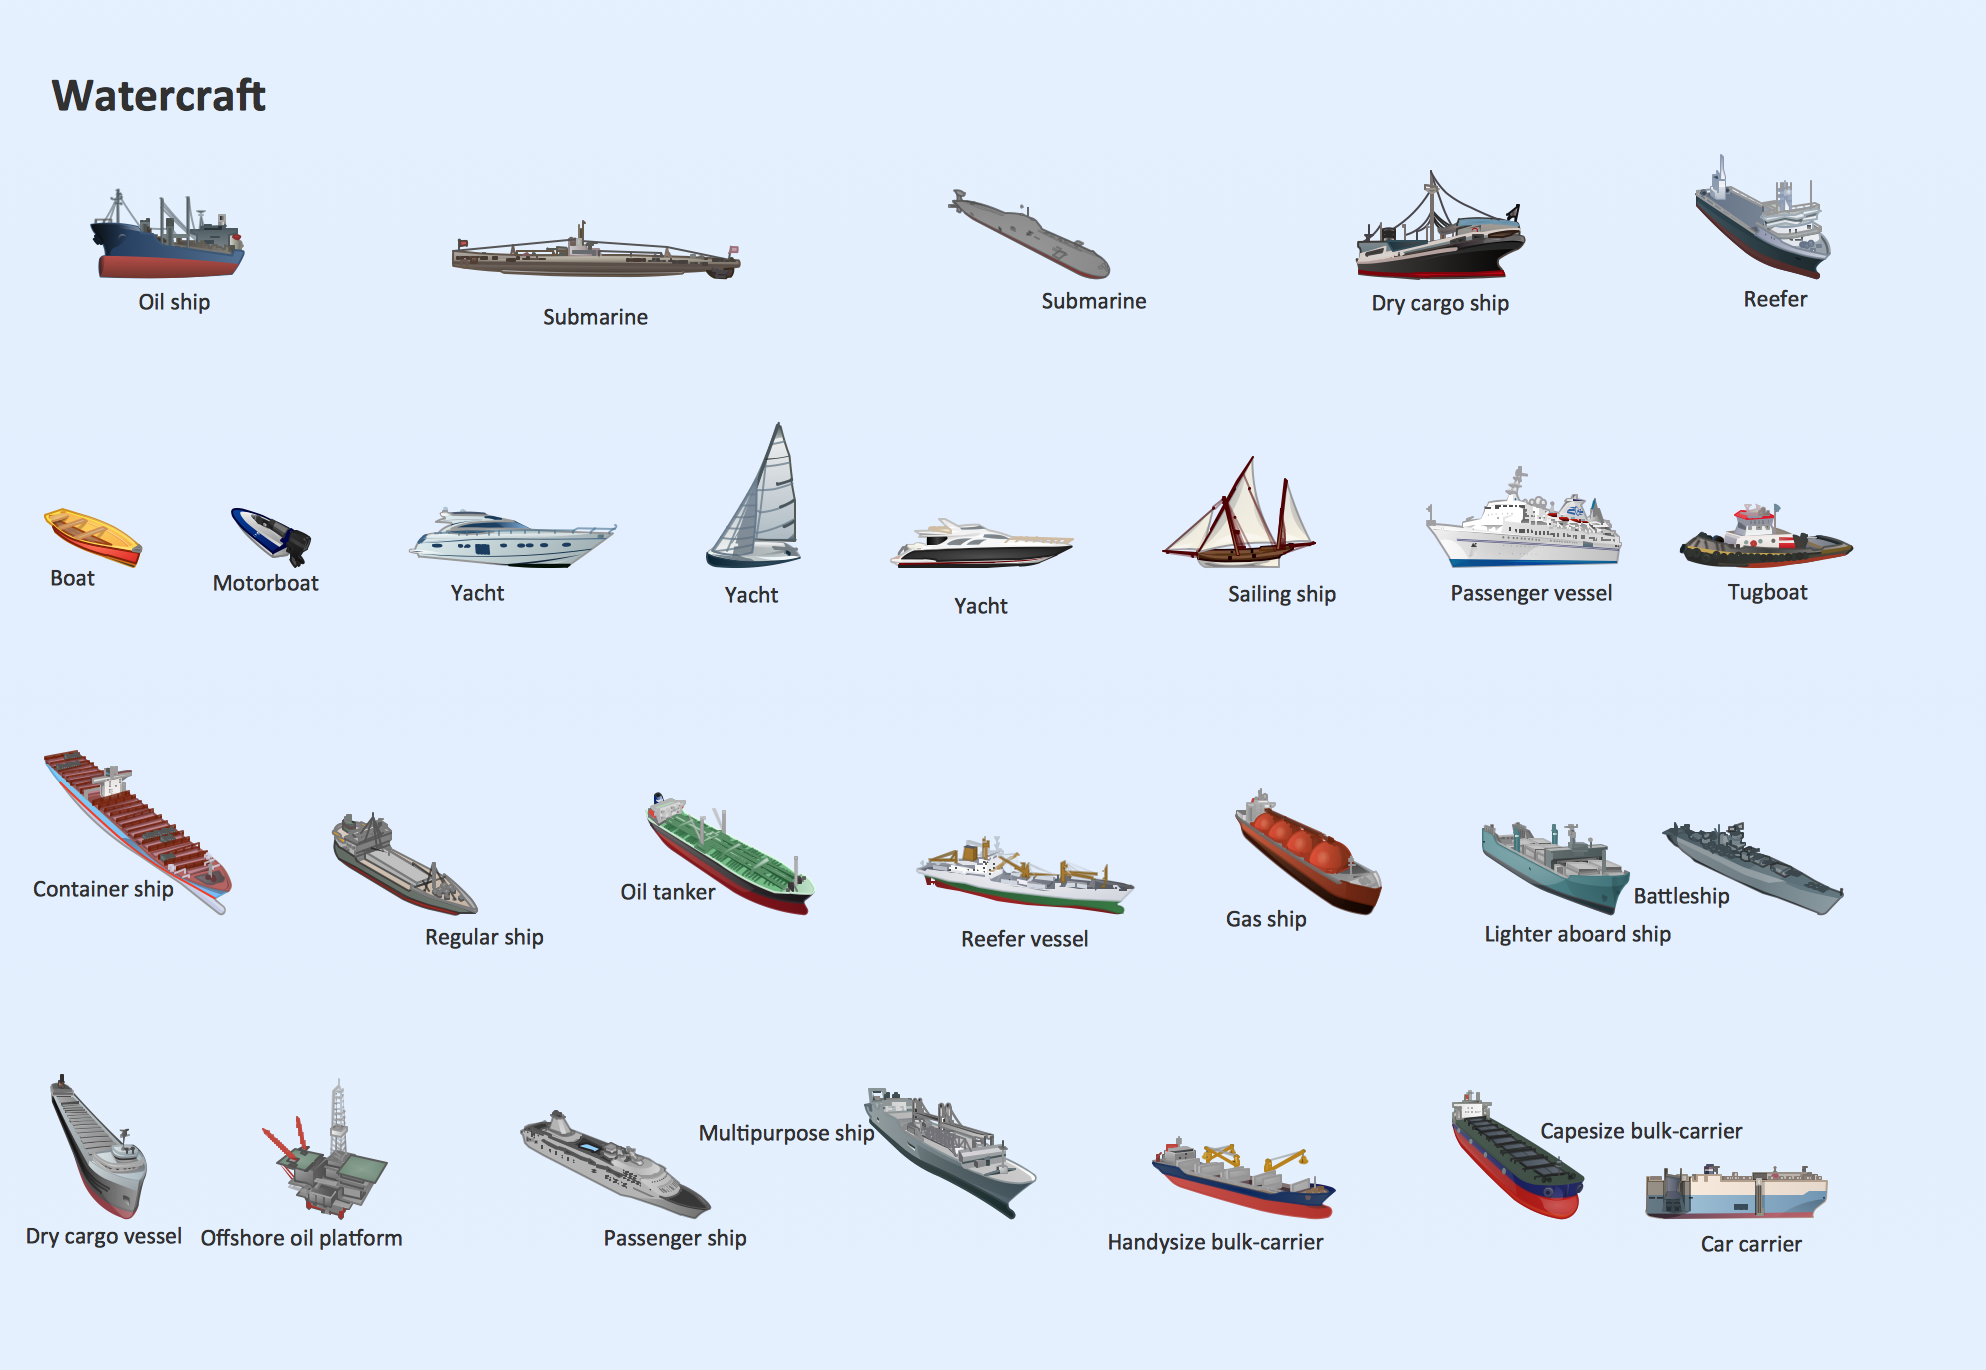
Picture: Watercraft - Design Elements
Related Solution:

