About UML
Unified Modeling Language (UML) is a language of graphic description for object modeling in the field of software engineering. UML was created for definition, visualization, designing of software systems. It was developed in the 1990s by Grady Booch, Ivar Jacobson and James Rumbaugh at Rational Software Corporation.
In 1997 was adopted the UML 1.1 version by the Object Management Group (OMG).
In 2000 the UML 1.4.2 version was accepted by the International Organization for Standardization (ISO) as an open standard ISO/IEC 19501:2005 that uses graphic notations for creating visual models of object-oriented software systems. UML took in the notations of the Object-modeling technique, Object-oriented software engineering and the Booch method. UML can be applied for all the processes of the development life cycle.
In 2005 by OMG was adopted the UML 2.0 version that was seriously reworked. The last published version in 2011 was UML 2.4.1.
Types of UML Diagrams
Two types of diagrams are used in UML: Structure Diagrams and Behavior Diagrams. Behavior Diagrams represent the processes proceeding in a modeled environment. Structure Diagrams represent the elements that compose the system.
There are seven types of Structure Diagrams that must be present in any modeled system:
- Class Diagram
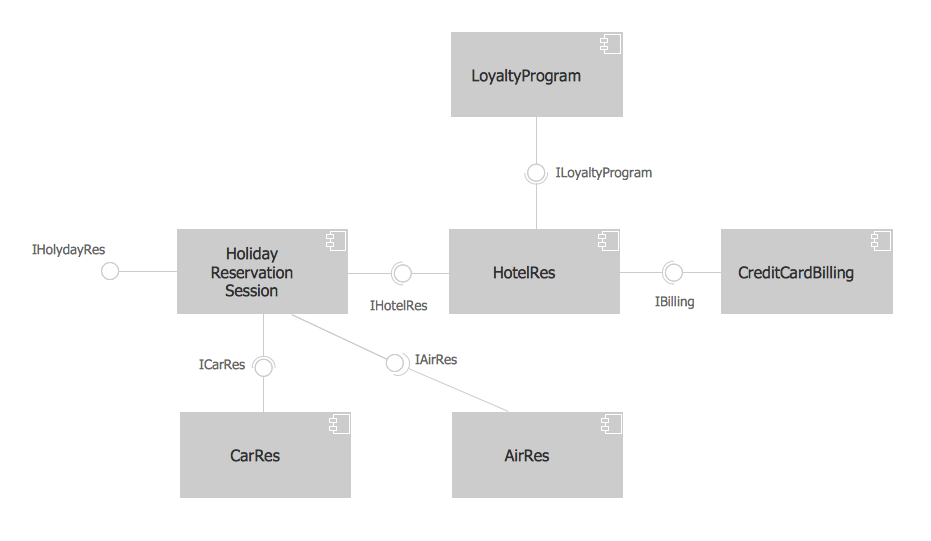
- Component Diagram
- Composite Structure
- Deployment Diagram
- Object Diagram
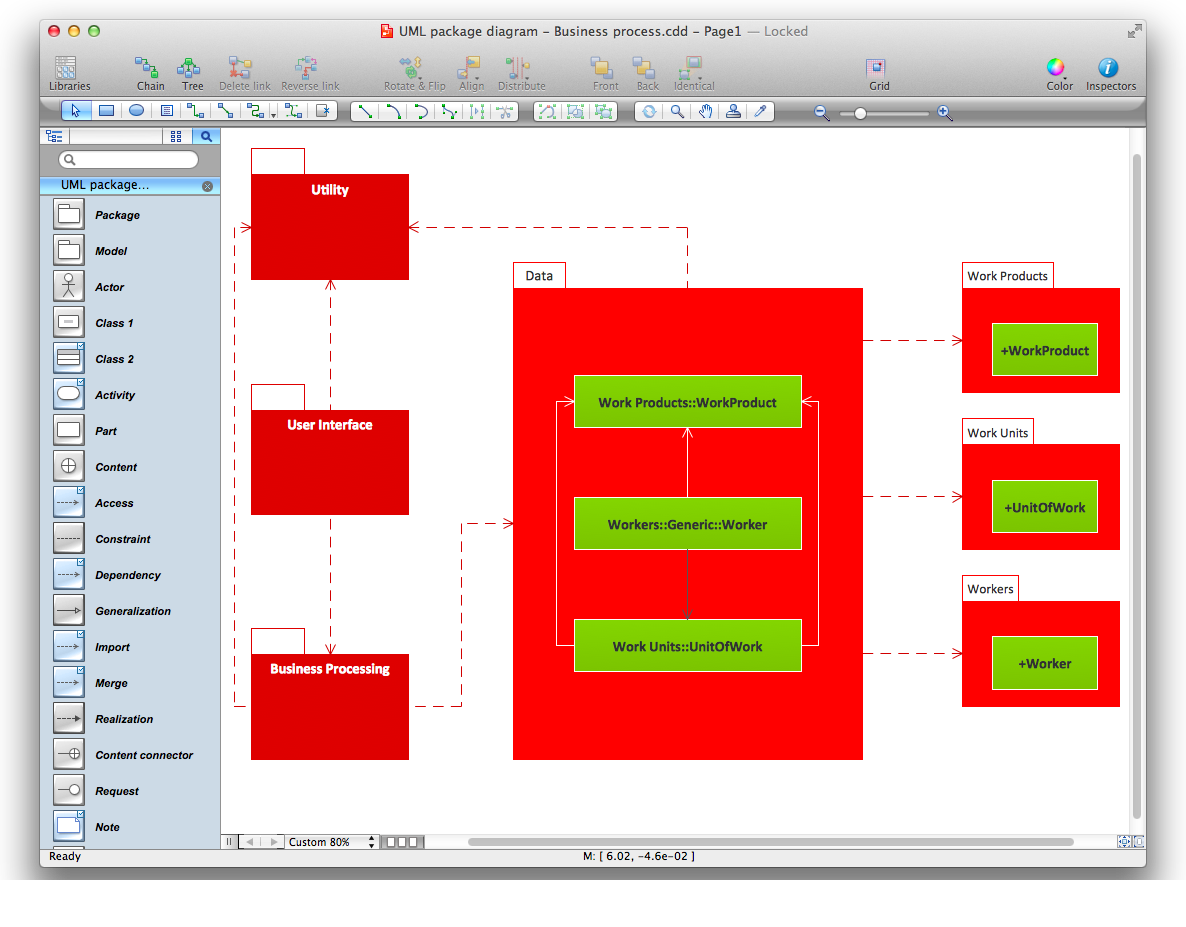
- Package Diagram
The Behavior Diagrams group includes:
The subgroup of Interaction Diagrams controls the flow of control and data, and includes:UML Building Blocks
The UML building blocks determine as things, relationships and diagrams.
There are four types of things in UML: Structural, Behavioral, Grouping and Annotational.
Sructural things (the static part of the model):
Class:
Class represents a set of objects that have the same structure, behavior, and relationships with objects of other classes. Classes are represented as boxes that consist of name, attributes, operations, and responsibilities.

Interface:
Interface is an abstract class that defines a set of operations that the object of the class associated with this interface provides to other objects.

Collaboration:
Collaboration determines interactions between the elements.

Use case:
Use case is a description of the system behavior on the request from the outside of this system.

Component:
Component describes the physical part of the system.

Node:
Node is a resource available during the run time.

Behavioral things (dynamic part of the model):
Interaction:
Interaction is a set of messages that the elements exchange for execution the tasks.

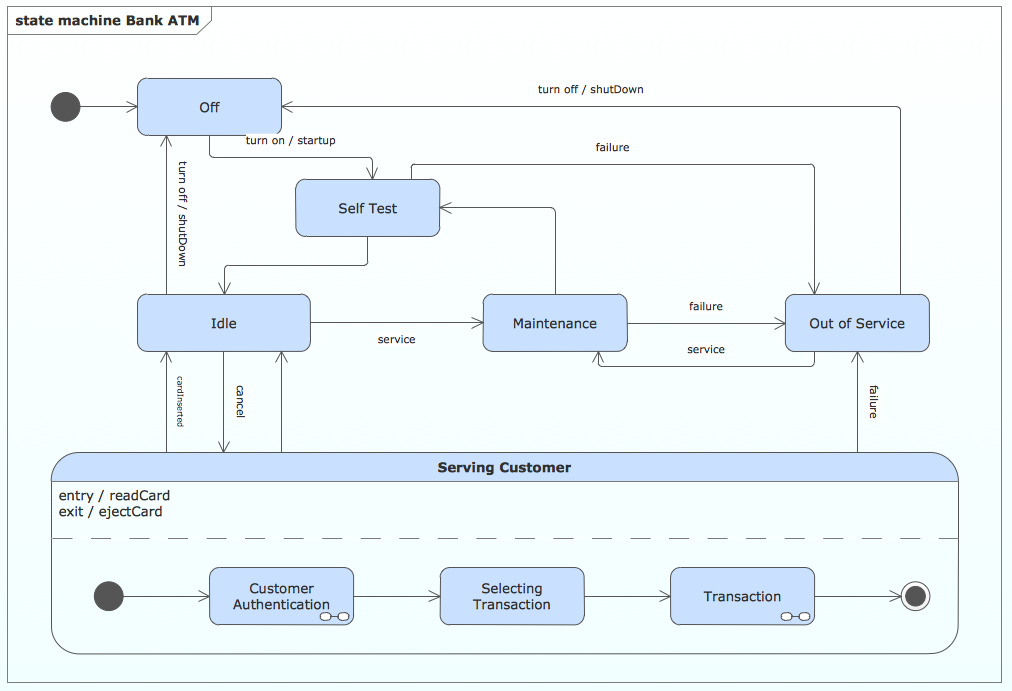
State machine:
State machine defines the states of the object that go in response to the events.

Grouping things (the mechanism for grouping the UML model elements):
Package:
Package groups the classes and other packages.

Annotational things (the mechanism for capturing the remarks, descriptions, and comments of the UML model elements):
Note:
Note is a textual explication.

Relationship :
Association:
Association is a relationship that connect two classes.

Dependency:
Dependency is a relationship when some changes of one element of the model can need the change of another dependent element.

Generalization:
Generalization is an association between the more general classifier and the more special classifier.

Realization:
Realization is a relationship between interfaces and classes or components that realize them.

Pic 1. UML component diagram example.
This diagram was redrawn from wikipedia.org
The documents of ConceptDraw DIAGRAM with UML Diagrams are vector graphic documents. They are available for reviewing, modifying or converting to a variety of formats: image, HTML, PDF file, MS PowerPoint Presentation, Adobe Flash or MS Visio.