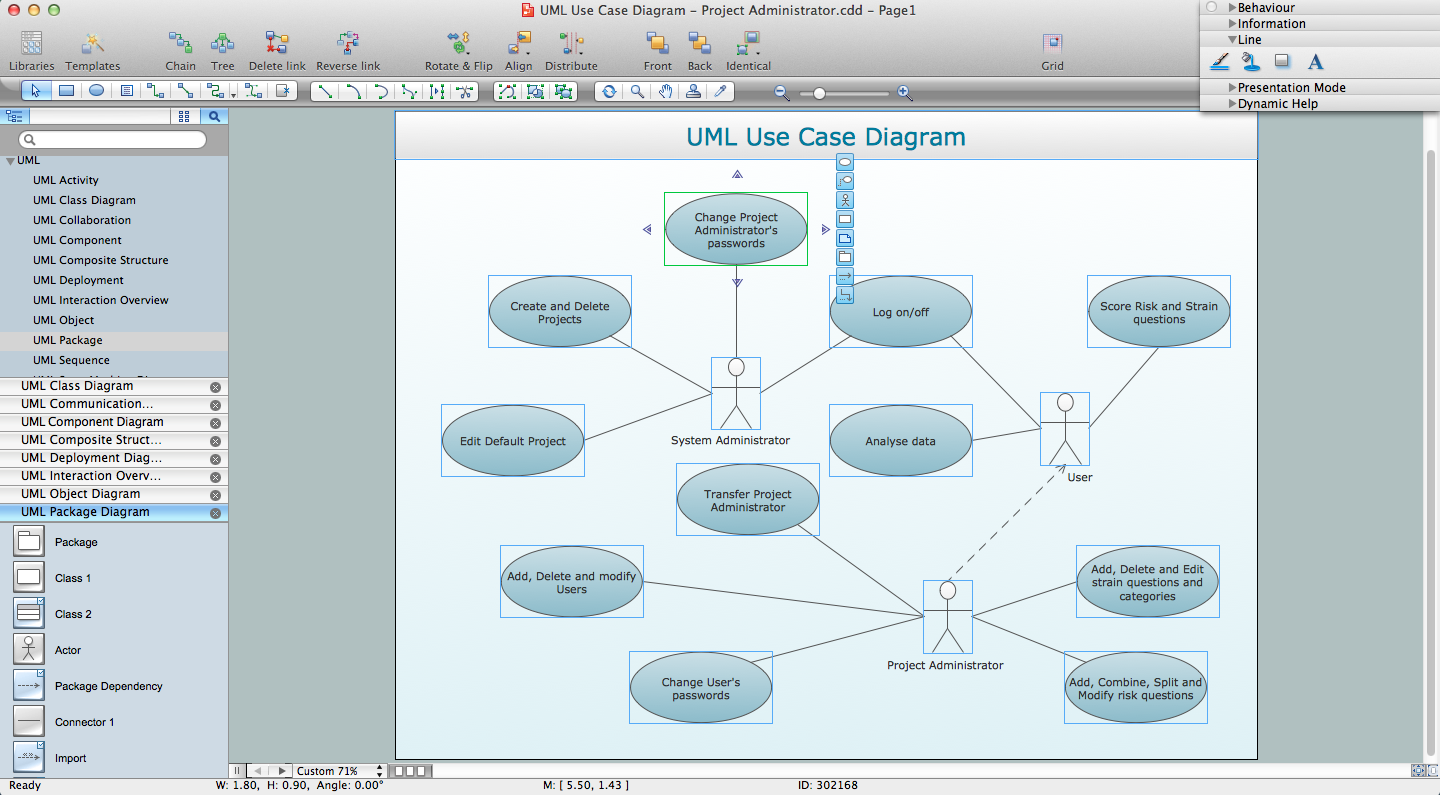
The Rapid UML Solution for ConceptDraw DIAGRAM provides templates and samples for each type of UML diagram that help you to create the UML Diagrams in one moment.

13 libraries of the Rapid UML Solution of ConceptDraw DIAGRAM make your UML diagramming simple, efficient, and effective. You can simply and quickly drop the ready-to-use objects from libraries into your document to create the UML Diagram.

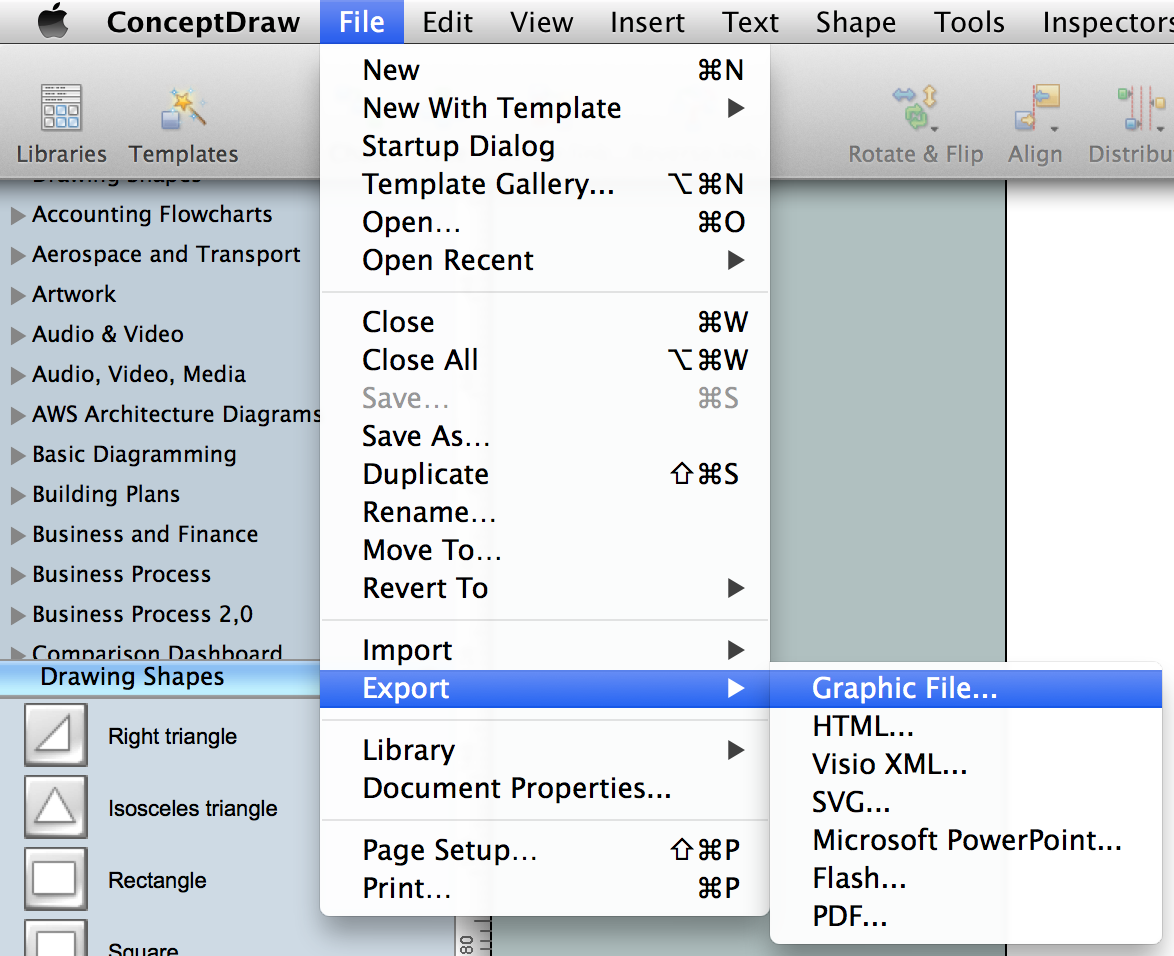
The documents of ConceptDraw DIAGRAM with UML Diagrams are vector graphic documents. They are available for reviewing, modifying or converting to a variety of formats: image, HTML, PDF file, MS PowerPoint Presentation, Adobe Flash or MS Visio.
ConceptDraw DIAGRAM extended with the Rapid UML solution is perfect for drawing professional looking UML diagrams.
TEN RELATED HOW TO's:
A Data Flow Diagram (DFD) is a graphical technique which allows effectively model and analyze the information processes and systems. The ability to fast and easy create the DFDs is made possible with Data Flow Diagrams solution from the Software Development area of ConceptDraw Solution Park. For designing the Data Flow Diagrams are used simple DFD flowchart symbols which are connected each other by arrows depicting the data flow from one step to another.
Picture: DFD Flowchart Symbols
Related Solution:
The fundamental concepts of electrical engineering in our detailed guide. ✔️ Discover essential electrical engineering software tools. 🔸 The main types of electrical engineering you need to know in this article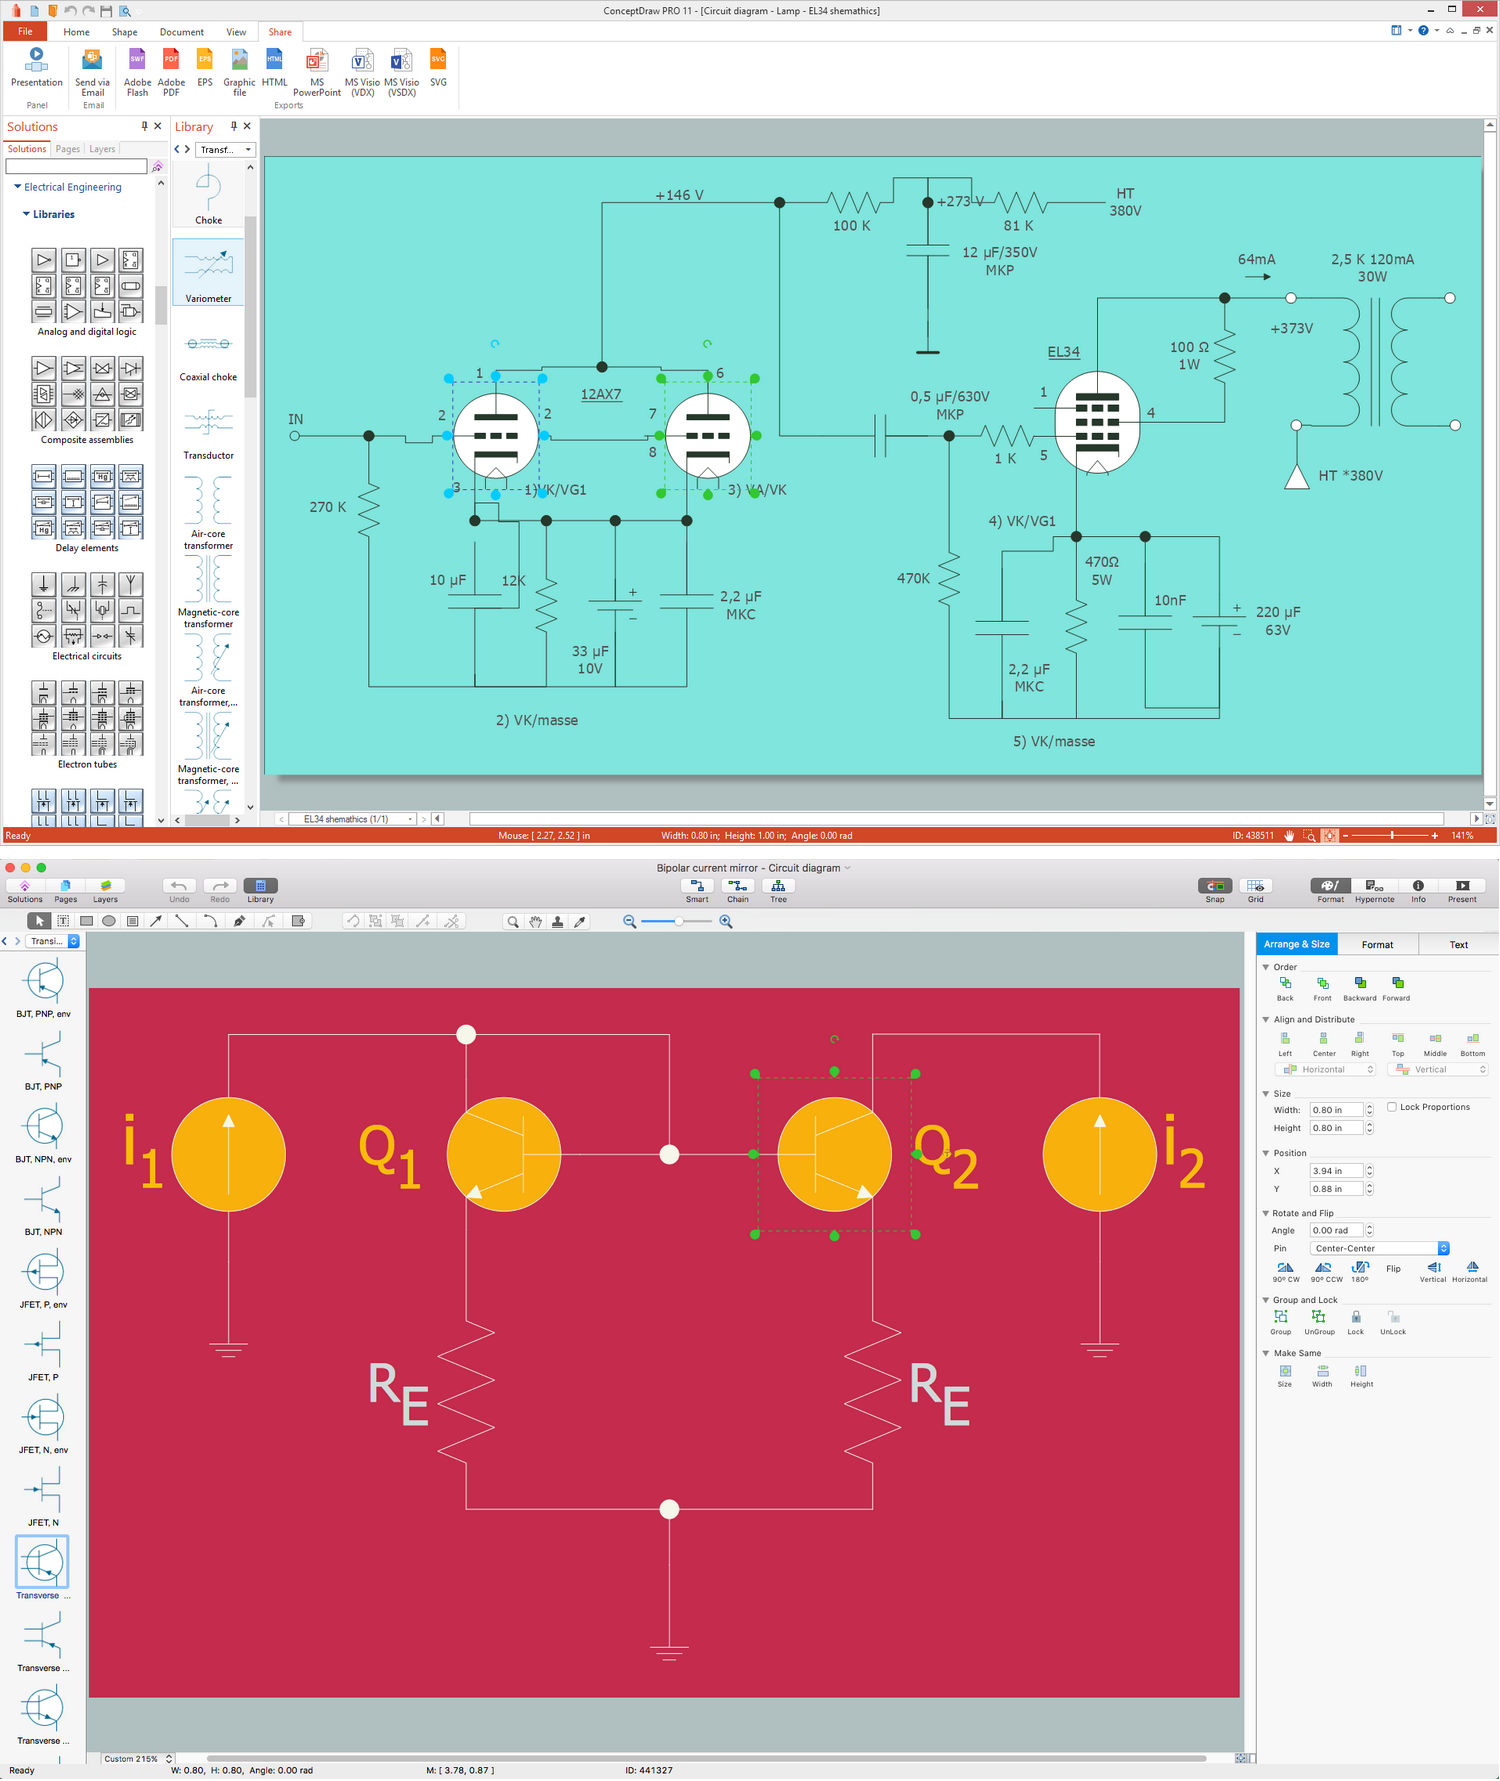
Picture:
What is Electrical Engineering?
Basic Electrical Engineering Software
Related Solution:
While studying, many of the students encounter the necessity of remaking class projects, over and over. To facilitate this process you can use special electrical and telecom plan software, which helps altering projects in several clicks. Using templates will fasten your work, and you will have more free time.
This sample represents an electrical and telecommunication floor plan. Electrical and telecom floor plans contain a floor plan , on which imposed the layout of electrical, and telecommunications equipment. They shows electrical and telecom details regarding the current floor of a building: lightening, fixtures, wires, outlets, circuit panels, etc. Using of standart notation of electrical and telecommunication symbols makes the plan understandable for engineers, architects, constructors, specialist in electricity and telecommunications.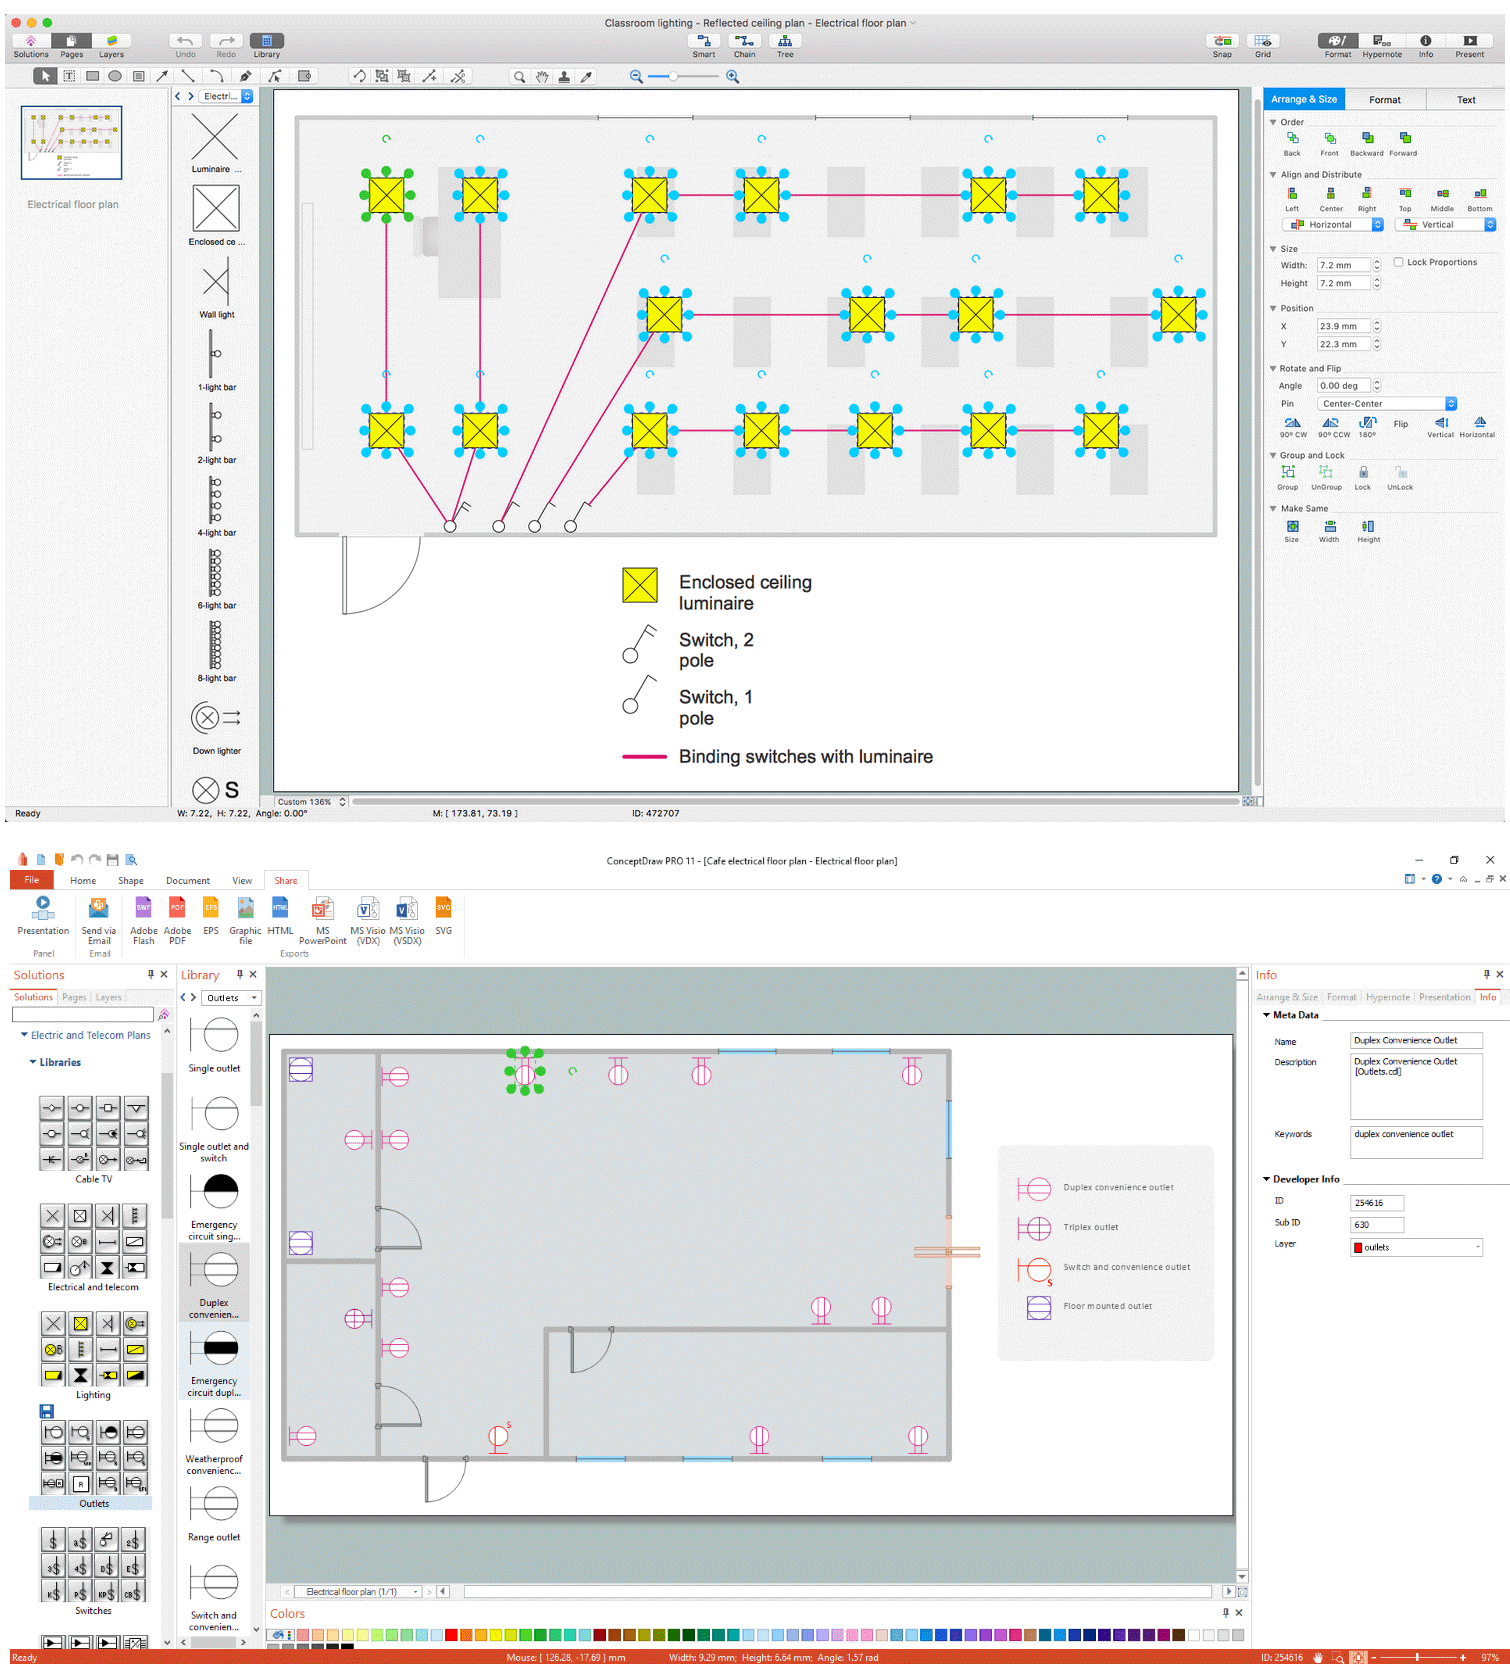
Picture: Electrical and Telecom Plan Software
Related Solution:
ConceptDraw DIAGRAM is a powerful diagramming and vector drawing software. Extended with Windows 8 User Interface solution from the Software Development area, ConceptDraw DIAGRAM became the ideal software for prototype and design professional looking user interfaces for Windows 8 and Windows 8.1. Windows 8 User Interface solution offers you wide variety of user interface design examples, templates and samples.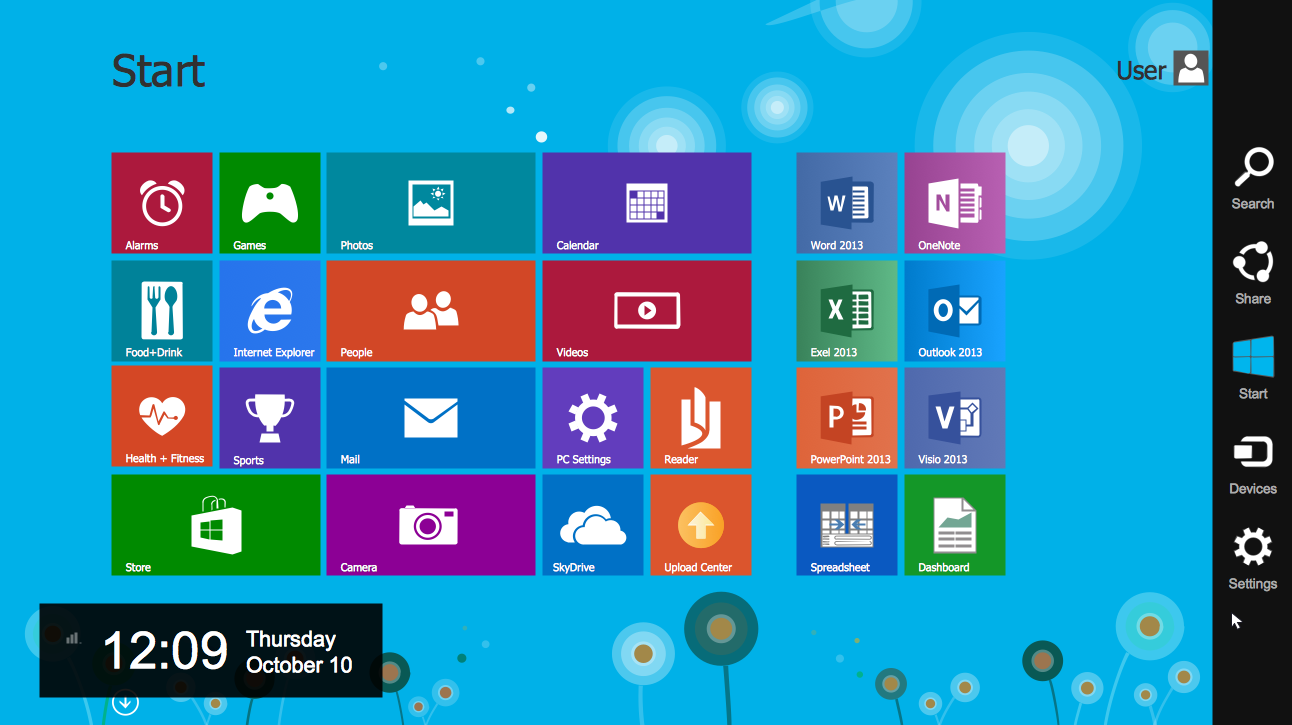
Picture: User Interface Design Examples
Related Solution:
Create Quality Engineering Diagrams (value stream maps) - for value stream analysis and value stream management, material and information flow mapping, using our quick start templates included with ConceptDraw.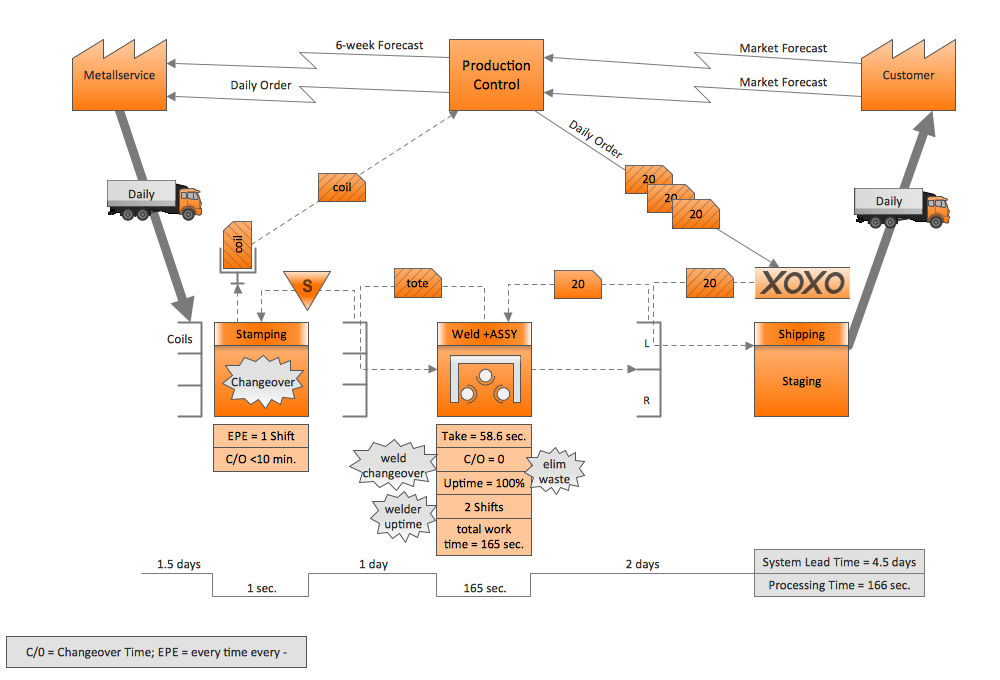
Picture: Quality Engineering Diagrams
Related Solution:
Special libraries of highly detailed, accurate shapes and computer graphics, servers, hubs, switches, printers, mainframes, face plates, routers etc.
Picture: Network Printer
If you need create a Process and Instrumentation Diagram, it is convenient to design it in ConceptDraw DIAGRAM software which offers powerful Chemical and Process Engineering Solution from the Industrial Engineering Area.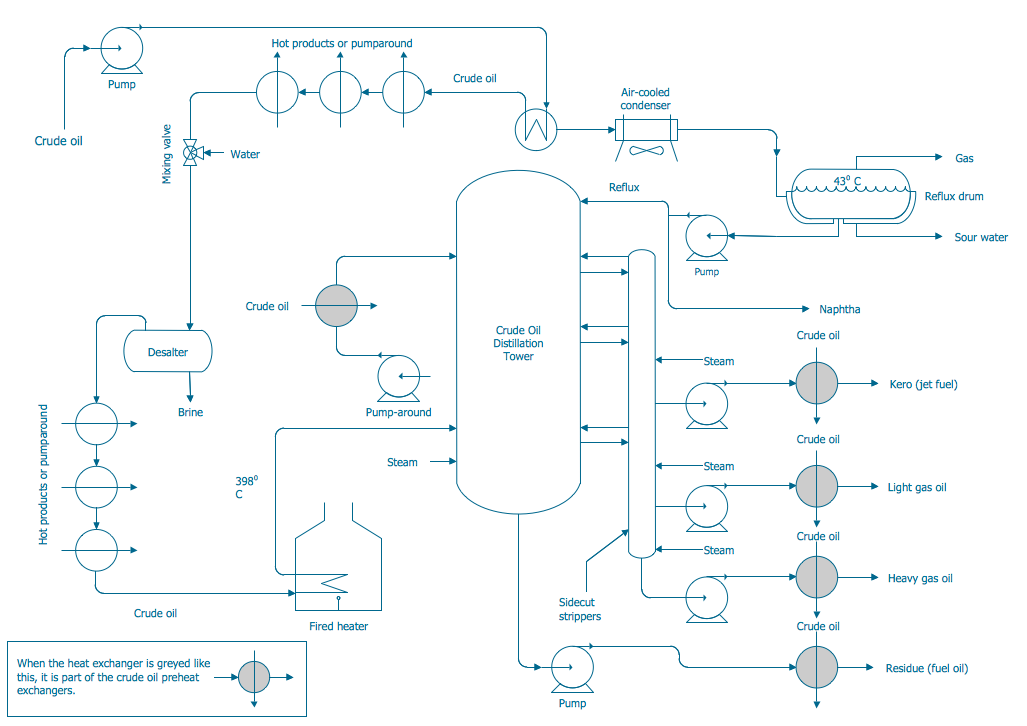
Picture: Process and Instrumentation Diagram
Related Solution:
UML Communication Diagram depicts the interactions between objects or parts in terms of sequenced messages and describes both the static structure and dynamic behavior of a system.
Picture: Diagramming Software for Design UML Communication Diagrams
Complexity of databases increases day by day, due to this the Entity relationship models and E-R diagrams become more and more popular, and now are an important part of database design. E-R diagrams created at ConceptDraw DIAGRAM allow visually and graphically represent structure and design of databases.
Picture: E-R Diagrams
Related Solution:
When it comes to system construction, a class diagram is the most widely used diagram. UML Class Diagrams is a type of static structure diagram that is used for general conceptual modeling of the systematics of the application. Such a diagram would illustrate the object-oriented view of a system. The object orientation of a system is indicated by a class diagram. It describes the structure of a system by showing the general issues,classes of a system, attributes, operations, interfaces, inheritance, and the relationships between them.
Picture: UML Class Diagram Notation
Related Solution: