E-R Diagrams
Complexity of databases increases day by day, due to this the Entity relationship models and E-R diagrams become more and more popular, and now are an important part of database design. E-R diagrams allow visually and graphically represent structure and design of databases.
You can use so popular Chen's notation to represent all components of database and their relationships on the ER diagram. This notation was developed and implemented by Peter Chen in 1976. The main components of the E-R diagrams are:
- entities,
- attributes that describe these entities,
- relationships among these entities that describe associations between the data,
- cardinalities that describe the number of relationship participants: one-to-many (1:M), many-to-many (M:N), and one-to-one (1:1).
In a Chen's notation, entities are represented by rectangles on the diagram with the entity names written inside and relationships are represented by diamonds. Another popular type of E-R diagrams is known as Crow's Foot notation that is derived from the Chen's notation.

Example 1. E-R Diagram - Students and teachers
Use of ConceptDraw DIAGRAM for professional ERD drawing includes using the predesigned components of ER diagram, such as entity relationship symbols, work flow shapes, entity relationship stencils. All they are provided for easy use by 2 libraries of Entity-Relationship Diagram (ERD) Solution from the Software Development Area for ConceptDraw Solution Park.

Example 2. ERD Libraries
There is also wide collection of predesigned E-R Diagrams which is represented at ConceptDraw STORE. All E-R Diagrams samples and templates are well thought-out, professionally designed, can be easy changed according to your needs and further successfully used.

Example 3. E-R Diagrams in ConceptDraw DIAGRAM
The following features make ConceptDraw DIAGRAM extended with the Entity-Relationship Diagram (ERD) solution the most effective E-R diagrams design software:
- You don't need to be an artist to draw professional looking diagrams in a few minutes.
- Large quantity of ready-to-use vector objects makes drawing your diagrams quick and easy.
- Extensive collection of pre-designed templates and samples give you a great start for your own diagrams.
- ConceptDraw DIAGRAM provides you with the possibility to use the grid, rules and guides. You can easily rotate, group, align, and arrange objects, and use different fonts and colors to make your diagram stand out.
- All ConceptDraw DIAGRAM documents are vector graphic files and are available for reviewing, modifying, and converting to a variety of formats: image, HTML, PDF file, MS PowerPoint Presentation, Adobe Flash, MS Visio.
- Using ConceptDraw STORE you can navigate through ConceptDraw Solution Park, managing downloads and updates. You can access libraries, templates and samples directly from ConceptDraw STORE.
- If you have any questions, our support is free of charge and always ready to come to your aid.
TEN RELATED HOW TO's:
Stakeholder management is a critical component to the successful delivery of any project, programme or activity.
ConceptDraw DIAGRAM is a powerful diagramming and vector drawing software. Now, thanks to the Stakeholder Onion Diagrams Solution included to the Management Area of ConceptDraw Solution Park, ConceptDraw DIAGRAM became also unique stakeholder management system design software.
Picture: Stakeholder Management System using Onion Diagram
Related Solution:
When creating ER diagrams, you can apply different color ER diagram styles and also notation styles. ConceptDraw DIAGRAM enhanced with Entity-Relationship Diagram (ERD) Solution gives the ability to draw visual and attractive ER Diagrams using the style icons from Crow’s Foot notation and Chen's notation professionally designed and offered by ERD Chen's Notation and ERD Crow’s Foot Notation libraries.
Picture: ER Diagram Styles
Related Solution:
When you need to visually represent the structure of relational database, Entity relationship diagram (ERD) is a type of diagram for that case.
Most entity-relationship diagrams can be built with objects from Flowchart solution or ERD Solution which contains inbuilt templates. Follow these steps to create your own custom ERD diagram.
Don't be frightened if it looks complex, ConceptDraw DIAGRAM makes it easy to create an ERD, and hundreds of other diagrams, in minutes.
Picture: Developing Entity Relationship Diagrams
Related Solution:
UML Component Diagrams are used to illustrate the structure of arbitrarily complex systems and illustrates the service consumer - service provider relationship between components.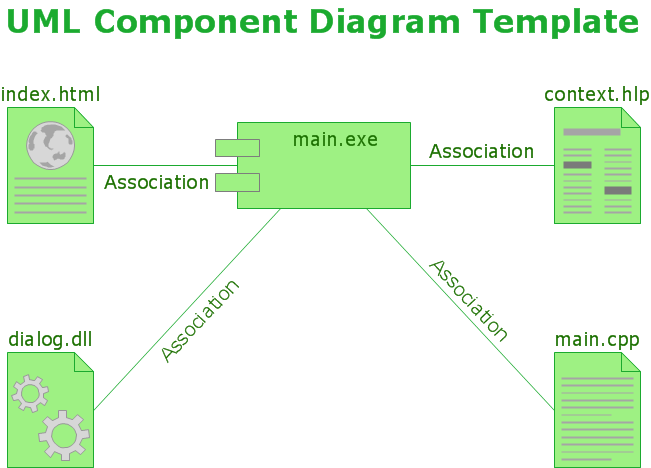
Picture: UML Component Diagram
Mechanical design is a labour-intensive process. To facilitate the task of Mechanical Engineering Diagrams creating, ConceptDraw DIAGRAM diagramming and vector drawing software was extended with Mechanical Engineering solution from the Engineering area. Now, ConceptDraw DIAGRAM is a powerful Mechanical Design Software.
Picture: Mechanical Design Software
Related Solution:
The ConceptDraw Flowchart component includes a set of samples and templates. This geathered as flowchart maker toolbox which focused on drawing flowcharts of any industry standards.
Picture: Flowchart Components
Related Solution:
Database model is a graphic representation need at the beginning of project development. You won't have any problems with drawing ER diagrams on a Mac anymore with ConceptDraw DIAGRAM application. Special libraries that contain all the symbols of both Chen's and Crow’s foot notation allow you to start database modeling within a few minutes.
Creating entity-relationship diagrams on Mac is fun and effortless when you use a software designed for professional ERD drawing tailored to specific characteristics of Apple OS X. ConceptDraw DIAGRAM is a business diagramming software for those using OS X.
The Entity-Relationship Diagrams solution for ConceptDraw has 2 libraries containing about 50 vector icons, depicting ERD symbols of the most popular Chen's and Crow’s Foot Notations. The other valuable component of the solution is a collection of ERDs samples and templates that can be opened on Macs and PCs.
Picture: Drawing ER diagrams on a Mac
Related Solution:
The vector stencils library Chen ERD from the solution Entity-Relationship Diagrams (ERD) contains specific symbols of the Chen ERD notation including entity symbols and relationship symbols for ConceptDraw DIAGRAM software.
Picture: Chen ERD Diagram
Related Solution:
An abstract representation is usually the first thing you will need while developing a database. To understand the ways that databases are structured, you should look through entity-relationship diagram examples and see the notations features and attributes. With an entity-relationship model you can describe a database of any complexity.
This Entity-relationship diagram is a tool for software developers. It enables every element of database to be managed, communicated and tested before release. This ERD was created using symbols advocated by Chen's notation. Because of a linguistic origin of the Chen’s notation, the boxes representing entities could be interpreted as nouns, and the relationships between them are in verb form, shown on a diagram as a diamond.
Picture: Entity Relationship Diagram Examples
Related Solution:
Structured-systems analysis and design method uses data flow diagrams to represent the process of data flowing through a system. Talking about this might be useless without a proper example of DFD for online store (Data Flow Diagram). This DFD example shows all the distinctness that a diagram can bring into a scattered data structure.
Data flow diagrams are used to show how data is processed within some business processes. Making DFD is a common practice for business process modeling and analysis. This diagram represents the online store business flow. It describes inputs and outputs within online selling process and depicts the interactions between its participants. This DF diagram can be used by system analysts to create an overview of a business, to study and discover its inherent strengths and weak points.
Picture: Example of DFD for Online Store (Data Flow Diagram)
Related Solution:

