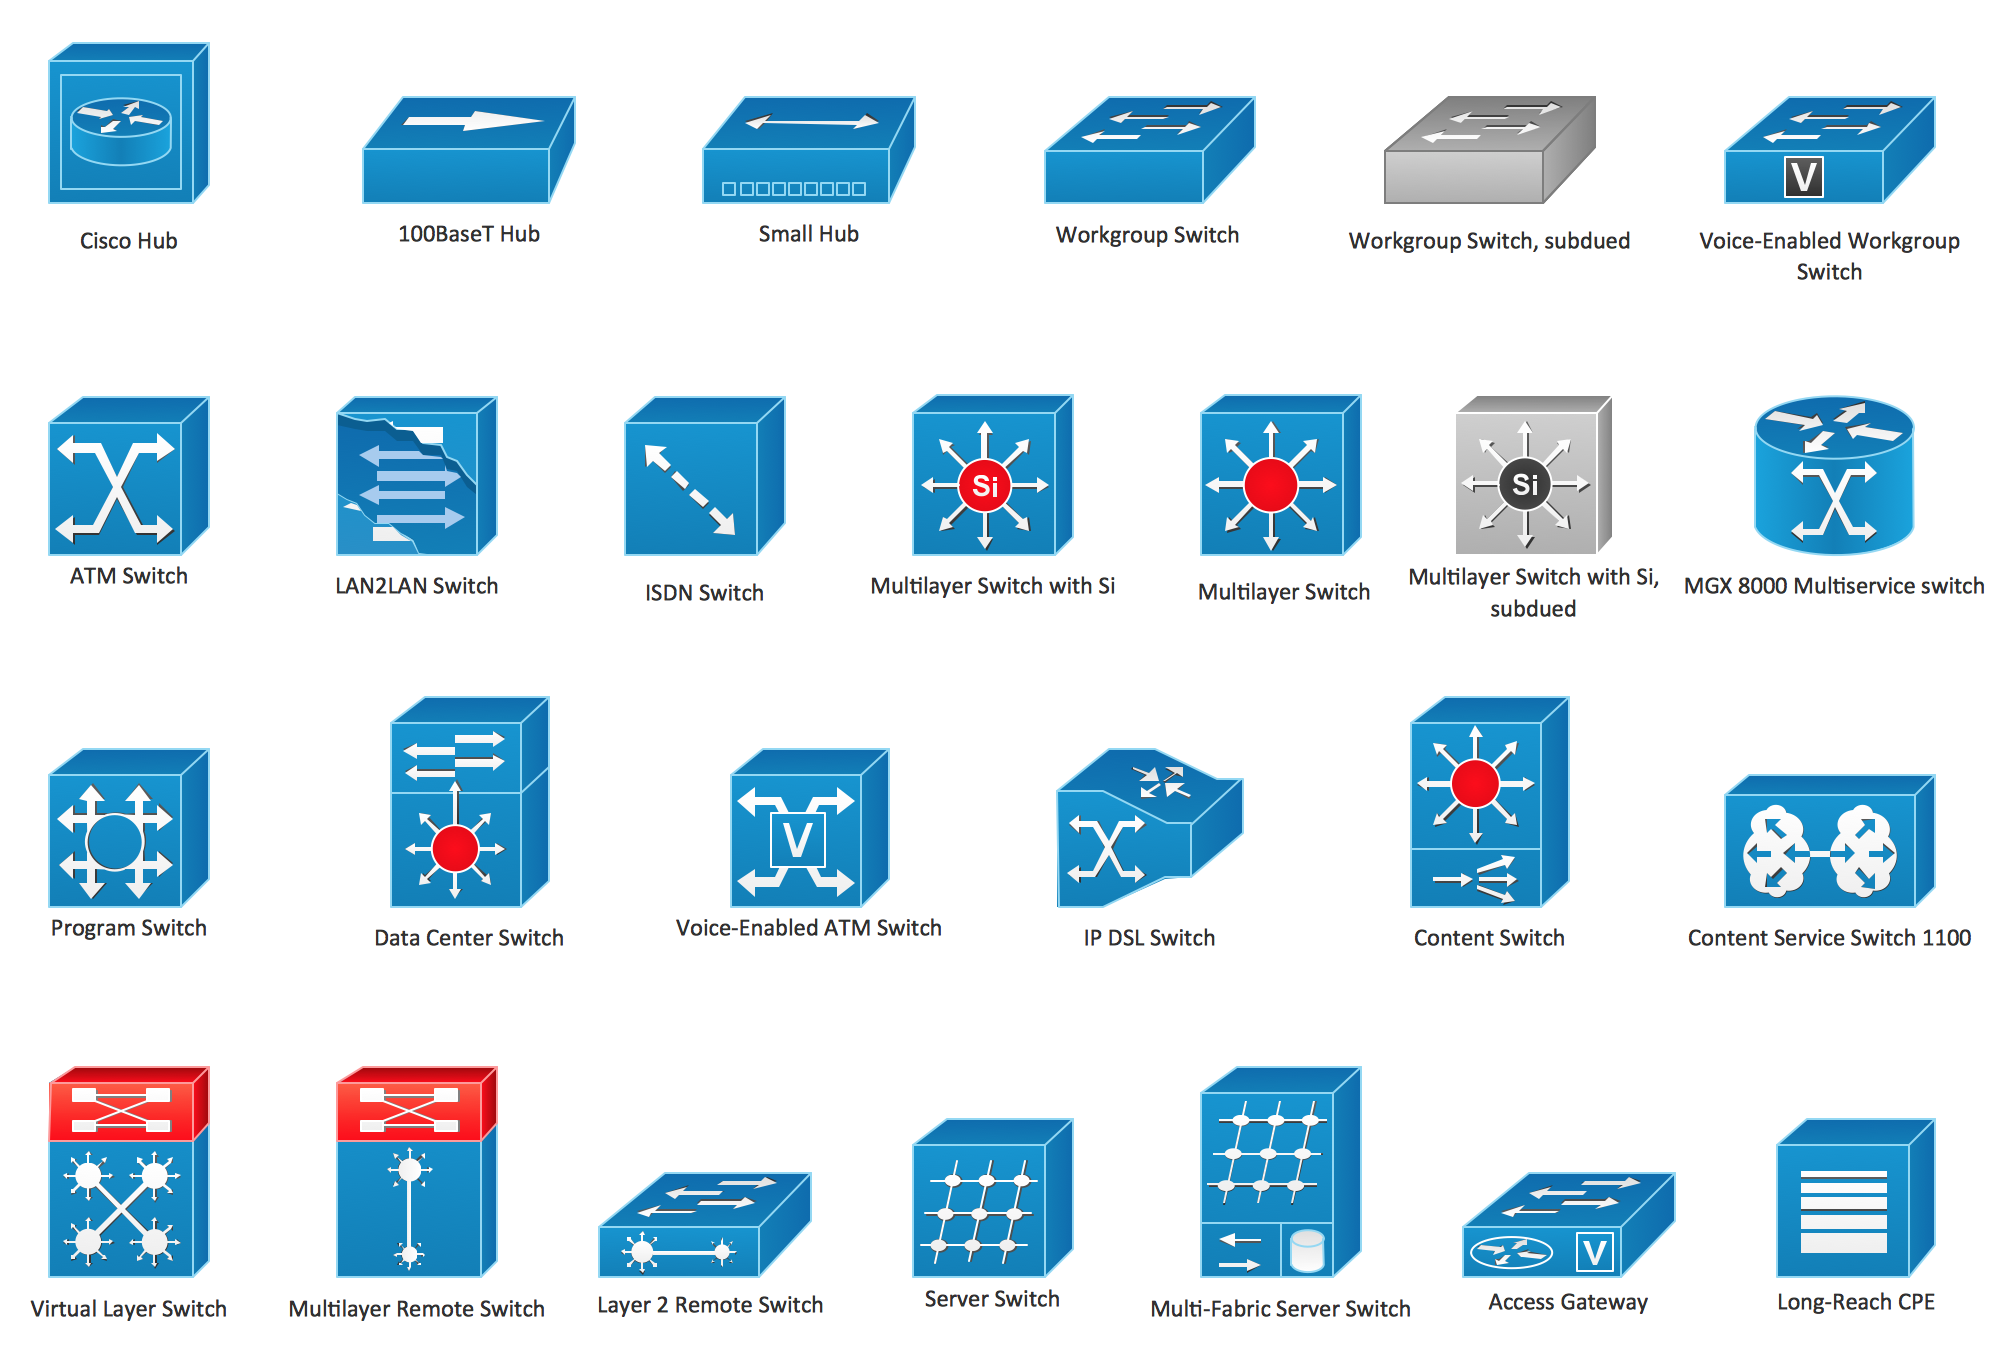
Example 2. Design Elements — Cisco Switches and Hubs for Network Diagrams
The example "Design elements — Cisco Switches and Hubs" is included in the Cisco Network Diagrams solution from the Computer and Networks area of ConceptDraw Solution Park.

Example 3. Cisco Network Diagrams Solution
Use the Cisco Network Diagrams Solution for ConceptDraw DIAGRAM software to create your own professional looking diagrams of any complexity quick, easy and effective. Pick carefully each Cisco icon to make your diagrams successful.
All source documents are vector graphic documents. They are available for reviewing, modifying, or converting to a variety of formats (PDF file, MS PowerPoint, MS Visio, and many other graphic formats) from the ConceptDraw STORE. The Cisco Network Diagrams Solution is available for all ConceptDraw DIAGRAM or later users.
Icons, shapes, stencils, symbols and design elements for Cisco Network Diagrams:
TEN RELATED HOW TO's:
Use the ConceptDraw DIAGRAM software that has vector clipart of numerous cable connectors, examples, and templates for drawing different types of audio and video connection diagrams. Paste icon of the receiver or another device to page and layout sockets and plugs. Further connect plugs with each other, and now you have well-designed connection diagram.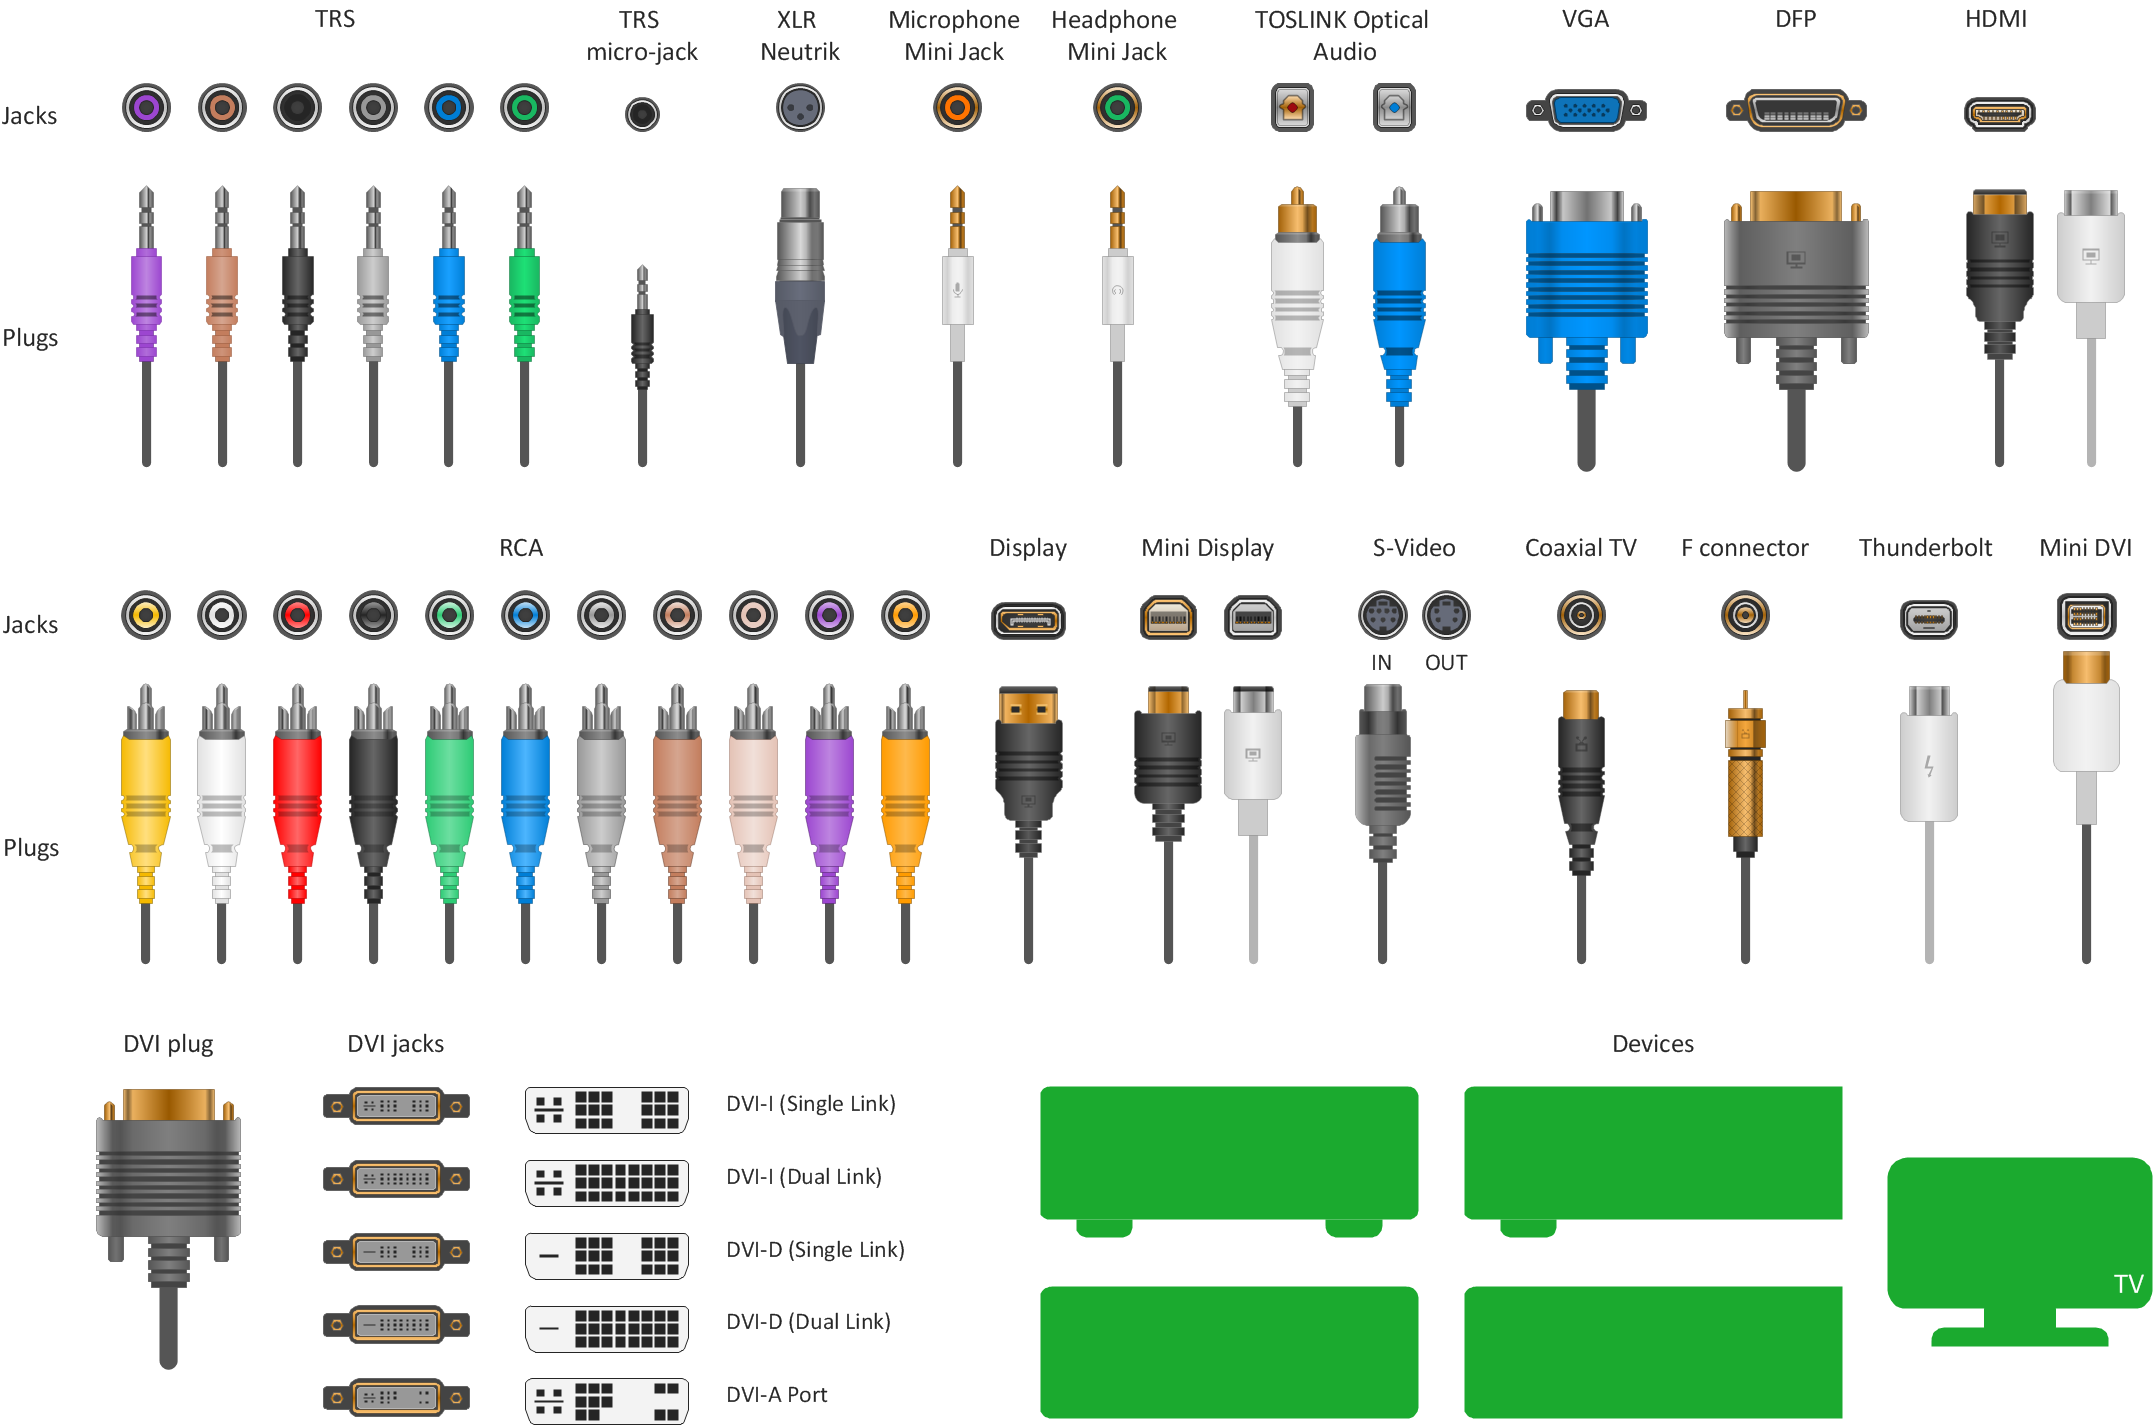
Picture: How to Make Audio and Video Connections
Related Solution:
Also included are standardized hr flowchart symbols, meaning your diagrams will be relevant and understood by all business associates.
Picture: HR Flowchart Symbols
Related Solution:
It's no secret that there is a list of skills that every average system administrator should have. And it's important to be able to manage domains via active directory technologies. The best way to keep all the details in mind is to draw a diagram representing users, groups and domains.
This diagram represents an Active Directory Services (Active Directory Domain Services). It can be helpful for system and network administrators to organize a network physical and logical elements (domains, data bases, servers, network equipment, end-user computers etc.) into a secure and logical structure. The logical structure of Active Directory is a hierarchical organization of all network components. The data that is stored in Active Directory comes from some diverse sources. The Active Directory diagram created using ConceptDraw Active Directory Diagram solution. It shows allocating group policies and functions assigned to end users. It helps to plan, manage and maintain the certain user access scenario.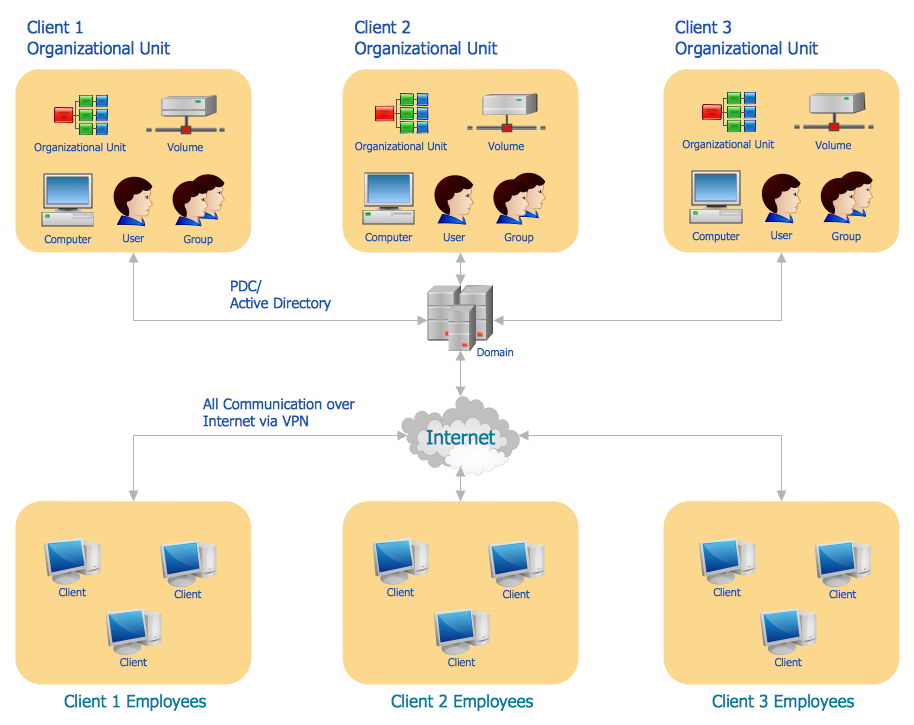
Picture: Active Directory Diagram
Related Solution:
ConceptDraw DIAGRAM diagramming and vector drawing software extended with Security and Access Plans Solution from the Building Plans Area of ConceptDraw Solution Park is a powerful software for fast and easy drawing professional looking Physical Security Plan.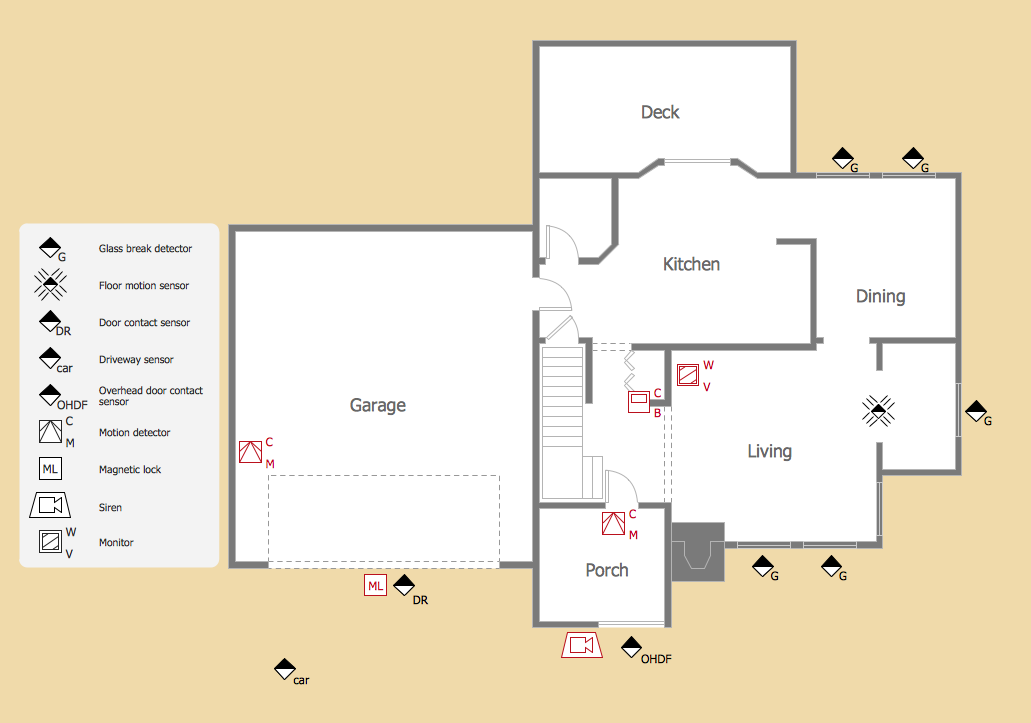
Picture: Physical Security Plan
Related Solution:
The Enhanced Interior Gateway Routing Protocol (EIGRP) is a progressive distance-vector dynamic routing protocol. It was developed by the Cisco Systems and is available as an open standard from 2013.
EIGRP is used to help automate routing decisions and configuration of the computer network. It allows the routers of the same logical area automatically share route information.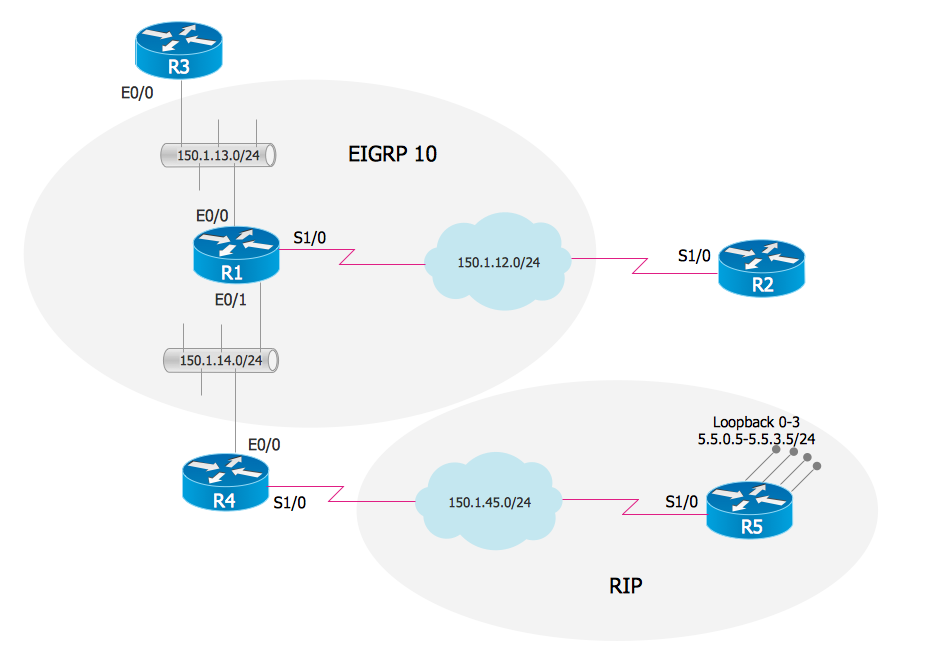
Picture: EIGRP. Computer and Network Examples
Related Solution:
Subway infographic design elements of MetroMap and ConceptDraw software tools.
Picture: Subway infographic design elements - software tools
Related Solution:
ConceptDraw Network Drawing Software - Network design software for network drawings with abundant examples and templates.
Create computer network designs, diagrams and schematics using ConceptDraw.
Picture: Network Drawing Software
For documenting the Cloud Computing Architecture with a goal to facilitate the communication between stakeholders are successfully used the Cloud Computing Architecture diagrams. It is convenient and easy to draw various Cloud Computing Architecture diagrams in ConceptDraw DIAGRAM software with help of tools of the Cloud Computing Diagrams Solution from the Computer and Networks Area of ConceptDraw Solution Park.
Picture: Cloud Computing Architecture Diagrams
Related Solution:
Every corporate network is unique, though there are guidelines and best practices in developing networks. As it is quite difficult to implement a pure topology within a company, using a hybrid network topology is considered a better solution. As a rule, such network assembles advantages and features of source topologies.
This diagram is an example of the Hybrid network. This type of network topology means a conjunction of other network topologies. Such as star-bus, ring-mesh topologies, etc. It should be obviously diverse networks. The final computer network inherits both advantages and disadvantages of its ingredients. Using the ConceptDraw Computer and Networks solution including vector graphic libraries and templates one can develop professional custom network diagrams of any topology and complexity.
Picture: Hybrid Network Topology
Related Solution:
Boost your brand awareness and recognition through graphic design.
ConceptDraw DIAGRAM business graphics software provides wide opportunities for creativity and helps generate amazing visuals.
Picture: Business Graphics Software
