Cisco Media.
Cisco icons, shapes, stencils and symbols
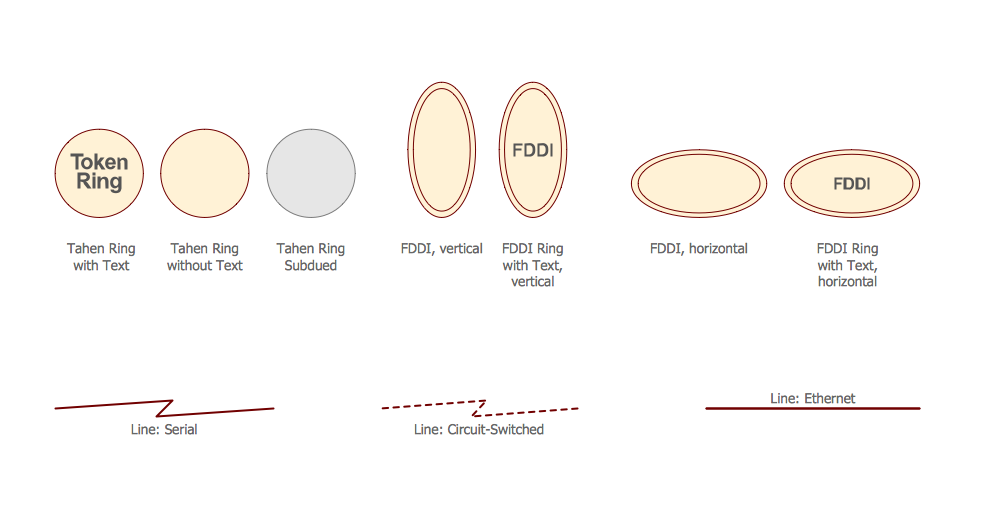
The ConceptDraw vector stencils library "Cisco Media" contains 10 symbols for drawing the computer network diagrams using the ConceptDraw DIAGRAM diagramming and vector drawing software:
- Token Ring with Text
- Token Ring without Text
- Token Ring Subdued
- Line: Ethernet
- FDDI, vertical
- FDDI Ring with Text, vertical
- FDDI Ring, horizontal
- FDDI Ring with Text, horizontal
- Line: serial
- Line: Circuit-switched
Sample 1. Design Elements — Cisco Media (macintosh, windows)
for Network Diagrams.
The example "Design elements - Cisco Media" is included in the Cisco Network Diagrams solution from the Computer and Networks area of ConceptDraw Solution Park.
Icons, shapes, stencils, symbols and design elements for Cisco Network Diagrams:
TEN RELATED HOW TO's:
Cisco switches and hubs deliver the best performance, and often used as network solutions for small businesses, enterprises, data centers. Cisco switches are the core interconnect devices of each computer network. The numerous Cisco switches specifically designed for various applications. Network switches are separated for two types: fixed configuration and modular switches. The fixed configuration switches deprecate swapping or adding another module, and vice versa for modular switch.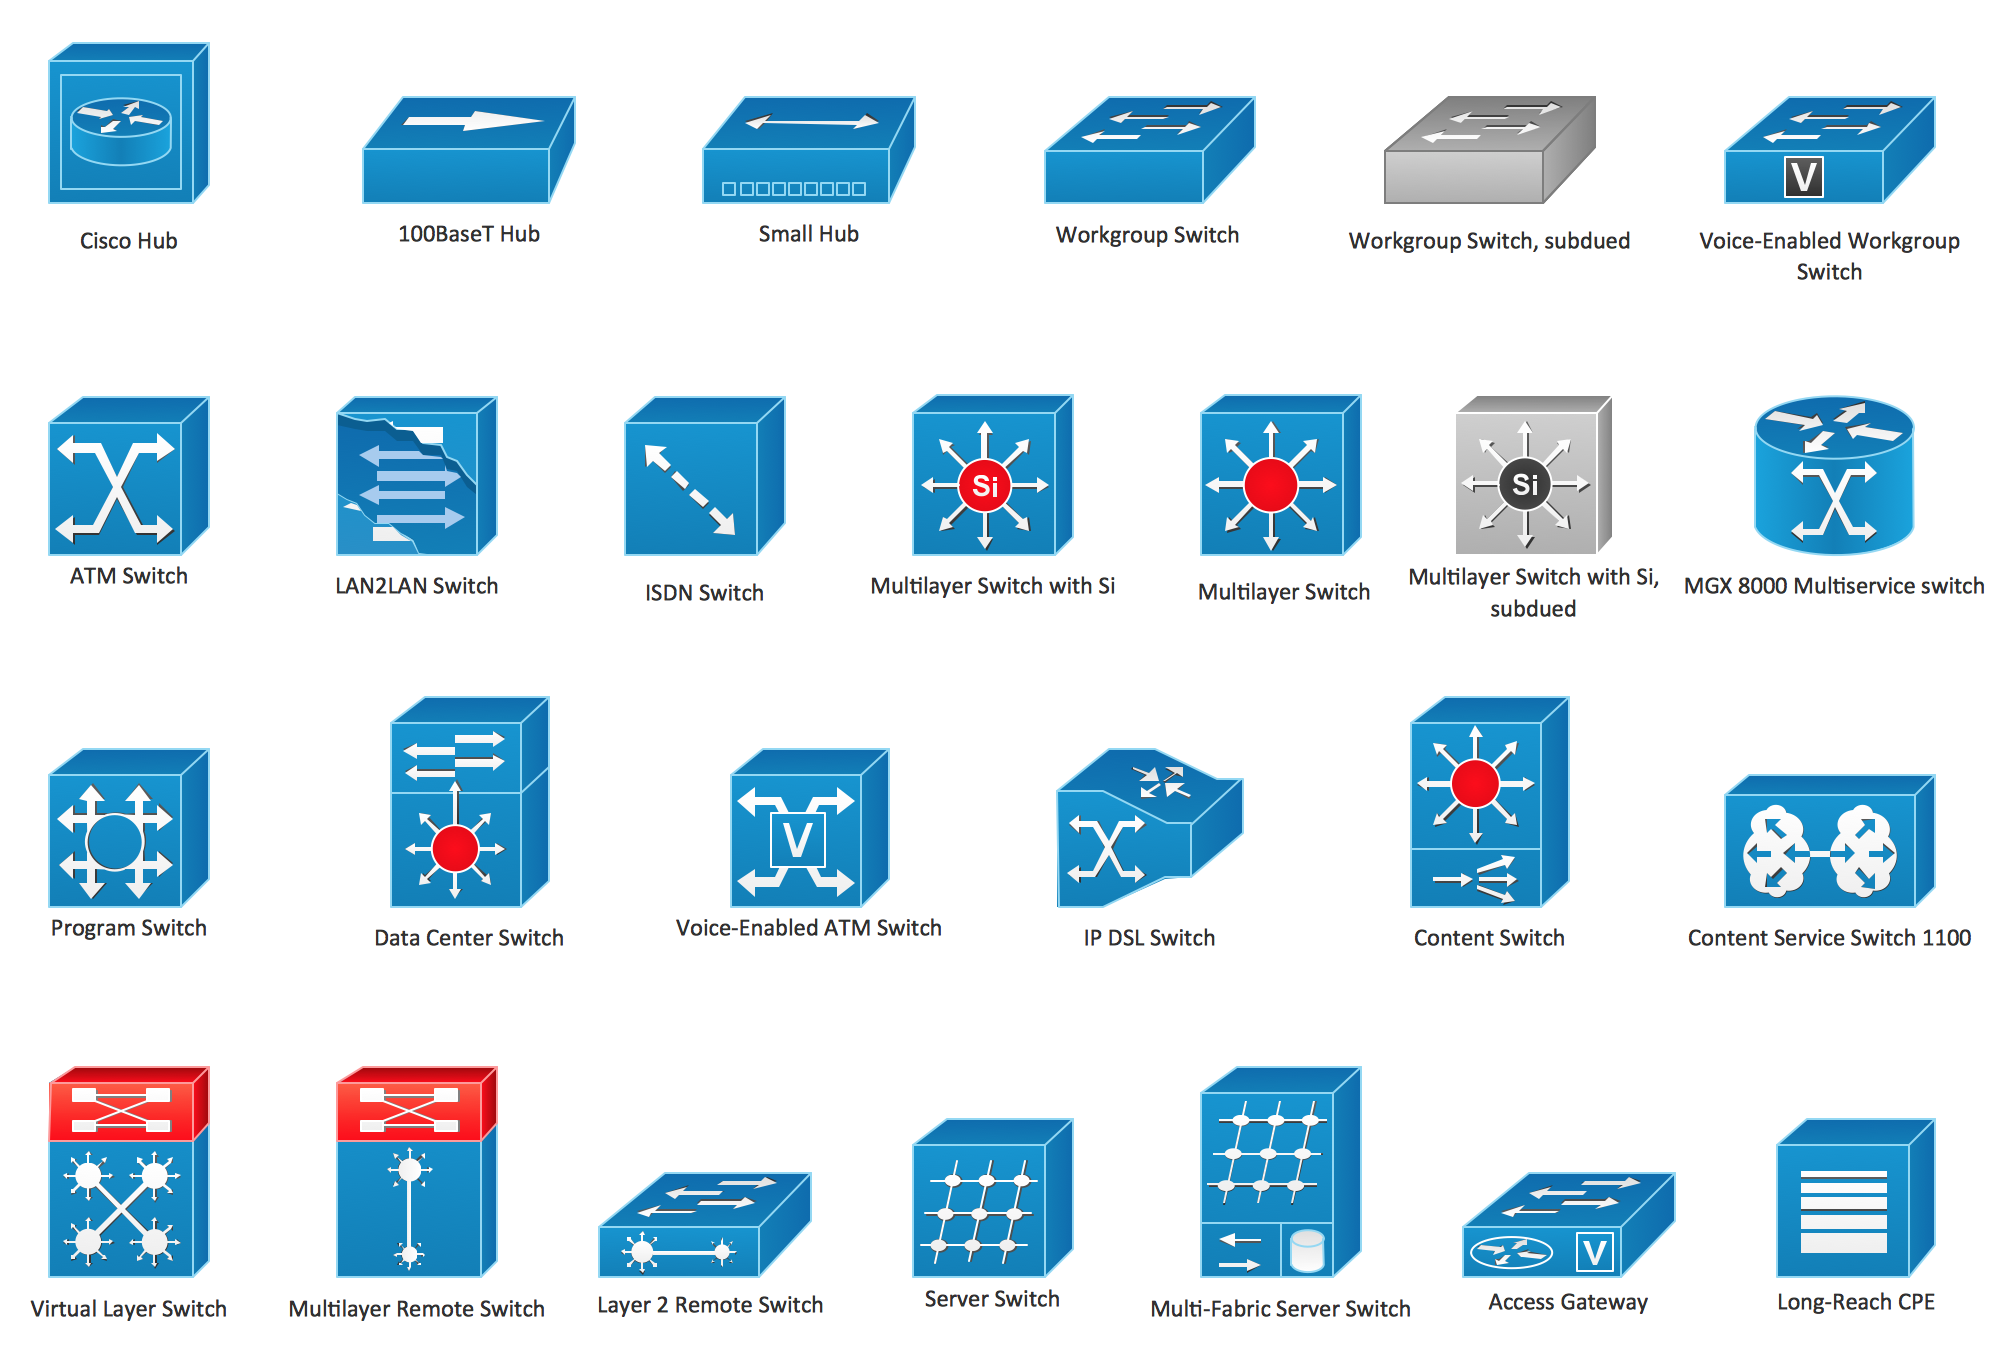
Picture: Cisco Switches and Hubs. Cisco icons, shapes, stencils and symbols
Related Solution:
ConceptDraw DIAGRAM is the only application on the Macintosh platform, supplied with a comprehensive Cisco icon set. For graphic solutions that support Windows, only Microsoft Visio has a library of Cisco shapes. ConceptDraw DIAGRAM is a valuable option to many network professionals that use Macintosh computers or work in a combined Mac and PC environment.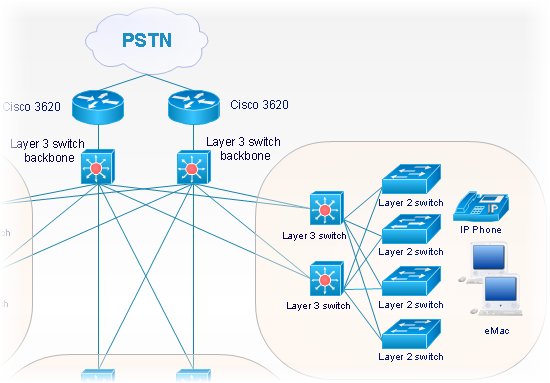
Picture: Cisco Network Objects in ConceptDraw DIAGRAM
Wireless computer network diagrams help system administrators and network engineers to find out amount and type of equipment needed for each office LAN.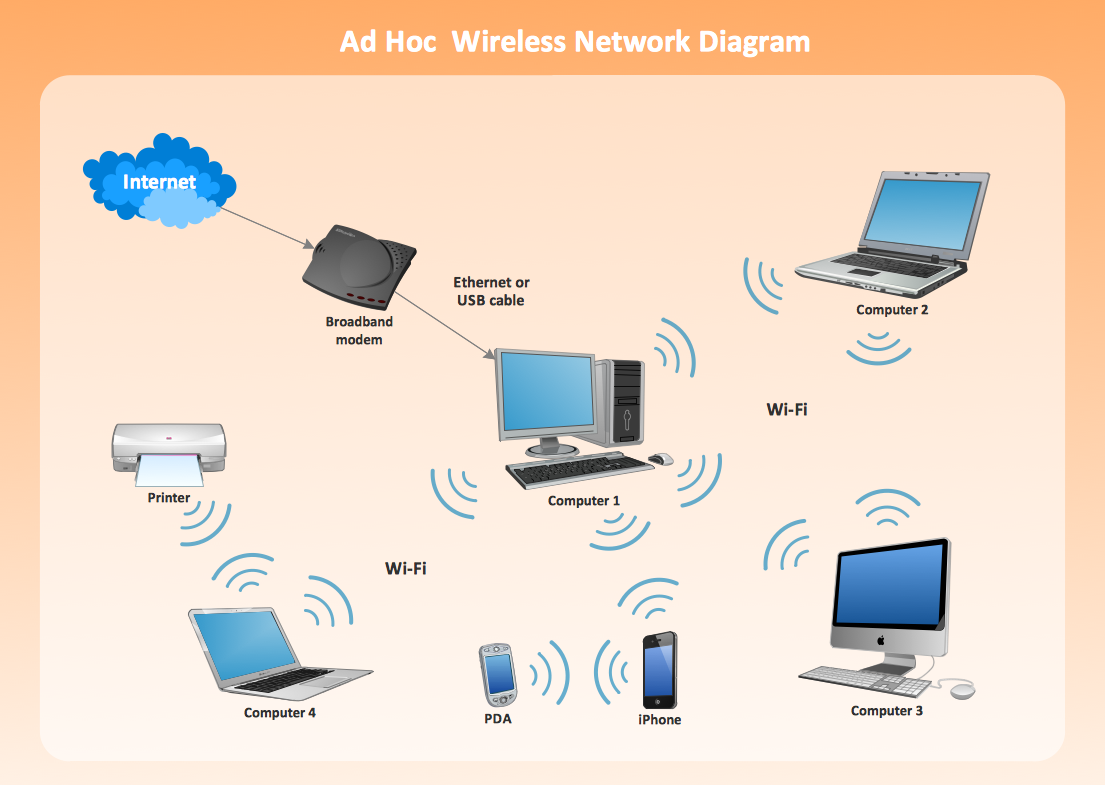
Picture: Wireless Network LAN
Related Solution:
A list of parameters on which networks differ is very long. A large network with a range up to 50 kilometers is called metropolitan area network (MAN), and this type of network can include several local area networks. Metropolitan networks in their turn connect into global area networks.
Here you will see a Metropolitan Area Network (MAN). This is an extensive network which occupies a large territory including a few buildings or even the whole city. The space of the MAN is bigger than LAN, but lower than WAN. MAN comprise a lot of communication equipment and delivers the Internet connection to the LANs in the city area. Computer and Networks solution for ConceptDraw DIAGRAM provides a set of libraries with ready-to-use vector objects to design various kinds of computer networks.
Picture: Metropolitan area networks (MAN). Computer and Network Examples
Related Solution:
The ConceptDraw vector stencils library Cisco Multimedia, Voice, Phone contains equipment symbols for drawing the computer network diagrams.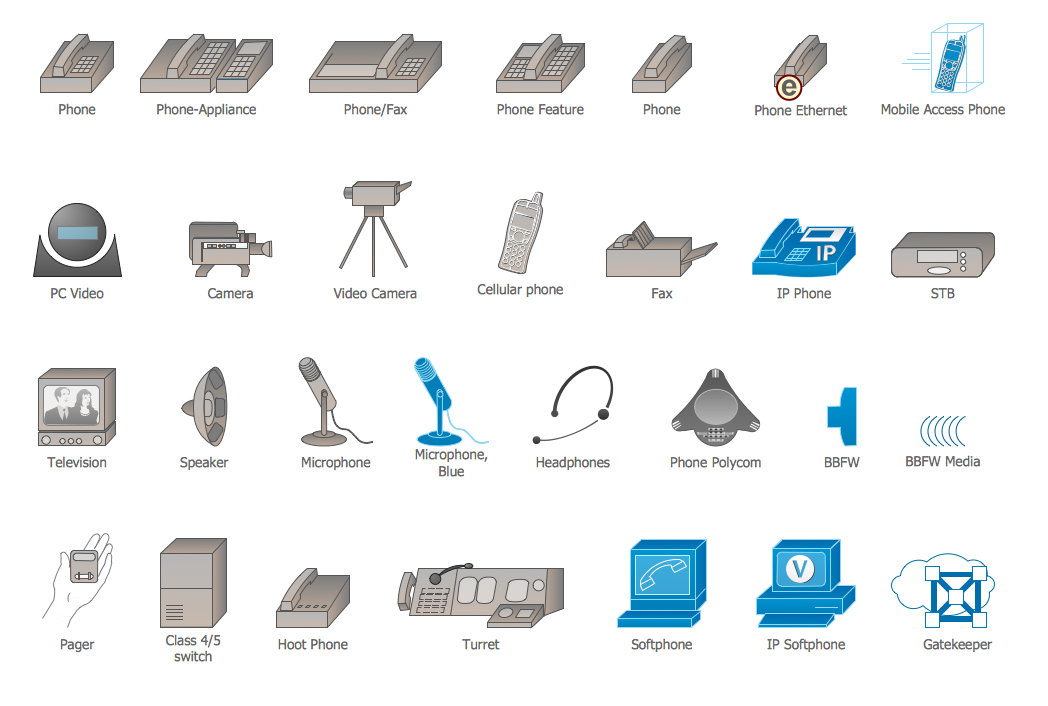
Picture: Cisco Multimedia, Voice, Phone. Cisco icons, shapes, stencils and symbols
Related Solution:
A Local Area Network (LAN) is a computer network that interconnects computers on the limited area such as a home, office building, school, bank, computer laboratory, etc.
ConceptDraw DIAGRAM is a powerful network diagramming and vector drawing software. It provides the Computer and Networks Area with many Solutions that contain the wide set ready-to-use predesigned vector stencils and examples to help you design the LANs quick and easy.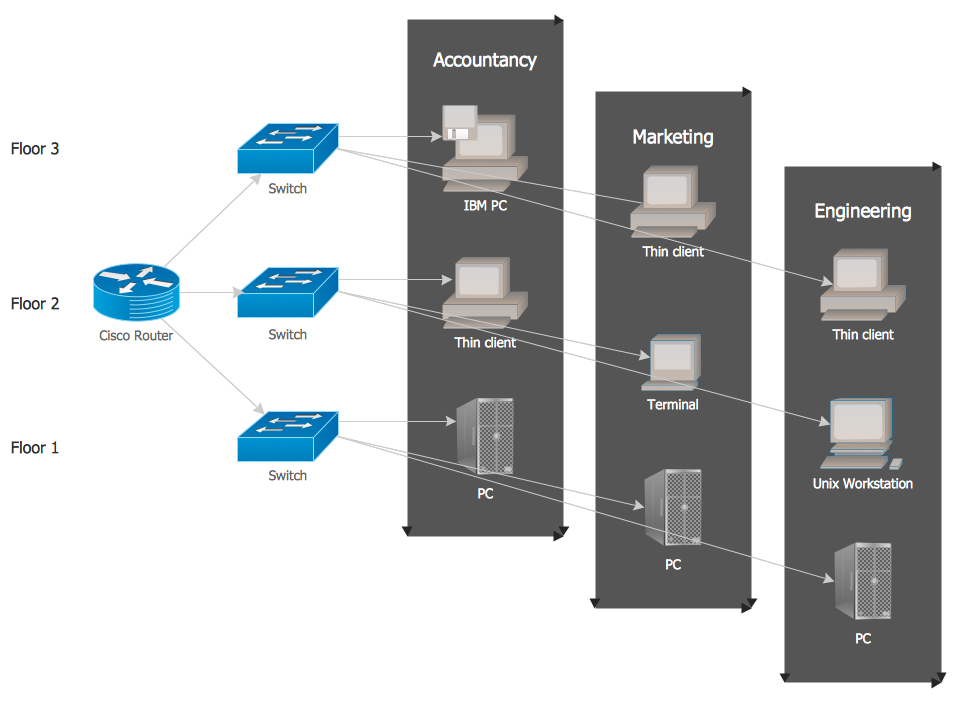
Picture: Local network area. Computer and Network Examples
Related Solution:
The ConceptDraw vector stencils library Cisco Optical contains symbols for drawing the computer network diagrams.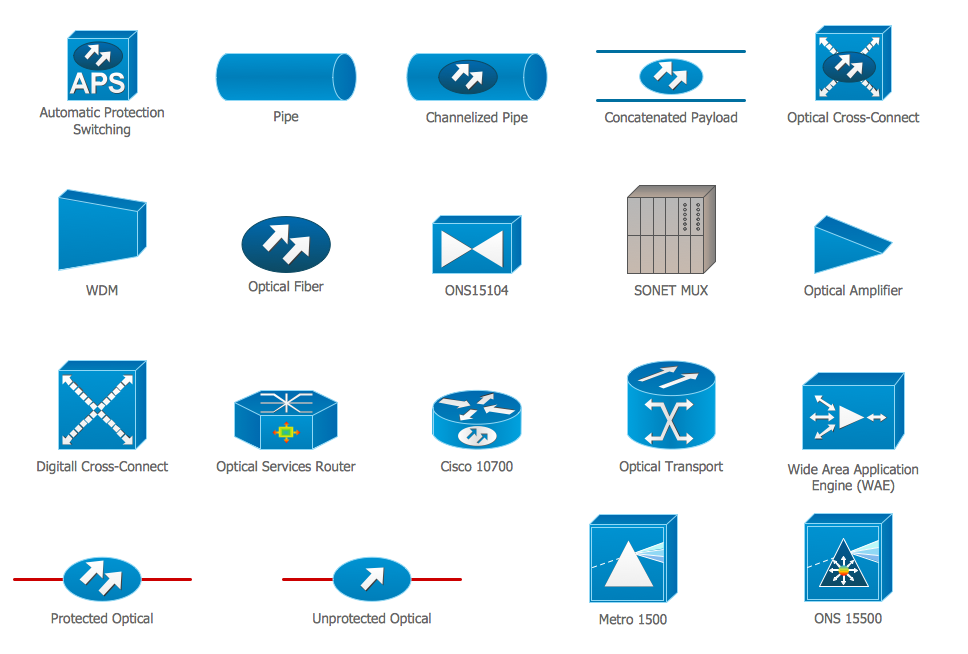
Picture: Cisco Optical. Cisco icons, shapes, stencils and symbols
Related Solution:
When thinking about data visualization, one of the first tools that comes to mind is a flowchart design. You can find flowchart symbols, shapes, stencils and icons easily on the Internet, but it might take time to systematize this information. Nevertheless, once you start flowcharting, you’ll love its simplicity and efficiency.
This diagram consists from standard flowchart symbols, approved by ANSI (American National Standard Institute) for drawing flowcharts. A flowchart is a diagram that represents a step-by-step algorithm of any process, displaying the process stages as boxes that are connected with arrows. Flowchart design makes it clear and readable.
Flowchart designed using ConceptDraw DIAGRAM flowchart software allows to make attractive and clear process presentation, it makes interpretation of the business process flow fresh and versatile. Great flowchart design view is a big advantage over the diagram created manually on a paper.
Picture: Flowchart Design: Principles, Layout, Symbols and Best Practices
Related Solution:
When studying computer science, it is important to have good training manuals. To understand how the networks and data links work, you will probably need a set of network diagram examples depicting all the possible interconnections between network devices. You can find them on Internet or try to create your own.
This example of a network topology diagram was made using ConceptDraw Computer and Network Diagrams solution. It represents a bus topology network diagram. A bus topology means that computers and peripherals in the network are connected to a mutual cable (backbone). This topology is often used for small networks. This diagram was designed using vector libraries of network equipment symbols. They also can be applied while creating various LAN and WAN diagrams.
Picture: Network Diagram Examples
The ConceptDraw vector stencils library Cisco People contains symbols for drawing the computer network diagrams.
Vector stencils library Cisco People contains 17 pictogram symbols and clipart for drawing the computer network diagrams using the ConceptDraw DIAGRAM diagramming and vector drawing software.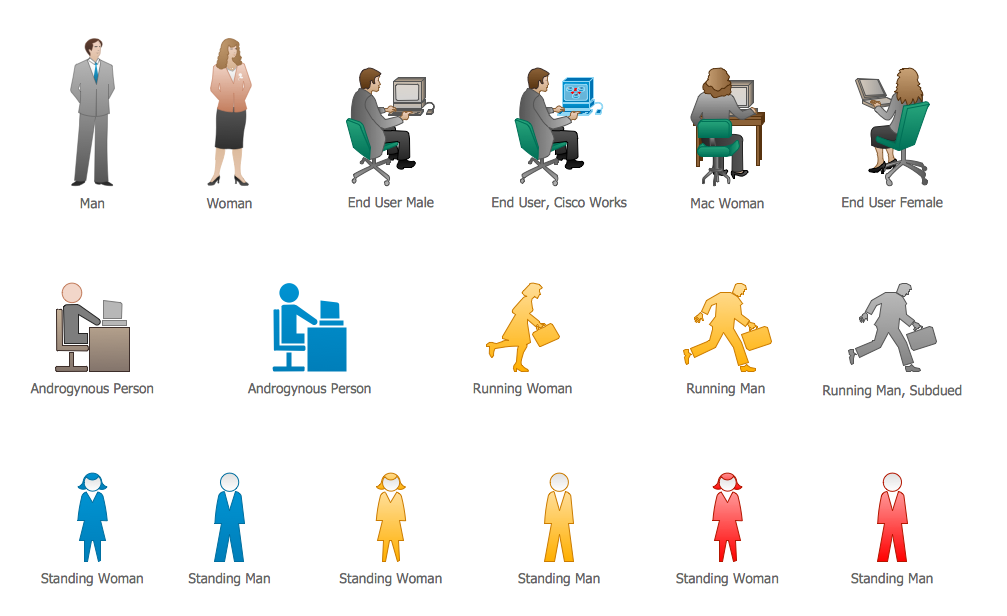
Picture: Cisco People. Cisco icons, shapes, stencils and symbols
Related Solution:
ConceptDraw
DIAGRAM 18