Cisco IBM.
Cisco icons, shapes, stencils and symbols
The ConceptDraw vector stencils library "Cisco IBM" contains 9 IBM device and equipment symbols for drawing the computer network diagrams using the ConceptDraw DIAGRAM diagramming and vector drawing software:
- IBM mainframe
- IBM mainframe with FEP
- FEP, Front End Processor
- Cluster Controller 3174 (Desktop Model)
- IBM Mini AS400
- Cluster Controller 3274 or 3174
- IBM tower
- Cluster Controller 3274 or 3174, Blue
- Cluster Controller 3174, Blue
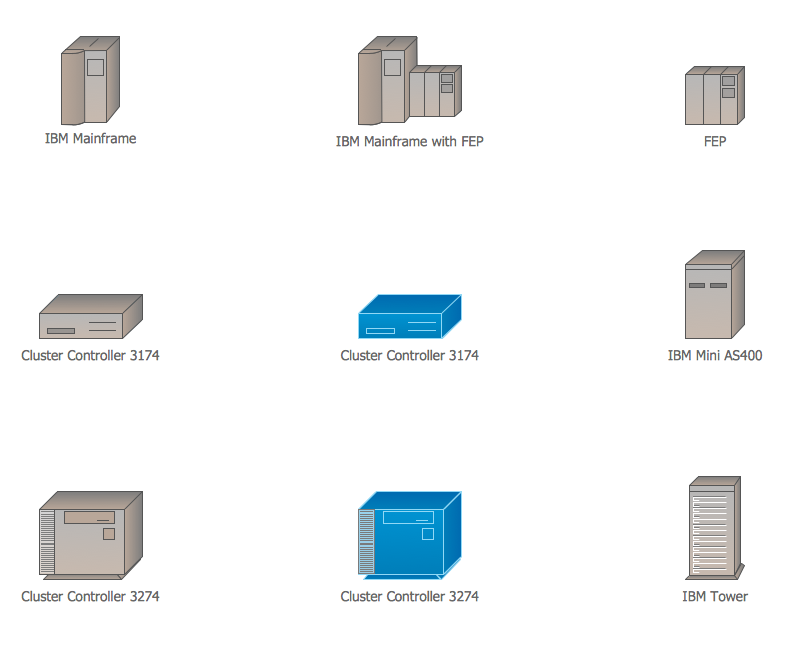


Sample 1. Design Elements — Cisco IBM (macintosh, windows)
for Network Diagrams.
The example "Design elements - Cisco IBM" is included in the Cisco Network Diagrams solution from the Computer and Networks area of ConceptDraw Solution Park.

Example 2. Cisco Solution
Icons, shapes, stencils, symbols and design elements for Cisco Network Diagrams:
TEN RELATED HOW TO's:
ConceptDraw DIAGRAM is the only application on the Macintosh platform, supplied with a comprehensive Cisco icon set. For graphic solutions that support Windows, only Microsoft Visio has a library of Cisco shapes. ConceptDraw DIAGRAM is a valuable option to many network professionals that use Macintosh computers or work in a combined Mac and PC environment.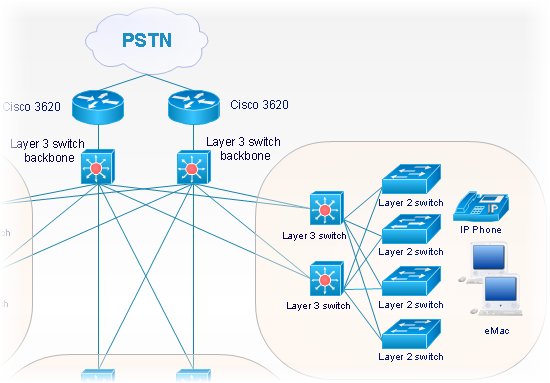
Picture: Cisco Network Objects in ConceptDraw DIAGRAM
In general, you can use any icons to represent network equipment on a diagram. However, there are some icons, for instance, Cisco icons, shapes, stencils and symbols, that are recognizable worldwide. Using those icons you can create Cisco network topology diagrams in minutes and share them anywhere.
The icons depicting Cisco network equipment are recognized and generally applied as standard images for designing network diagrams. They are free to used , but can not be reworked. Cisco network diagrams are created to depict how signals processed on the network equipment and end-user computers and how data transfer through LAN or WLAN between nodes. The vector graphic library of ConceptDraw CISCO Network Diagrams solution includes about 90 icons of Cisco network equipment for designing computer network diagrams with ConceptDraw DIAGRAM.
Picture: Cisco Network Topology. Cisco icons, shapes, stencils and symbols
Related Solution:
The ConceptDraw vector stencils library Cisco Optical contains symbols for drawing the computer network diagrams.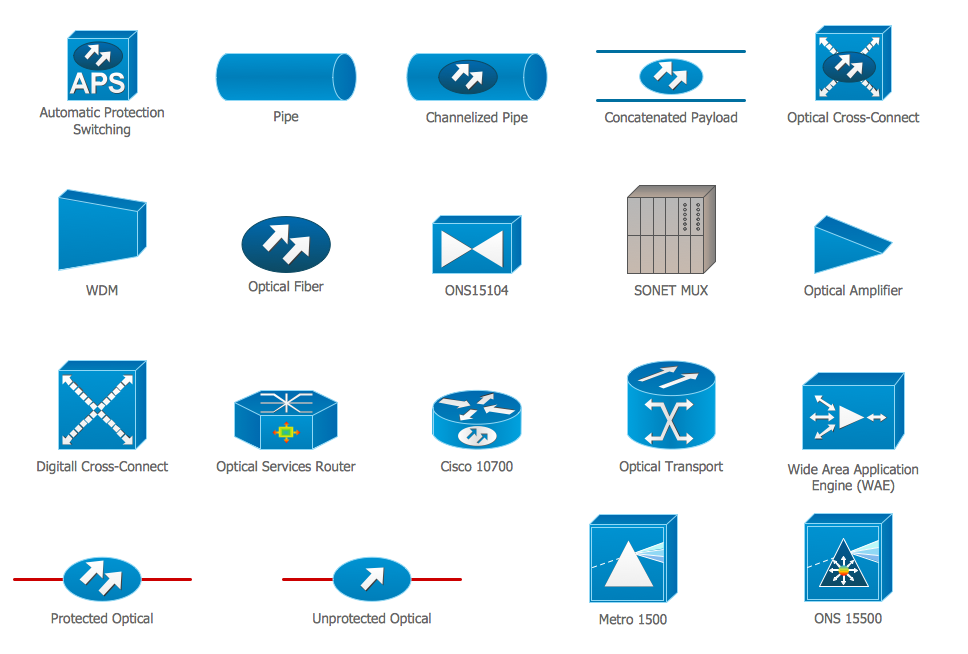
Picture: Cisco Optical. Cisco icons, shapes, stencils and symbols
Related Solution:
ConceptDraw DIAGRAM extended with the Rapid UML solution is perfect for drawing professional UML diagrams.
Picture: How to create a UML Diagram
Related Solution:
This sample was created in ConceptDraw DIAGRAM diagramming and vector drawing software using the UML Deployment Diagram library of the Rapid UML Solution from the Software Development area of ConceptDraw Solution Park.
This sample shows the work of the ATM (Automated Teller Machine) banking system that is used for service and performing of the banking transactions using ATMs. System engineers can use comprehensive UML diagrams solution.
Picture: UML Deployment Diagram Example - ATM SystemUML diagrams
Related Solution:
The ConceptDraw vector stencils library Cisco People contains symbols for drawing the computer network diagrams.
Vector stencils library Cisco People contains 17 pictogram symbols and clipart for drawing the computer network diagrams using the ConceptDraw DIAGRAM diagramming and vector drawing software.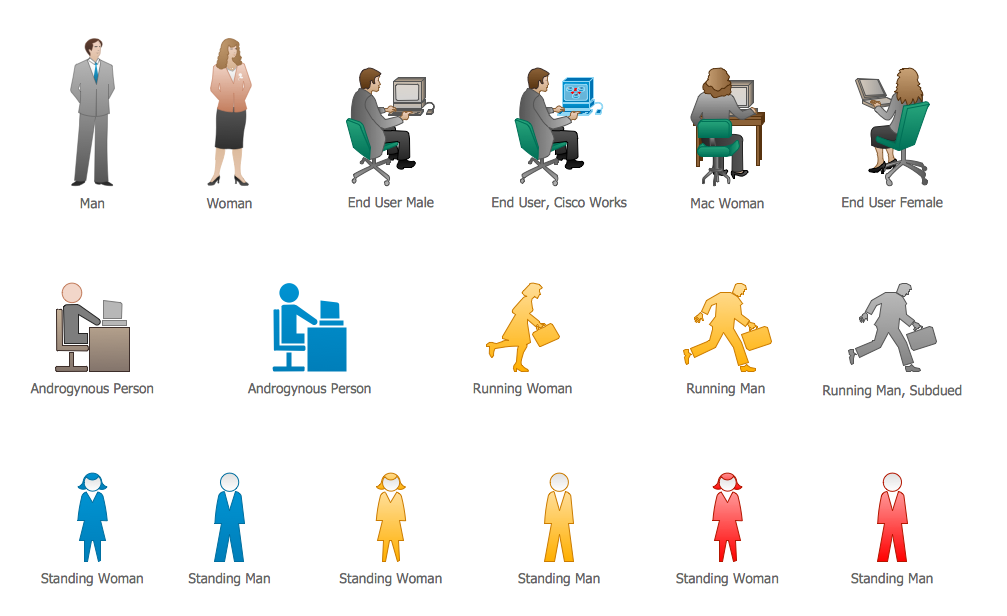
Picture: Cisco People. Cisco icons, shapes, stencils and symbols
Related Solution:
The Cloud Computing Architecture is the structure of the system, which is based on the needs of end-user and includes the set of components and subcomponents required for cloud computing, among them cloud resources, services, middleware, software components, front-end platforms (cloud clients), cloud-based back end platforms (servers, storage), and a network (Internet, Intranet, Intercloud). When designing the Cloud Computing Architecture diagrams, the ConceptDraw DIAGRAM diagramming and vector drawing software advises to turn attention for the powerful Cloud Computing Diagrams solution from the extensive Computers and Network area of ConceptDraw Solution Park.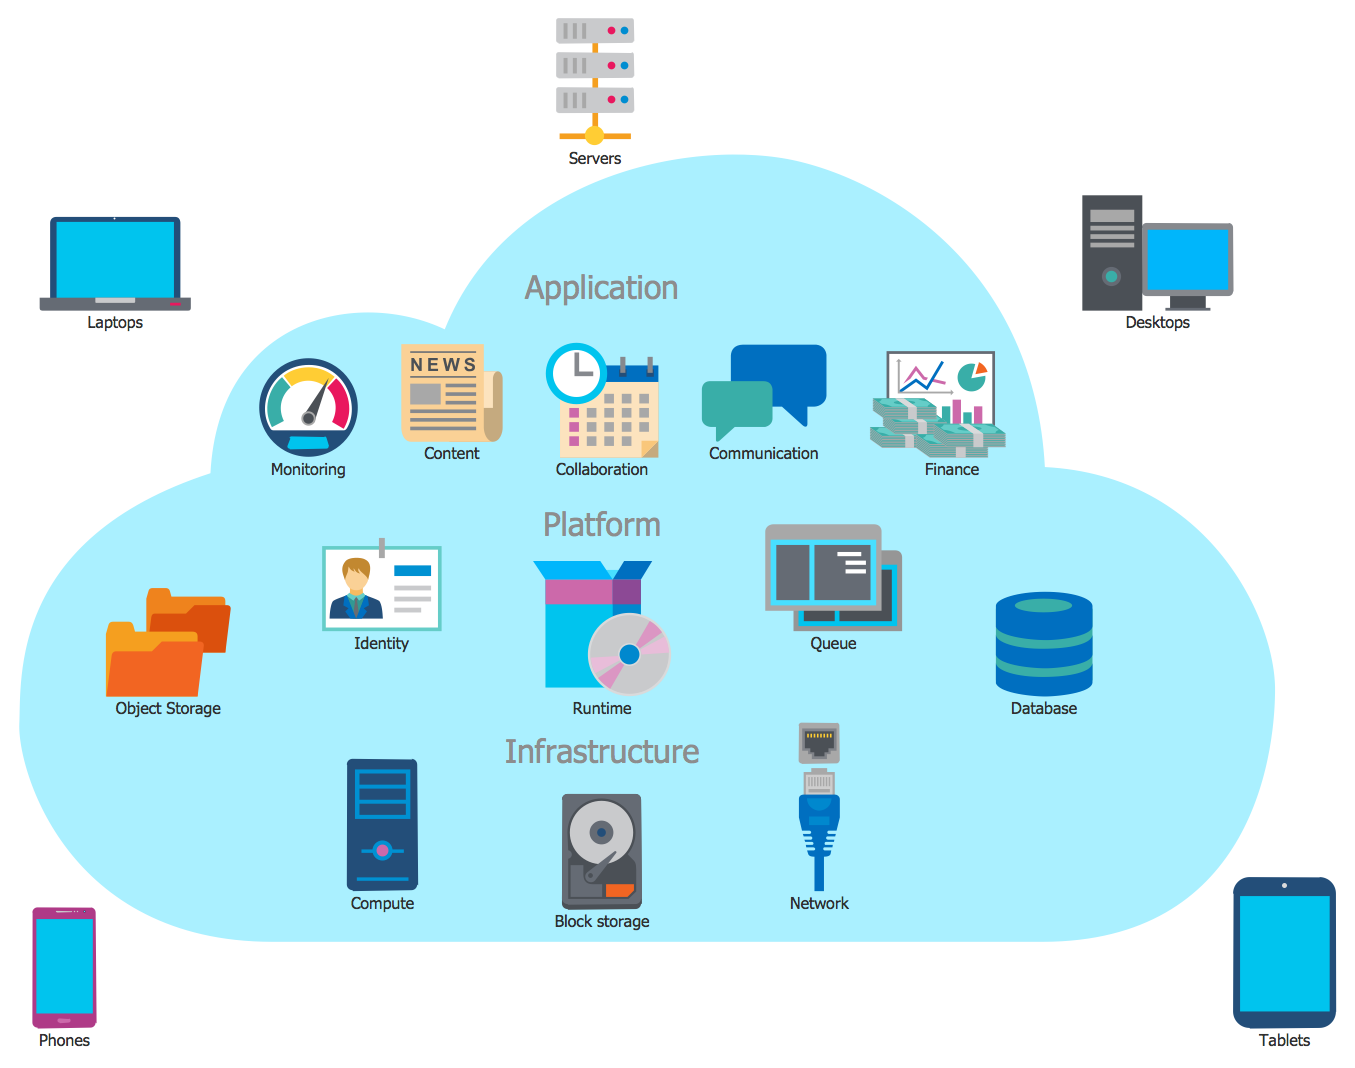
Picture: Cloud Computing Architecture
Related Solution:
Use the set of special professionally developed swim lane flowchart symbols - single, multiple, vertical and horizontal lanes from the Swimlanes and Swimlanes BPMN 1.2 libraries from the Business Process Diagram solution, the Swim Lanes library from the Business Process Mapping solution as the perfect basis for your Swim Lane Flowcharts of processes, algorithms and procedures.
Picture: Swim Lane Flowchart Symbols
Related Solution:
The ConceptDraw vector stencils library Cisco Telepresence contains videoconference equipment symbols for drawing the computer network diagrams.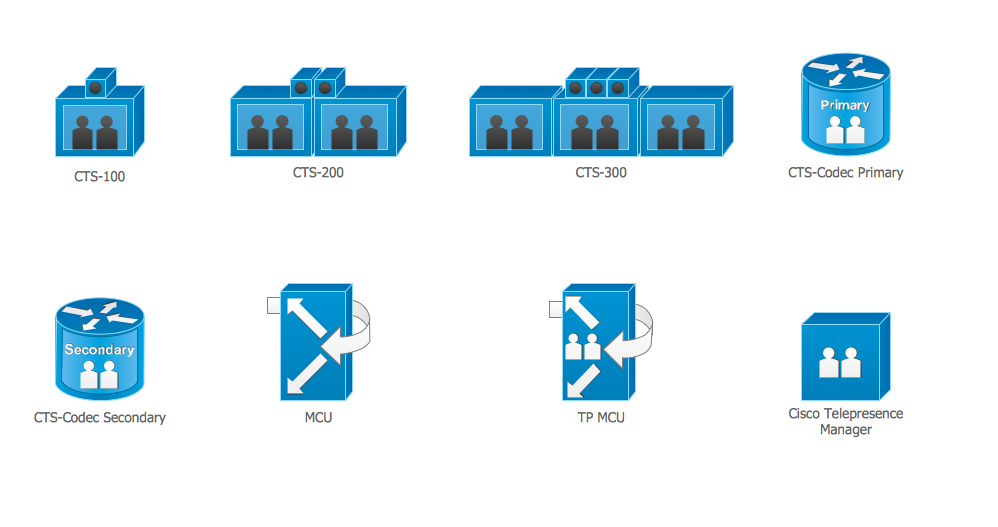
Picture: Cisco Telepresence. Cisco icons, shapes, stencils and symbols
Related Solution:
The use of the special software with Plant Design Solutions is a real help for effective creating the Plant Plan, Plant Layout Plan, Process Plant Layout, Plant Design. ConceptDraw DIAGRAM is the best diagramming and vector drawing software. It offers the Plant Layout Plans Solution from the Building Plans Area for achievement this goal.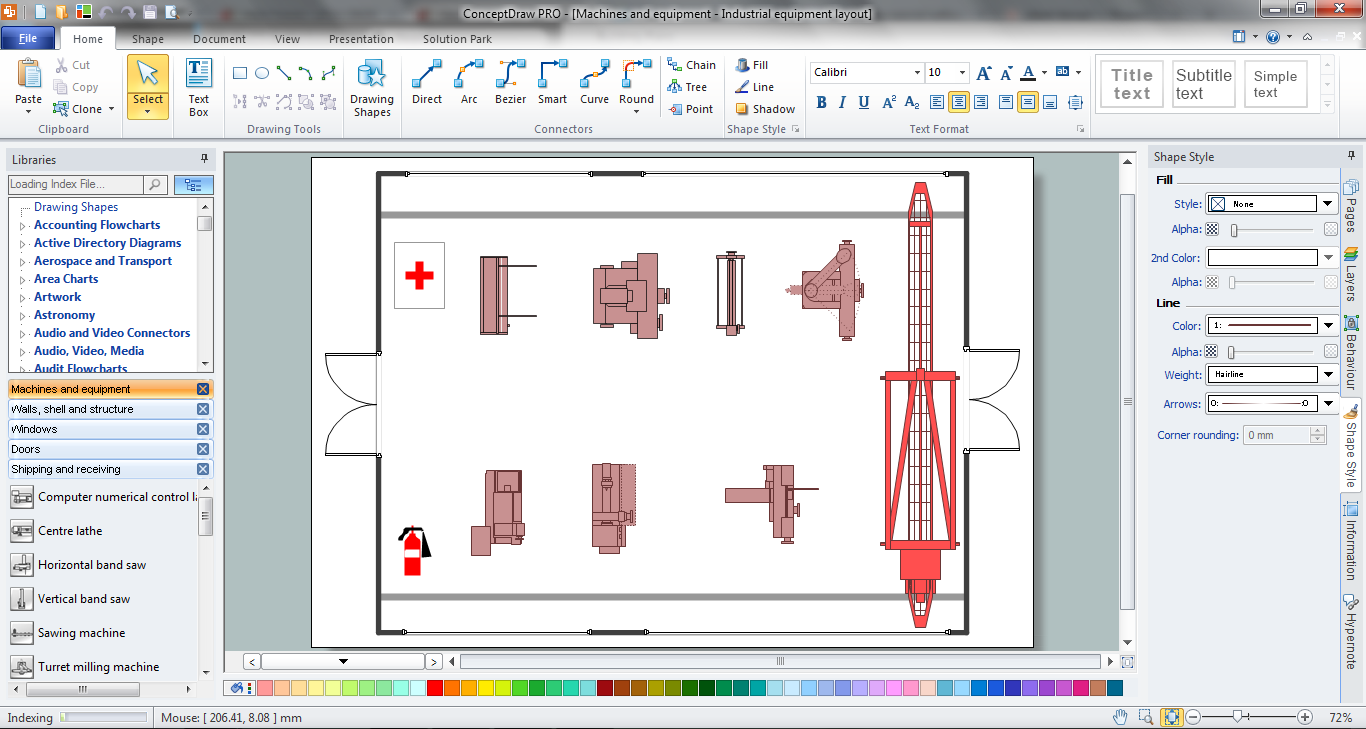
Picture: Plant Design Solutions
Related Solution:
ConceptDraw
DIAGRAM 18