Business Productivity - Quality
QualityBenefitsQuality Management Diagrams (Total Quality Management Diagrams, Timelines, Workflows, Value Stream Maps) and Mind Maps (Presentations, Meeting Agendas, Problem to be solved). ObjectiveVisually document and communicate quality management information. Solution PurposeQuality management diagrams and mind maps are effective and easy to use. Intended ForIndividuals involved in product/service quality planning, control, assurance and improvement using visual documenting and communication. Products and methodsTo support you in your tasks you can use the power of ConceptDraw DIAGRAM providing intelligent vector graphics that are useful for Quality Solution diagramming and ConceptDraw MINDMAP for key Quality Solution mind maps. |
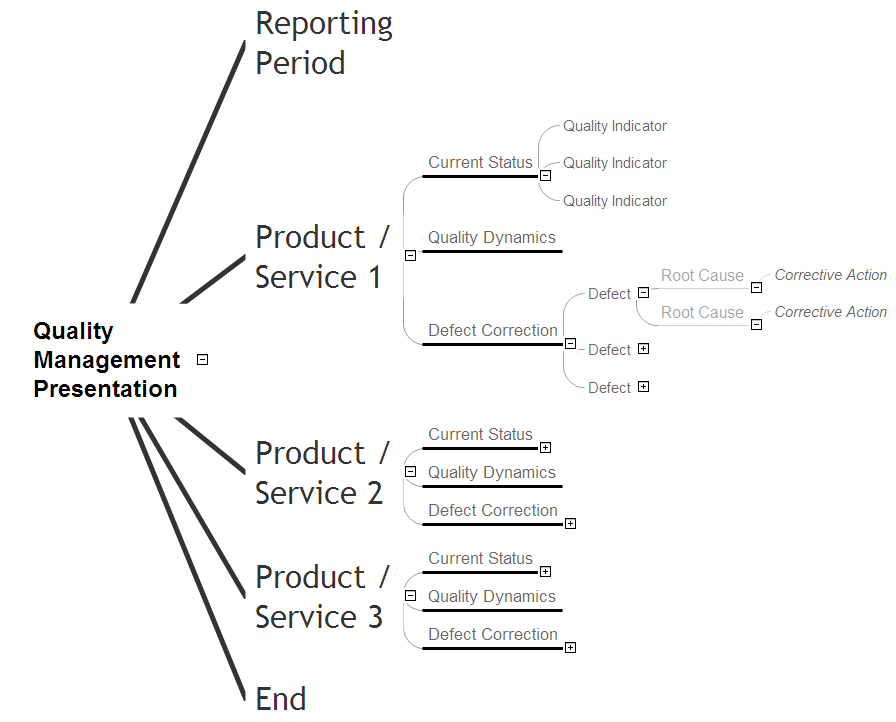
Example 1. Quality Presentation

Example 2. Quality Meeting
The Benefits for ConceptDraw MINDMAP Brainstorming Software
- ConceptDraw MINDMAP is effective for brainstorming, designing mind maps, idea generating, creative and lateral thinking, creativity and problem solving.
- ConceptDraw MINDMAP is ideal for team and personal work in Business, Marketing and Project Management.
- The libraries with large quantity of vector objects help to illustrate your mind maps and to make them bright, visual and comprehensible.
- Use of View Navigator tool lets create presentations from a mind map: you can simply select the map parts you want to present, sequence your slides, and preview the presentation.
- ConceptDraw MINDMAP provides wide capabilities of importing and exporting in various formats: Microsoft PowerPoint, Microsoft Word, MS Excel, Mindjet MindManager, image, HTML, PDF file.
FOUR RELATED HOW TO's:
Mind map that organizes tasks, resources, outcomes and people for a marketing research project.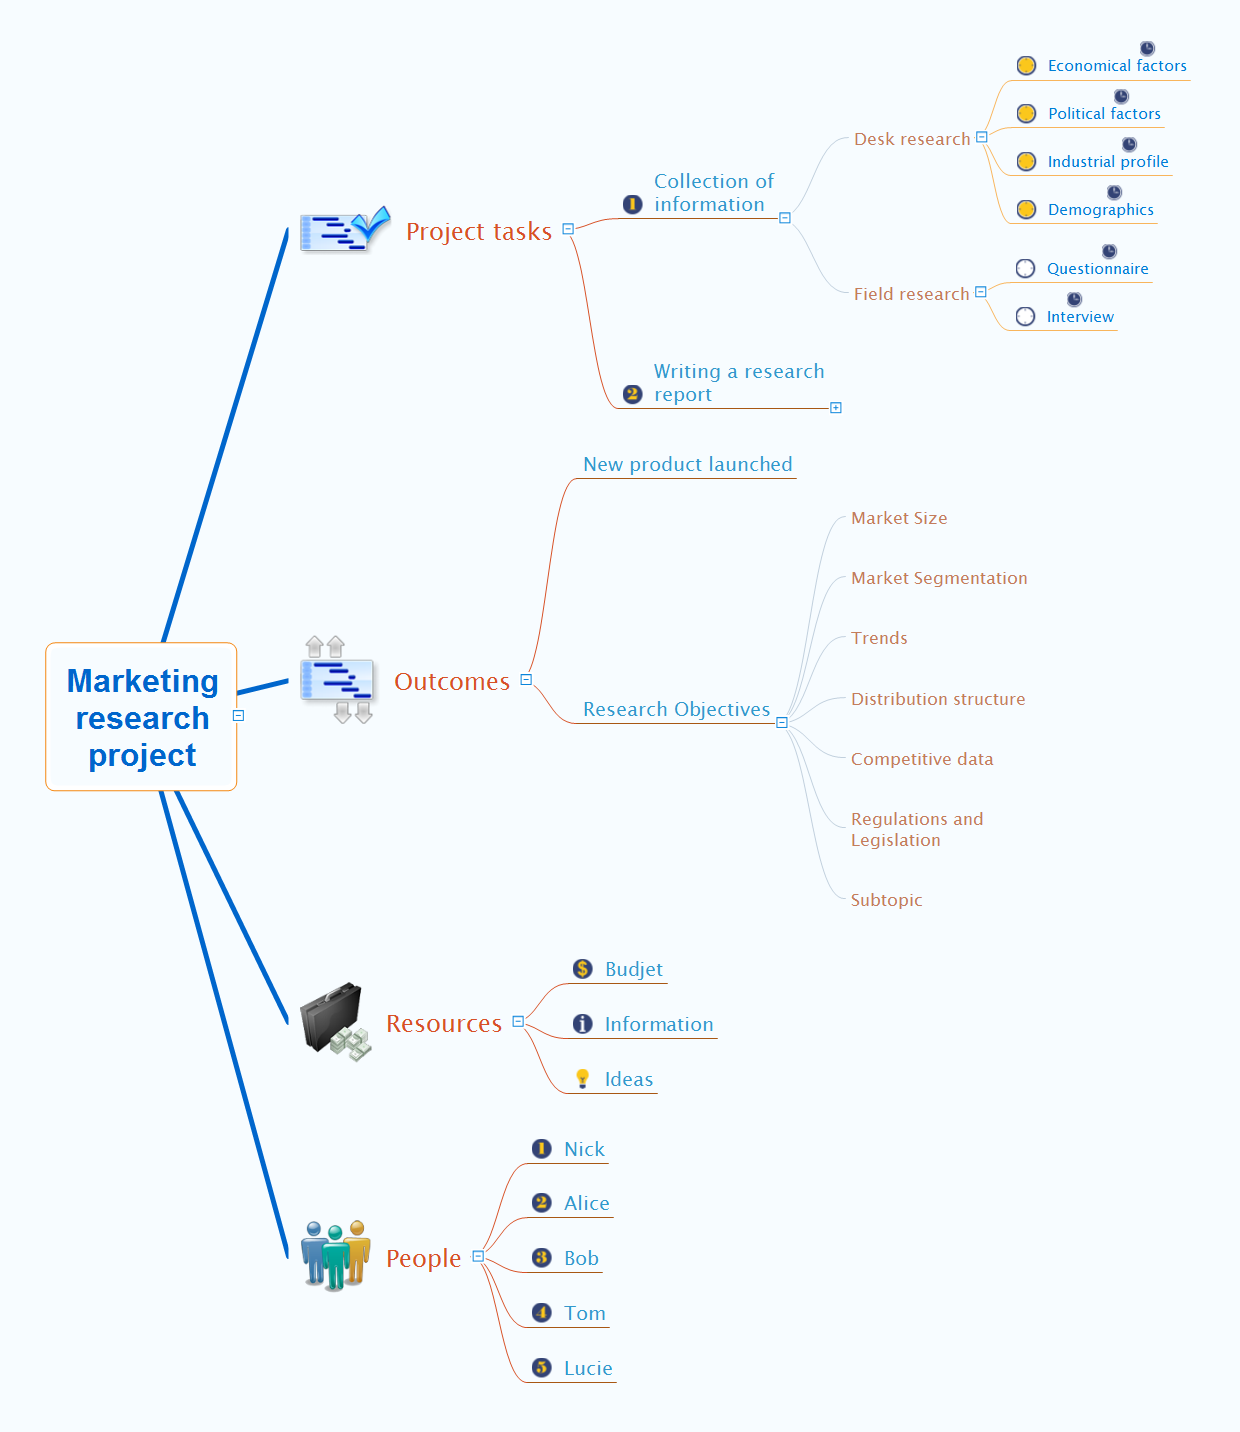
Picture: Marketing Research Project
Related Solution:
Learning Presentation using mindmaps. ConceptDraw MINDMAP is Frequently used tool for presentations, remote trainings via Skype and webinars.
Picture: Create Learning Presentation using mindmaps
Related Solution:
Presentation with Steel style in ConceptDraw DIAGRAM with illustrations and notes from mind map document.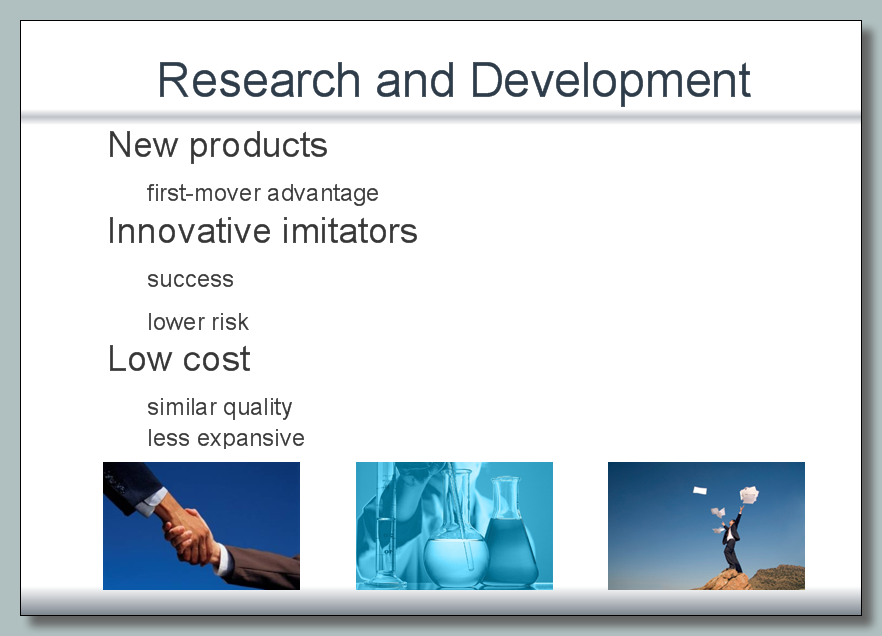
Picture: Steel Presentation
Related Solution:
The efficiency of any corporate network depends on many factors such as equipment, architecture etc. Moreover, every administer knows that network architecture is a cornerstone for any system. Also, it's easy to make a draft of a network structure using an appropriate diagramming tool.
Designing network architecture diagrams refers to the network structure, including hardware, software, connectivity, protocols of communication and type of transmission: wired or wireless. A high performance, highly reliable, and secure network architecture is critical for the successful deployment and operation of modern communication network. This diagram represents in detail the sample of the network architecture of the three-divisional office. It is designed using vector libraries supplied with ConceptDraw Computer and Networks solution.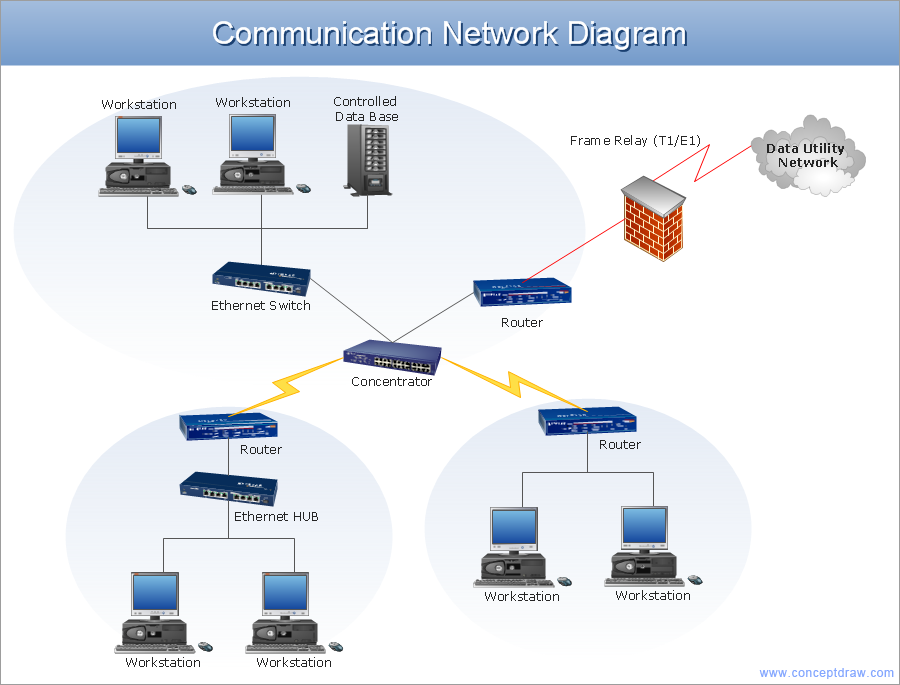
Picture: Network Architecture
Related Solution:
ConceptDraw
MINDMAP 16