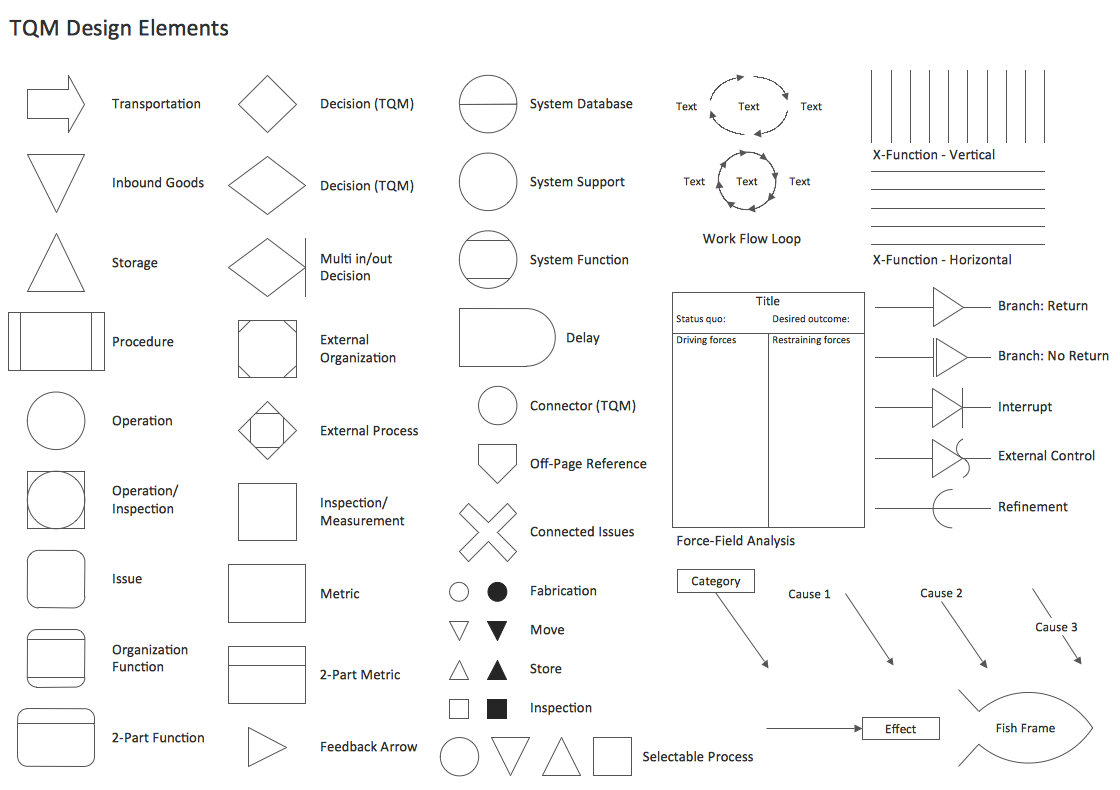
Example 1. TQM Tools - TQM Diagram Library Design Elements
Just look for the vector elements included in the TQM Diagram library of Total Quality Management (TQM) Diagrams Solution and immediately becomes clear how simple is designing various TQM diagrams and drawings in ConceptDraw DIAGRAM software.

Example 2. TQM Diagram Template
Among the useful TQM tools offered by the Total Quality Management (TQM) Diagrams Solution are the TQM samples and TQM Diagram template. Filling template is the most quick way of drawing. Try and make sure this!

Example 3. Workflow Diagram
This Workflow Diagram was created in ConceptDraw DIAGRAM software using the TQM tools of the Total Quality Management (TQM) Diagrams Solution. An experienced user spent 10 minutes creating this sample.
Use the Total Quality Management (TQM) Diagrams Solution for ConceptDraw DIAGRAM software to create your own TQM diagrams and schemes of any complexity quick, easy and effective.
All source documents are vector graphic documents. They are available for reviewing, modifying, or converting to a variety of formats (PDF file, MS PowerPoint, MS Visio, and many other graphic formats) from the ConceptDraw STORE. The Total Quality Management (TQM) Diagrams Solution is available for all ConceptDraw DIAGRAM or later users.
SEVEN RELATED HOW TO's:
ConceptDraw DIAGRAM enhanced with Seven Basic Tools of Quality solution from the Quality area of ConceptDraw Solution Park is an ideal software for fast and easy drawing professional looking quality diagrams, including a Fishbone diagram.
Picture: Seven Basic Tools of Quality - Fishbone Diagram
Related Solution:
Chemical and Process Engineering solution contains variety predesigned process flow diagram elements relating to instrumentation, containers, piping and distribution necessary for chemical engineering, and can be used to map out chemical processes or easy creating various Chemical and Process Flow Diagrams in ConceptDraw DIAGRAM.
Picture: Process Flow Diagram Symbols
Related Solution:
When you are connecting existing objects you can control the diagram structure by changing selection order.
This is how diagramming software should work. You are able to draw a diagram as quickly as the ideas come to you.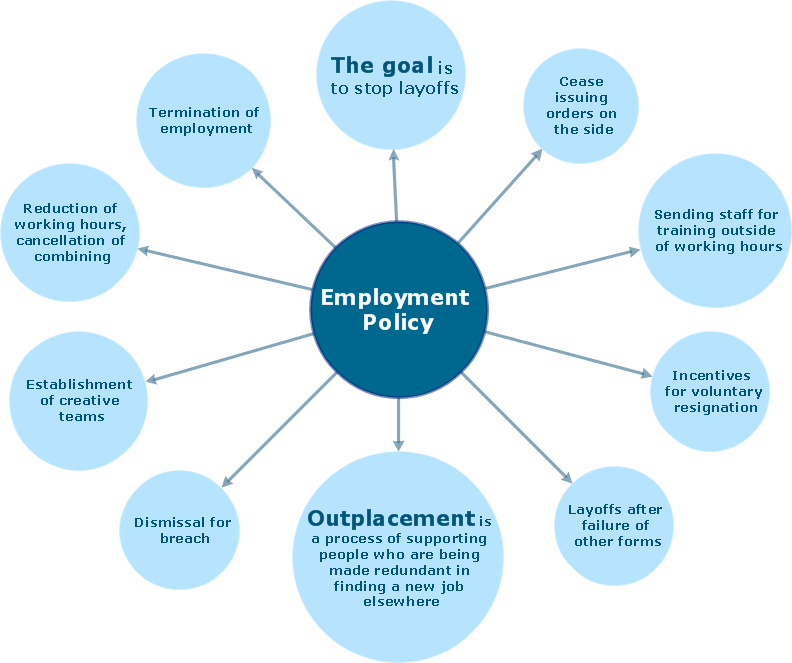
Picture: ConceptDraw Arrows10 Technology
Network Diagrams visualize schematically the computer networks topology, equipment nodes and different types of their logical and physical connections. They are widely used by IT professionals to visually document the topology and design of computer and telecommunication networks.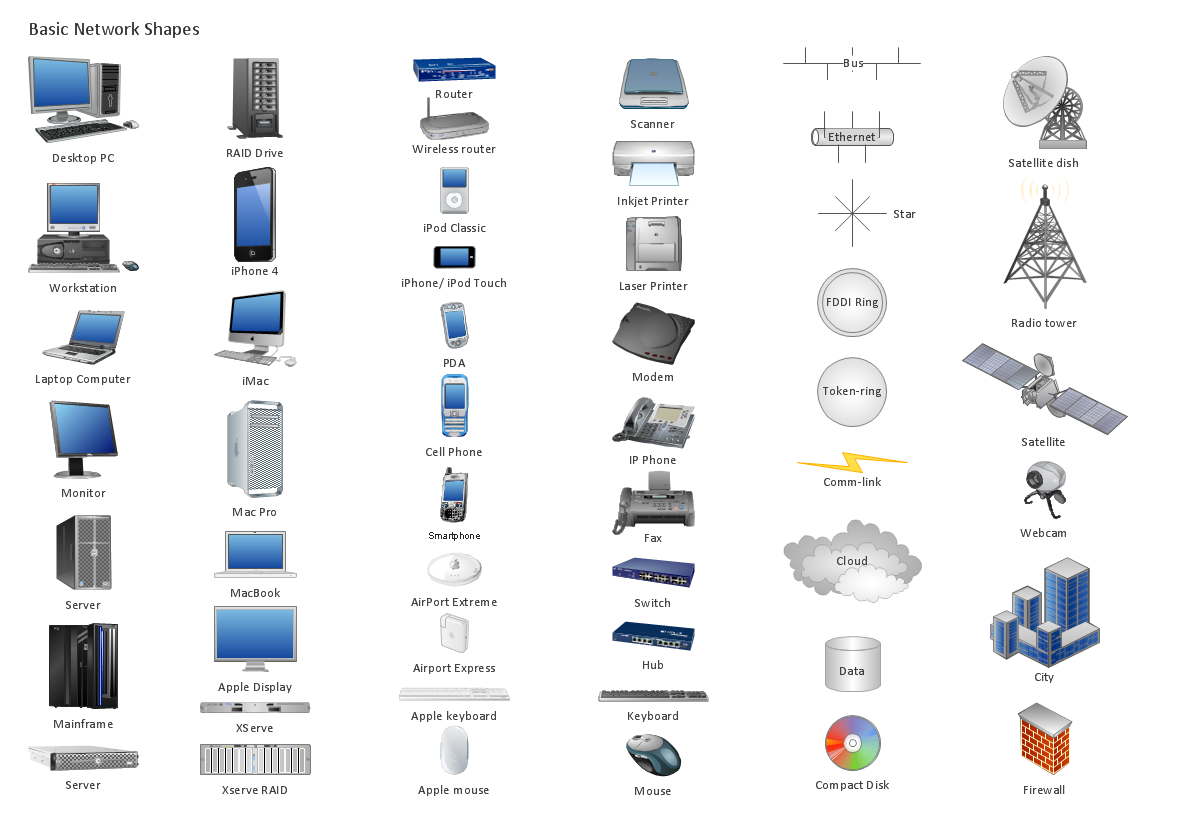
Picture: Computer Networking Tools List
Related Solution:
House of Quality Matrix Software - Use the predesigned objects from the Involvement Matrix Objects Library from the Seven Management and Planning Tools Solution to create professional looking House of Quality Matrices in minutes.
Picture: House of Quality Matrix Software
Related Solution:
Many things can be listed as potential strengths and weaknesses of a company. To create a good-looking scheme, use SWOT analysis software and enjoy the results within a few minutes. A good practice is to make a SWOT analysis twice a year.
These drawings illustrate the possibilities of ConcptDraw solution for building SWOT and TOWS Matrices. SWOT analysis matrix demonstrates this widely used method for detection of Strengths and Weaknesses, Opportunities and Threats facing any business. If SWOT analysis is carried out properly, it can help to build a good position in the market. The ConceptDraw SWOT and TOWS Analysis solution provides a great number of templates of both SWOT and TOWS matrices. Moreover, this is the only software that offers to carry out SWOT analysis starting from making mind maps. The solution contains SWOT mind map templates. A single mouse click is needed to turn the SWOT mind map into a SWOT matrix. The SWOT diagram will be created in ConceptDraw DIAGRAM on the base of SWOT mind map.
Picture: SWOT Analysis Software: Comprehensive Guide
The Total Quality Management Diagram solution helps your organization visualize business and industrial processes. Create Total Quality Management diagrams for business process with ConceptDraw software.
Picture: Identifying Quality Management System
Related Solution:

