UML 2 4 Process Flow Diagram
This sample was created in ConceptDraw DIAGRAM diagramming and vector drawing software using the UML Use Case Diagram library of the Rapid UML Solution from the Software Development area of ConceptDraw Solution Park.
This sample shows the work of the taxi service and is used by taxi stations, by airports, in the tourism field and delivery service.
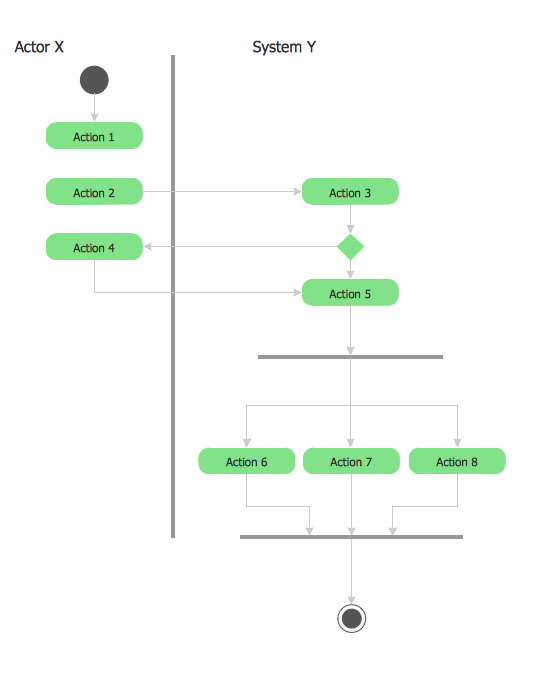
Example 1. UML 2 4 Process Flow Diagram
Using the libraries of the Rapid UML Solution for ConceptDraw DIAGRAM you can create your own visual vector UML diagrams quick and easy.
UML Resource:
- UML Software
- How to create a UML Diagram
- UML Diagram Examples
- Class Diagram
- Use Case Diagram
- Timing Diagram
- Interaction Overview Diagram
- Communication Diagram
- State Machine Diagram
- Activity Diagram
- Deployment Diagram
- Package Diagram
- Collaboration Diagram
- Object Diagram
- Sequence Diagram
- Composite Structure
- Component Diagram
TEN RELATED HOW TO's:
The Value Stream Mapping solution continues to extend the range of ConceptDraw DIAGRAM into a business graphics tool that can be used to document processes of Lean Manufacturing.
Picture: Lean Manufacturing Diagrams
Related Solution:
UML Timing Diagram as special form of a sequence diagram are used to explore the behaviors of objects throughout a given period of time.
Picture: Diagramming Software for Design UML Timing Diagrams
The Rapid UML solution provides diagram examples, templates and vector stencils libraries for quick and easy drawing all types of UML 2.x and 1.x diagrams
Picture: UML Business Process
Related Solution:
The UML Diagrams are widely used by software developers and software engineers. They can draw the UML Diagrams manually on the paper, but it is incredibly convenient to use the special UML diagramming software. The UML diagramming software allows you to draw the UML Diagrams in a few minutes.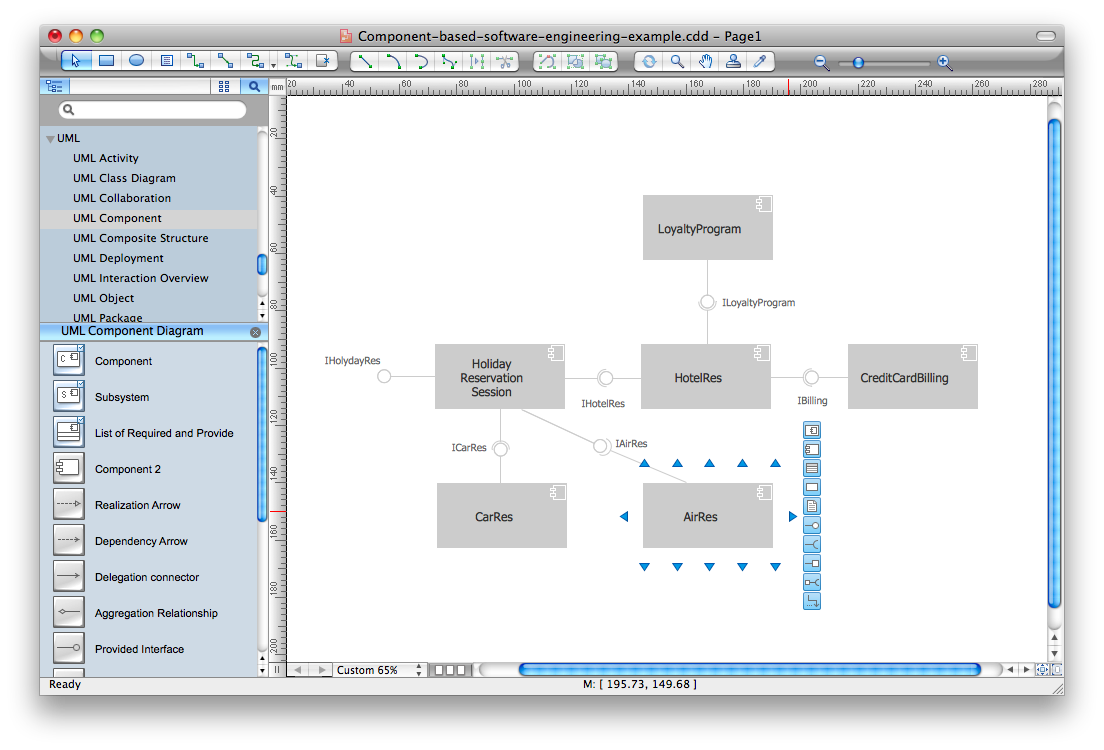
Picture: UML Diagram Software
Related Solution:
UML Interaction Overview Diagram schematically shows a control flow with nodes and a sequence of activities that can contain interaction or sequence diagrams.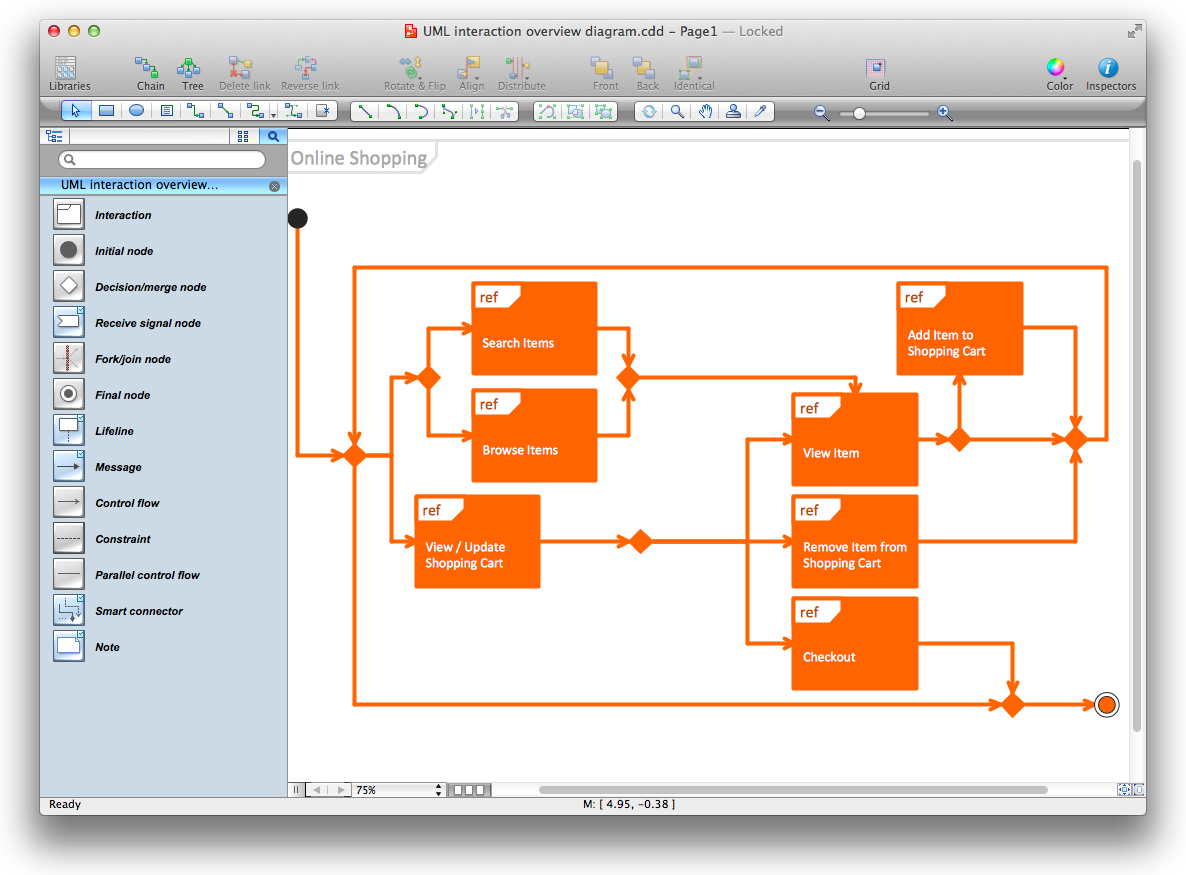
Picture: Diagramming Software for Design UML Interaction Overview Diagrams
ConceptDraw DIAGRAM diagramming and vector drawing software as a sequence diagram tool provides the Rapid UML Solution from the Software Development Area that contains the UML Sequence library.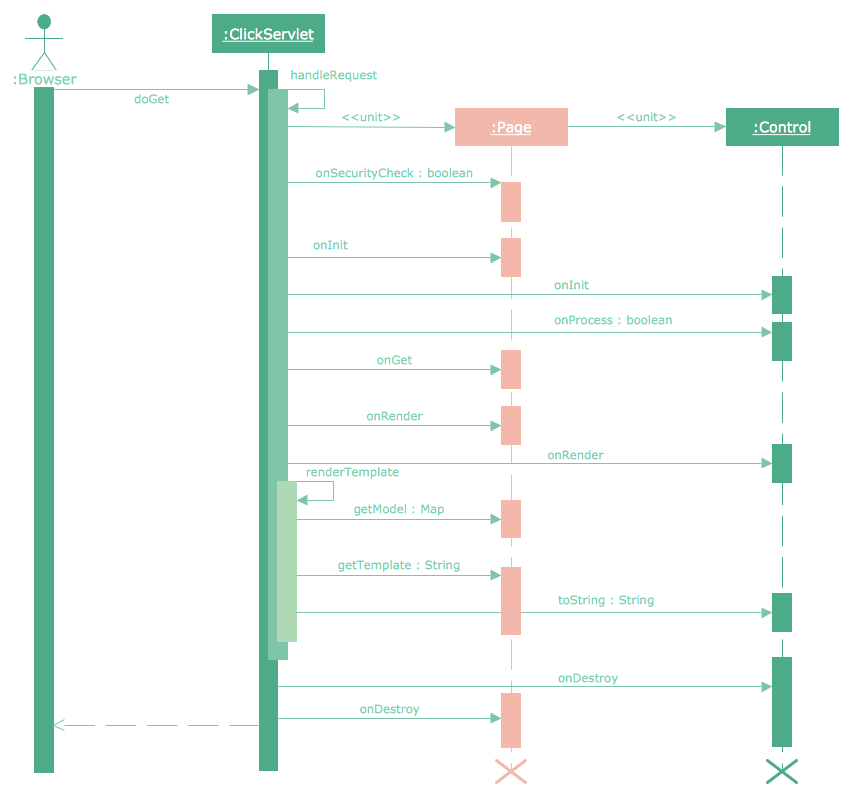
Picture: Sequence Diagram Tool
Related Solution:
The first thing that usually comes to mind when talking about database models is ER-diagrams, and the ways to create them. The second most recognizable notation is the Crow’s Foot, which visually differs from Chen’s notation. Actually, it doesn’t matter which notation you’ll use for your entity relationship diagram (ERD), but the content is what matters.
When designing an Entity-Relationship Diagram one need to use a certain notated symbols that were developed and standardized especially for databases description. First of them - the Chen’s notation had a linguistic origin. It includes rectangle boxes to show entities that may be described as nouns, and the relationships between them described as verbs depicted in a form of diamond. Finally the Chen’s notation was simplified up to the Crow’s Foot notation. It represents a relationship as labeled line. It is precisely this notation is shown in the given figure. ConceptDraw DIAGRAM together with its Entity-Relationship Diagram (ERD) solution is designed to support professionals who deals with creating ER diagrams using the element of both - Chen’s and Crow's Foot notations.
Picture: Design Element: Crows Foot for Entity Relationship Diagram - ERD
Related Solution:
It’s very simple and quick to create the UML Diagrams using the Rapid UML Solution for ConceptDraw DIAGRAM. This sample was created in 10 minutes.
This sample describes the credit card processing system. It’s a UML Class Diagram with generalization sets. This sample can be used by the banks, business and financial companies, exchanges.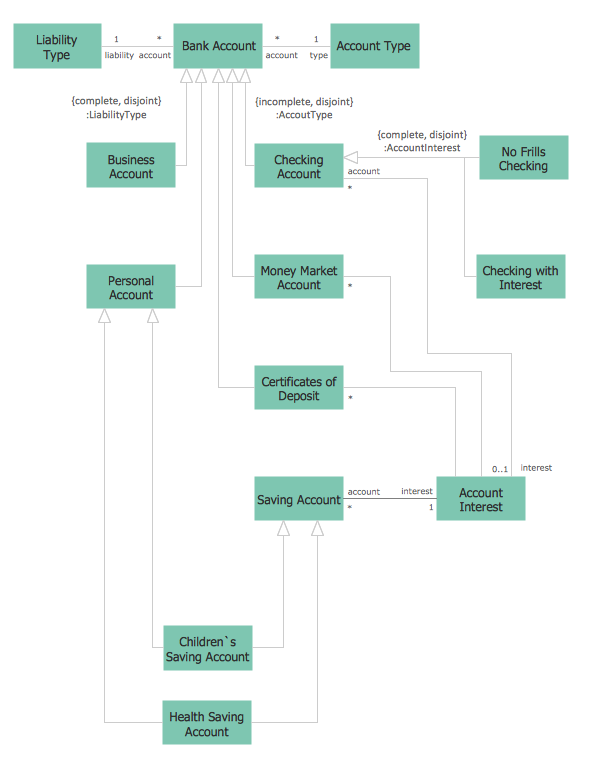
Picture: UML in 10 mins
Related Solution:
Interior design is an art of planning and coordinating the space in a building or on a floor to produce a charming and convenient environment for the client. You can ask professionals for help, or you can create floor plans easily with ConceptDraw DIAGRAM , using diverse libraries or altering numerous templates. You don’t need no formal training anymore to be a designer, isn’t it great?
Using a ConceptDraw DIAGRAM floor plan software makes depicting of home or office layout ideas a simple task. It does not require special skills to make detailed and scaled floor plans. Adding furniture to design interior is also a breeze. You can draw and furnish your floor plans with a floor plan software. Moreover, using software for floor planning you gain an opportunity to share your plans and high-resolution images of your designs with clients or stakeholders.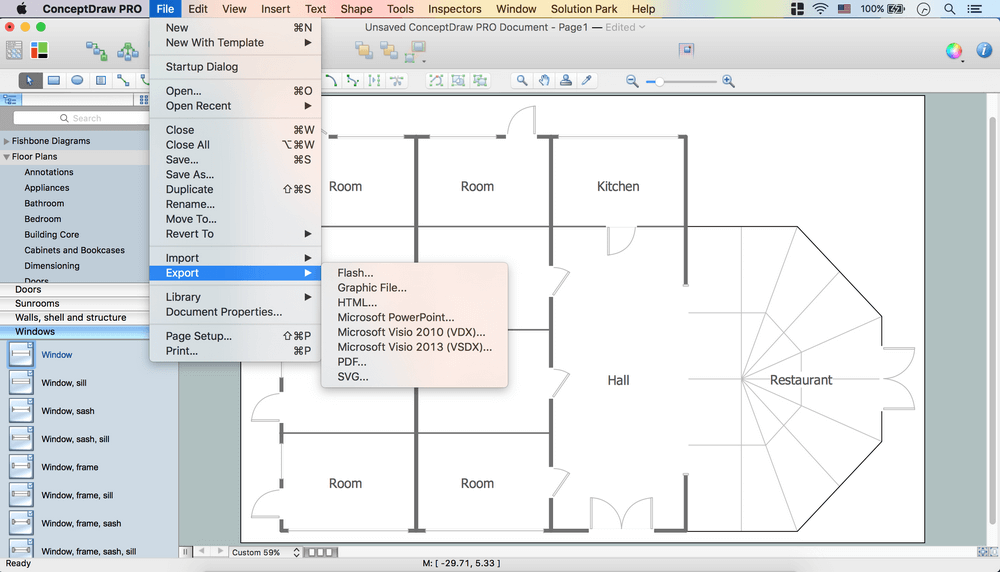
Picture:
Create Floor Plans Easily
with ConceptDraw DIAGRAM Floor Design Software
Related Solution:
ConceptDraw MINDMAP is the most productive tool you can use to solve problems and generate yout great ideas.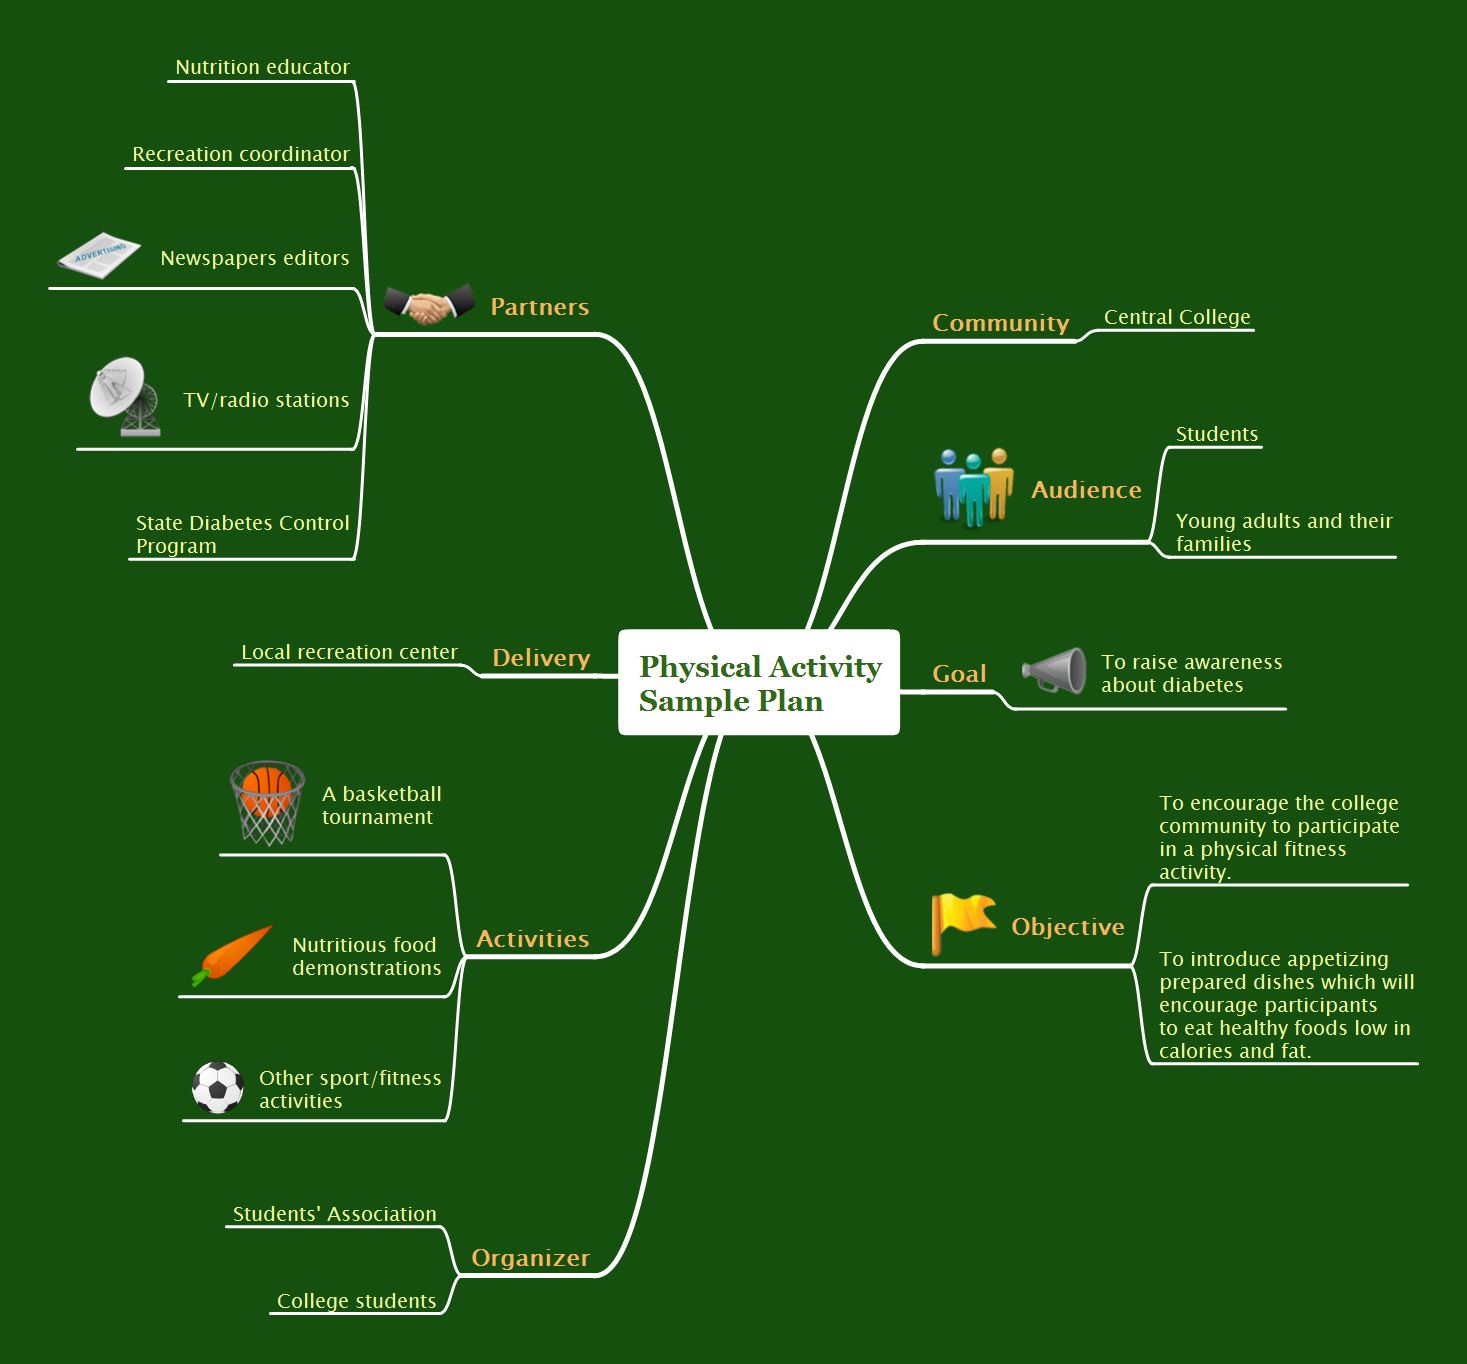
Picture: Professional & Powerful Mind Mapping Software
Related Solution:
ConceptDraw
DIAGRAM 18