How should diagramming software work? Is it possible to develop a diagram as quickly as the ideas come to you?
The innovative ConceptDraw Arrows10 Technology included in ConceptDraw DIAGRAM is a powerful drawing tool that changes the way diagrams are produced.
While making the drawing process easier and faster.
ConceptDraw DIAGRAM is a powerful tool that helps you create a process map diagram quickly and easily. Fine-tuning the objects in ConceptDraw DIAGRAM allows you to create a really professional finished article. ConceptDraw Arrows10 Technology gives drawing connectors a smart behavior that provides quick and precise placement, allows for easy changes and automatic rearrangement.
There are two ways that connectors behave when moving connected objects.
When using a shapes′ center connection the connection becomes dynamic, the connector will trace the contour of the object, when moving the object inside your diagram.
Using any other connection point provides a static connection, when you move connected objects the connector stays attached to the same point.
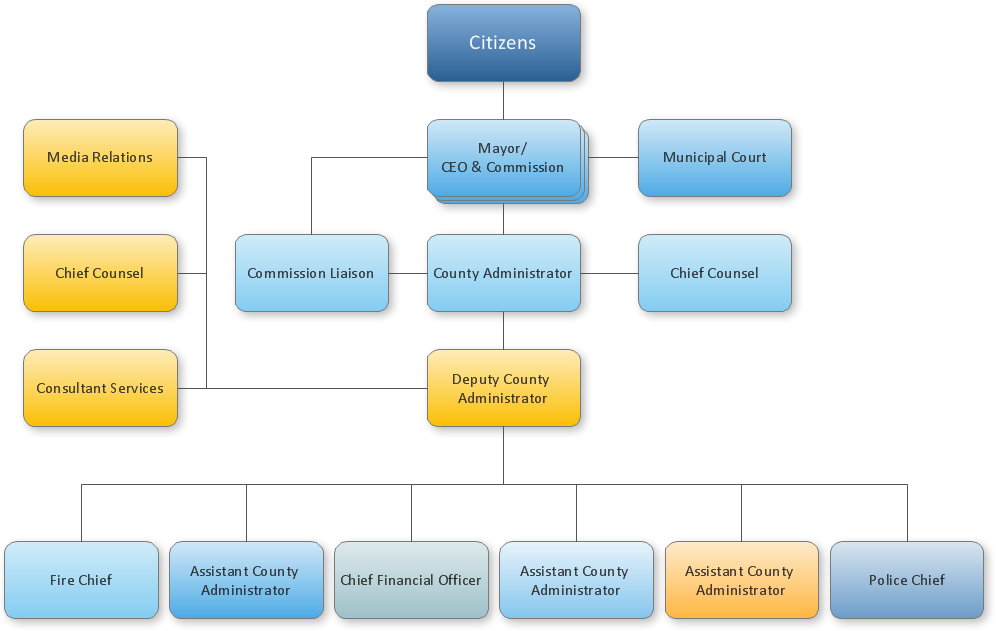
Sample 1. Organizational chart - County administrator office.
ConceptDraw DIAGRAM diagramming software provides vector shapes and connector tools for quick and easy drawing diagrams for business, technology, science and education.
Use ConceptDraw DIAGRAM enhanced with solutions from ConceptDraw Solution Park to create diagrams to present and explain structures, process flows, logical relationships, networks, and other visually organized information and knowledge.
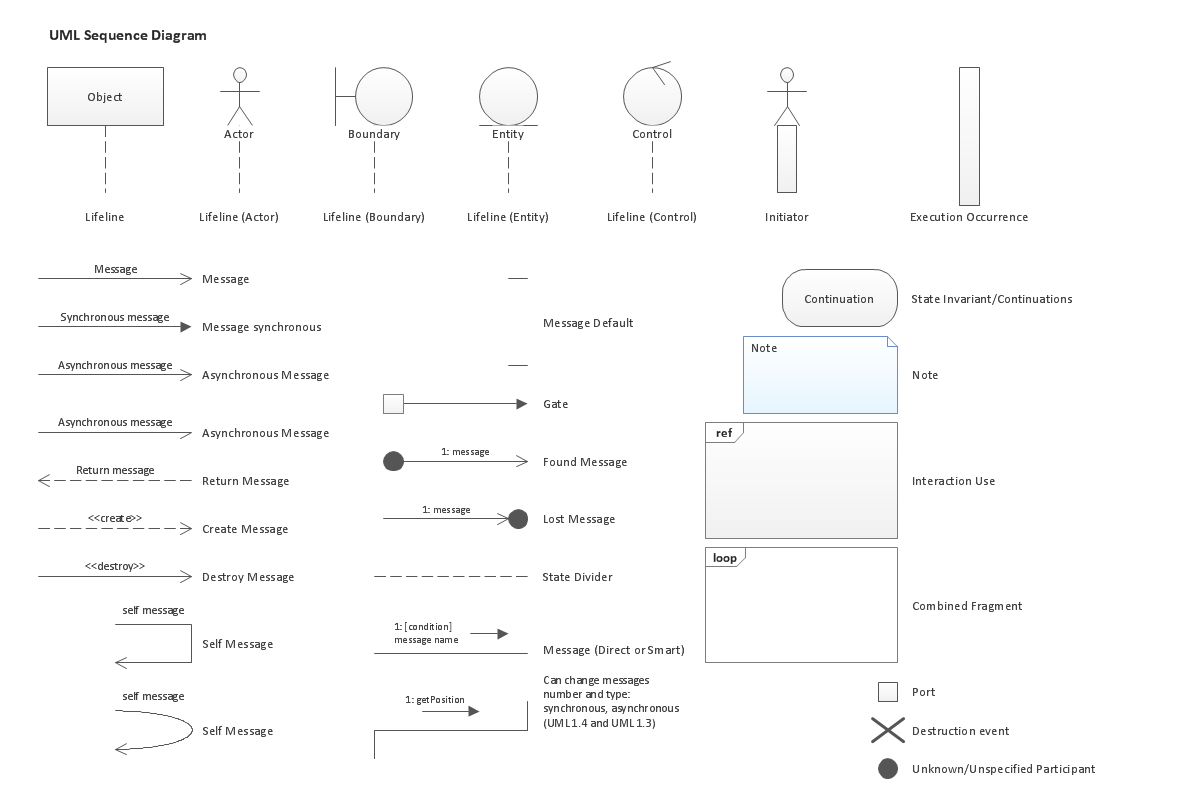
UML Sequence Diagram shows object interactions arranged in time sequence, how processes operate with one another and in what order and illustrate the sequence of messages exchanged between the objects and classes involved in the scenario.
If you are just a beginner in drawing flowcharts, it may seem that a sheet of paper and a pen are just enough. However, at the time you would want to share your results, diagramming applications would suite you better. it’s very easy to create diagrams that way and to discover new kinds of flowcharts.
The huge collection of sample ConceptDraw diagrams, charts, illustrations and other types of business drawings includes a wide range of business themes. A huge number of graphic images of ConceptDraw documents is divides on business application areas according to business-oriented solutions for which they were made.Here is a short visual list of samples of flowcharts, process diagrams, UML models, management charts, computer network diagrams, maps, infographics, illustrations, etc. In short, each ConceptDraw solution is accompanied with at least ten samples representing some particular examples of the application of the given chart.
ConceptDraw DIAGRAM is a powerful software that helps you create professional and easy drawing diagrams for business, technology, science and education.
Picture: Create Sophisticated Professional Diagrams - Simply
UML Collaboration Diagram depicts the interactions between objects or parts in terms of sequenced messages and describes both the static structure and dynamic behavior of a system.
Rapid UML solution provides templates, examples and libraries of stencils for quick and easy drawing all the types of system and software engineering diagrams according to UML 2.4 and 1.2 notations.
If you ever wanted to try any diagramming tools except of Visio, but were afraid to lose existing documents, there’s good news for you. One of the most striking features of ConceptDraw DIAGRAM is it’s perfect compatibility with MS Visio, which guarantees that you won’t depend on operating system anymore, because another ConceptDraw DIAGRAM feature is that it’s cross-platform tool. Don’t waste your time looking for other options, you’ve found the solution already!
Business professionals often utilize the MS Visio as a common tool for making various issues on business visualization. MS Visio is a strong software with good capacity to maintain complex business solutions. But there is no MS Visio for Apple OS X. This is a large invocation, and one would be pleased to recognize that ConceptDraw DIAGRAM is the ideal alternative to MS Visio. Primarily, because this software works natively on both Windows and Apple OS X platforms. if you have migrated from Windows to Mac, or need to communicate in a cross-platform conditions, you’ll search for MS Visio replacer. ConceptDraw DIAGRAM is the exclusive professional business diagramming application that runs on both Windows and Apple OS X. The opportunity exchange files between PC and Mac, as well as between ConceptDraw DIAGRAM and Visio is the significant advantage that permits you to display and to collaborate business information in effortless and cost-effective way.
Picture: ConceptDraw DIAGRAM Compatibility with MS Visio
Comparing ConceptDraw DIAGRAM to Omnigraffle - Cross-platform product. While most drawing tools are designed for use on one operating system, ConceptDraw DIAGRAM is available as two independent and concurrent versions on both Macintosh (macOS) and PC (Windows).
License is per named user. That means you can use a single license for Macintosh and PC. Users can install at work and at home with a single license.
Picture: Comparing ConceptDraw DIAGRAM to Omnigraffle
The Total Quality Management Diagram solution helps you and your organization visualize business and industrial processes. Create Total Quality Management diagrams for business process with ConceptDraw software.
Picture: TQM Software — Build Professional TQM Diagrams
When it comes to system construction, a class diagram is the most widely used diagram. UML Class Diagrams is a type of static structure diagram that is used for general conceptual modeling of the systematics of the application. Such a diagram would illustrate the object-oriented view of a system. The object orientation of a system is indicated by a class diagram. It describes the structure of a system by showing the general issues,classes of a system, attributes, operations, interfaces, inheritance, and the relationships between them.
Working with information can be quite tedious, furthermore, some data can be quite difficult to perceive without any graphic representation. So, to facilitate your work, you can use business diagrams, such as simple flowcharts or Gantt charts for project management and orgcharts for clarifying your company structure. You can use a proper software, like ConceptDraw Pro, draw them on paper, or use whiteboards, but it is more convenient to use a digital tool.
This diagram shows a cross-functional flowchart that was made fore telecom service provider. A workflow of a common telecommunication service provider has a rather branched structure. Thus, it is useful to have a flow chart to visualize the sequences and interrelations of the work flow steps. Business process flowchart contains 17 processes and 4 decision points,that are distributed through 2 lines depicting the participants involved. Also there are connectors that show the data flow within processes. This flowchart displays a detailed model of the telecom service trading process, as well as all participants in the process and how they interact with each other.
Picture: Business diagrams & Org Charts with ConceptDraw DIAGRAM