Histogram
What is a Histogram Chart?
Any histogram is known to be an accurate representation of the distribution of numerical data. Being an estimate of the probability distribution of a continuous variable, the histogram was first introduced by Karl Pearson as a kind of a bar graph. To make a histogram, you need to divide the range of values into a series of intervals and then to count how many of the values fall into each of the intervals. The so-called “bins” are usually specified as non-overlapping, consecutive intervals of a variable. Such intervals must be adjacent and they are often of an equal size.
In case the bins are of an equal size, a rectangle can be erected over such bin with a height that is proportional to the number of cases in each of the bins. Any histogram may also be normalized in order to display the so-called "relative" frequencies, showing the proportion of cases that fall into each of a few categories, with the sum of the heights which is expected to equal 1.
The mentioned bins don’t have to be of equal width. In such case, the erected rectangle can be defined to have its area proportional to the frequency of all the cases that are in the bin. The vertical axis is in such case is not called as the frequency but the frequency density. The mentioned density is simply the number of the cases per unit of the variable on the horizontal axis.
Giving a rough sense of the density of the underlying distribution of the data as well as the density estimation, histograms estimate the underlying variable’ probability density function. The total area of any histogram that is used for probability density is always normalized to 1. In case the length of the intervals on the x-axis are all 1, then such histogram is known to be identical to a similar, a relative frequency plot.
Any histogram can be treated as a simplistic kernel density estimation. Such estimation uses a kernel for smoothing the frequencies over the bins. Yielding a smoother probability density function, such function is known to be more accurately reflecting the distribution of the underlying variable. The density estimate can be plotted as an alternative to the histogram. It is also usually known to be drawn as a curve, not as a set of boxes.
Another alternative can be the average shifted histogram. This type of histogram is fast to compute, giving a smooth curve estimate of the density without using any kernels.
How to Make a Histogram?
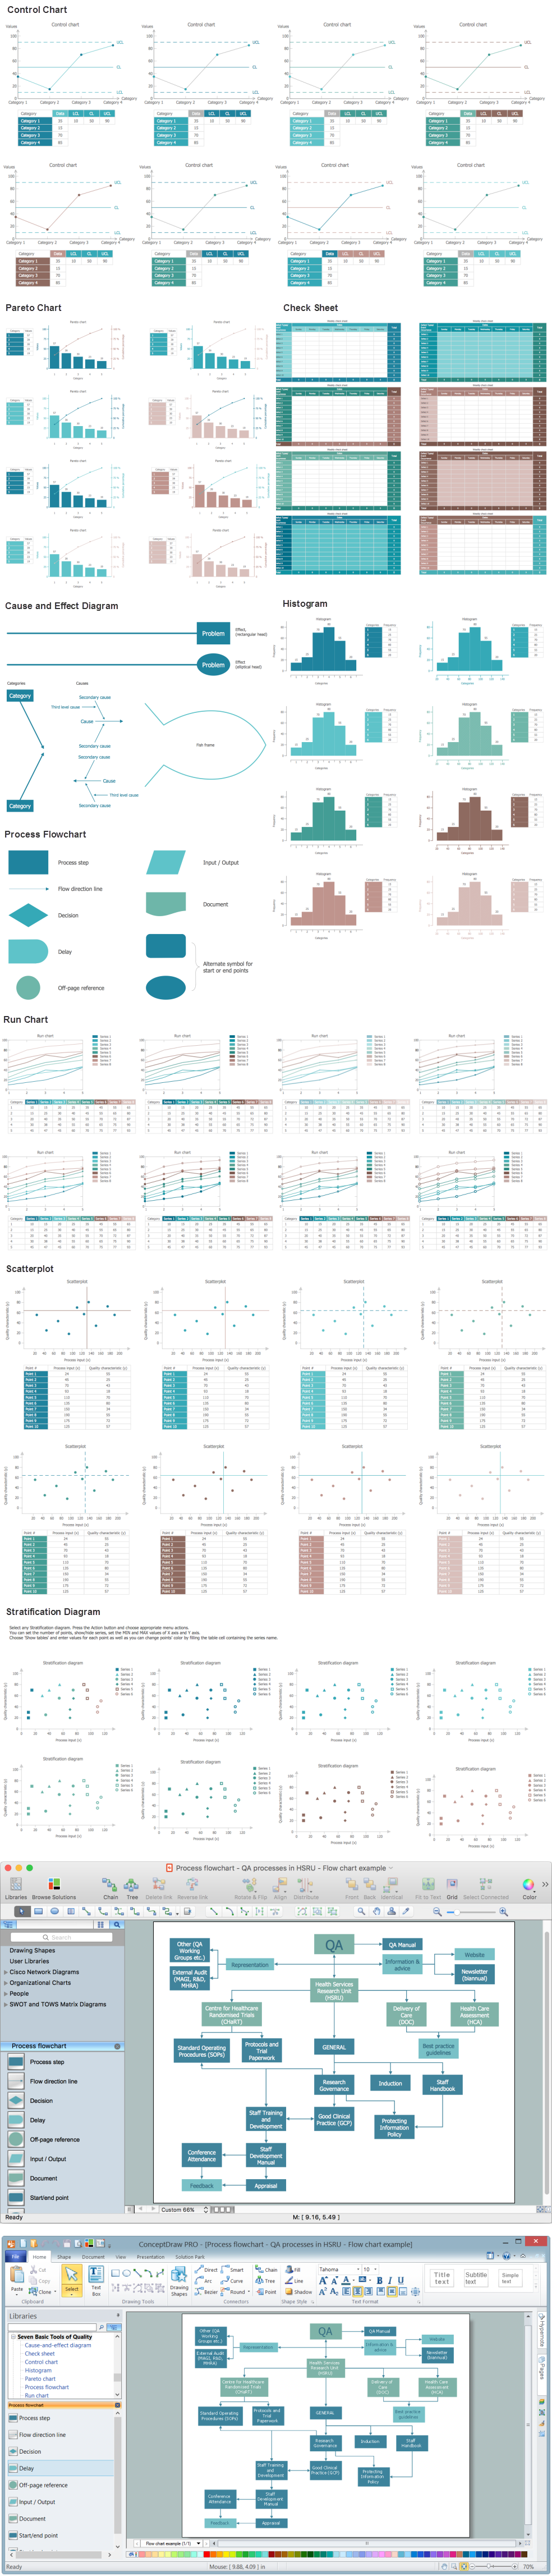
Histogram can be also created with the help of ConceptDraw DIAGRAM software by using the Histograms Solution from ConceptDraw STORE — a relatively new application developed by CS Odessa in order to provide all the ConceptDraw DIAGRAM users with so much needed and useful examples of the charts, diagrams and histograms to use them all as the drafts for the unique, great looking as well as always professionally looking drawings.

Example 1. Histogram Solution in ConceptDraw STORE
The histogram is known to be one of the seven basic tools of quality control and it can be always created, same as any other tools, with the aid of the mentioned software. Having the Histograms Solution means having eight vector objects that all can be used by any ConceptDraw DIAGRAM user as long as he or she has the previously downloaded ConceptDraw STORE application on their desktop.
What Data Type is a Histogram?
Histograms can be sometimes confused with the bar charts but they are meant to be used for continuous data, where the bins represent different ranges of data when any bar chart is known to be simply a plot of categorical variables.
How Many Types of Histograms are There?
There are a few types of a histogram, such as an image one that acts as a graphical representation of some tonal distribution in a digital image plotting the number of pixels for each of the tonal values. Such image histograms are known to be presenting on many modern digital cameras but they can be also created on a computer in case it is needed.
The horizontal axis of each of the graphs within such image histogram is known to be representing the tonal variations. At the same time, the vertical axis represents the number of pixels in some particular tone, for example, a red one. The left side of the horizontal axis is used for representing the dark areas, including the black ones, when the middle represents only medium grey and the right-hand one – both light and pure white areas.
The vertical axis on the image histogram represents the size of the area that is being captured in each of the mentioned zones. Any image histogram created for a very dark image has the majority of its data points on both the center and the left side of the graph. Any image histogram created for a very bright image with a few dark areas or/and shadows has most of the data points in the center of the graph and on its right side.
The described image histograms can be useful tools for thresholding in the field of computer vision. And because of the information that is being contained in the graph is a representation of the pixel distribution, the image histograms can be analyzed for either valleys or peaks, or both. The mentioned threshold value can be used after for the so-called image segmentation, co-occurrence matrices and edge detection.
Another type of histograms that are widely used in the image processing as well as the photography is a color histogram. Being a representation of the distribution of colors in an image and used for digital images, any color histogram is used for representing the number of those pixels that have the colors in each of the fixed lists of the color ranges. Such ranges are expected to be spanning the image's color space and the set of all possible colors.

Example 2. Histogram in ConceptDraw DIAGRAM
Conclusion
Creating any needed histogram, such as an image or a color one, is truly simple as long as you are a ConceptDraw DIAGRAM user who has such a useful application as a ConceptDraw STORE one as downloading it you can get an access to use a Histograms solution full of already pre-designed templates of the different histograms which all can be used after as the drafts for making your own great looking drawings.