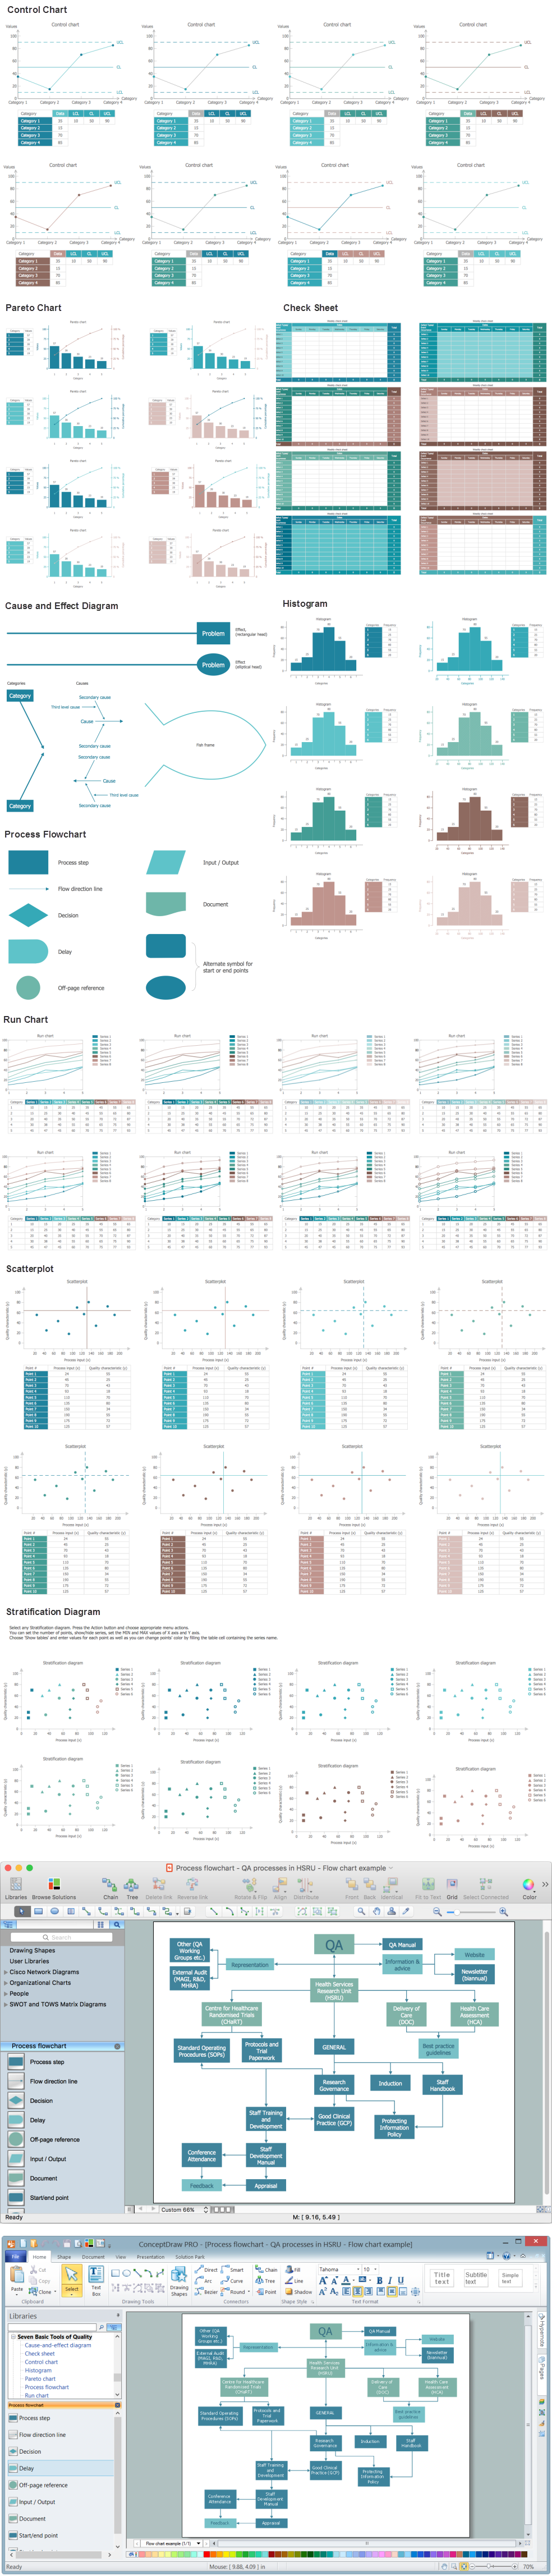
Example 1. Seven Basic Tools of Quality - Process Flow Chart.
Design Elements — QA Processes in HSRU for Apple OS X and Windows
Seven Basic Tools of Quality Solution offers collection of samples and 9 libraries with predesigned vector elements which will help facilitate drawing process and designing professional looking Flow Chart.
Another way of drawing is to use ready sample. Use the ConceptDraw STORE to receive access to the libraries and samples included in Seven Basic Tools of Quality solution. To open a sample in ConceptDraw DIAGRAM click its preview in ConceptDraw STORE, then you can make desired changes or use the sample as is.
Apply also bright colors to highlight important moments and to make your diagram yet more attractive and successful.

Example 2. Seven Basic Tools of Quality Solution in ConceptDraw STORE
The Process Flow Chart sample you see on this page was created in ConceptDraw DIAGRAM software using the predesigned elements from the libraries of the Seven Basic Tools of Quality Solution. It is included to this solution and is available from ConceptDraw STORE. An experienced user spent 20 minutes creating every of them.
Use the Seven Basic Tools of Quality Solution for ConceptDraw DIAGRAM software to create any of seven basic quality diagrams quick, easy and effective.
All source documents are vector graphic documents. They are available for reviewing, modifying, or converting to a variety of formats (PDF file, MS PowerPoint, MS Visio, and many other graphic formats) from the ConceptDraw STORE. The Seven Basic Tools of Quality Solution is available for all ConceptDraw DIAGRAM
TEN RELATED HOW TO's:
A detailed mind map about the various elements and stages of project management.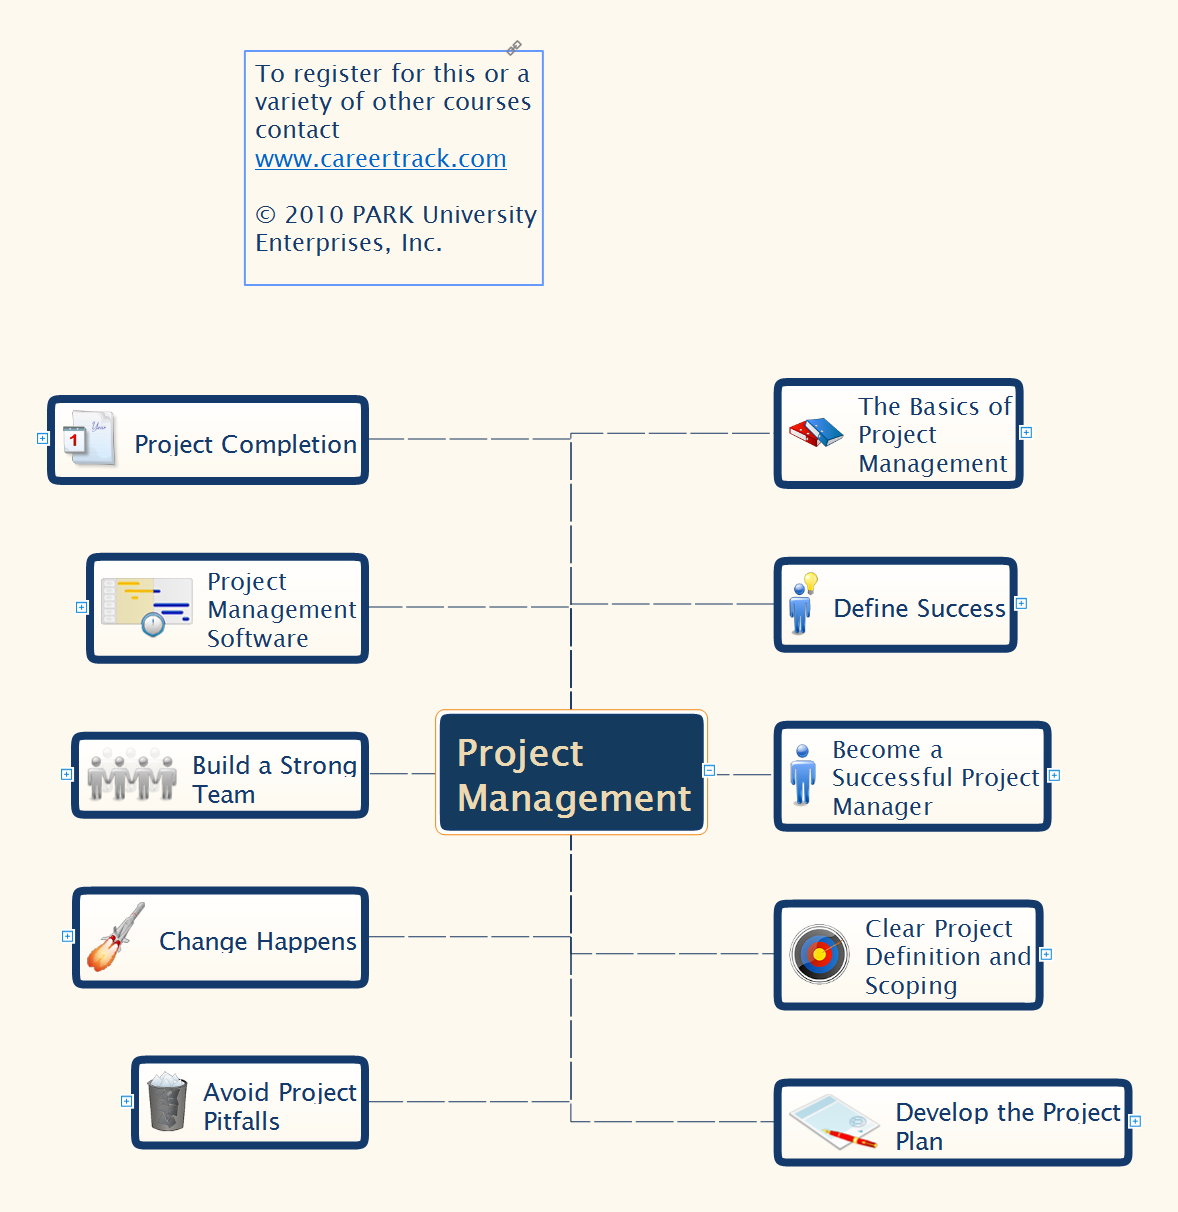
Picture: Project Management
Related Solution:
Users can start draw their own flowchart diagrams from existing examples.
Picture: Examples of Flowchart Diagram
Related Solution:
This sample shows the Flowchart that displays the layout and work flow of the cloud marketing platform. This diagram has a style of the marketing brochure. This style displays the central product that is related to the other issues.
Using the ready-to-use predesigned objects, samples and templates from the Flowcharts Solution for ConceptDraw DIAGRAM you can create your own professional looking Flowchart Diagrams quick and easy.
Picture: Flowchart Marketing Process. Flowchart Examples
Related Solution:
ConceptDraw OFFICE suite is a software for Prioritization Matrix diagram making. This diagram ranks the drivers’ factors to determine priority. It identifies the factors of the first priority for analysis of possible corrective actions. It assesses the weight of each factor for each criterion and specifies it in the Prioritization Matrix. The total sum of weights for a factor’s criteria indicates its priority.
Picture: PROBLEM ANALYSIS. Prioritization Matrix
ConceptDraw DIAGRAM extended with Pyramid Diagrams Solution from the Marketing Area of ConceptDraw Solution Park is a powerful Pyramid Charts making software.
A Pyramid Chart has the form of triangle and hierarchically structures, organizes and help to analyze the information, data or ideas. Triangle is divided on the sections that usually have different widths. The width indicates the level of hierarchy among the topics.
Picture: Pyramid Charts
Related Solution:
Do you like the professional schemes that you can find on the Internet? Take into account that the most part of them is made using the Best Flowchart Software and Flowchart Symbols. Try you own powers in creating such diagrams!
Flowcharts are the most business diagramming tool. If you are a business manager, you can use flow chart to depict work flow in your organization, develop the effective organizational structure and present the information to investors or other stakeholders. Combining the smart management solutions with ConceptDraw DIAGRAM diagramming engine delivers the set of comprehensive flowchart tools necessary to support professionals in their creativeness and business activity.
Picture: Best Flowchart Software and Flowchart Symbols
Related Solution:
Drawing workflow diagrams combines both creative and analytic practice. To be the most effective in this process you should find a software that suites this kind of practice. Using ConceptDraw DIAGRAM software for drawing workflow diagrams you get support of features, libraries, templates and samples boosts you creativity and keep you focus on analytic practice, not drawing specifics.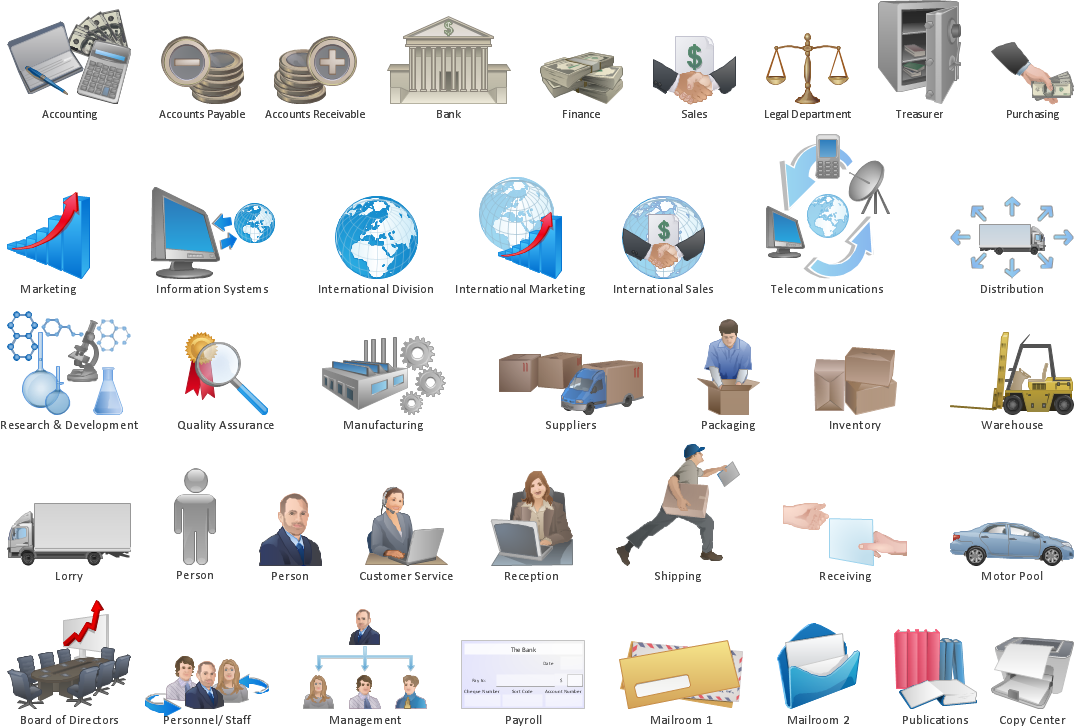
Picture: Drawing Workflow Diagrams
Related Solution:
Templates are very useful and convenient tool for fast and easy drawing various diagrams, charts, and also flowcharts.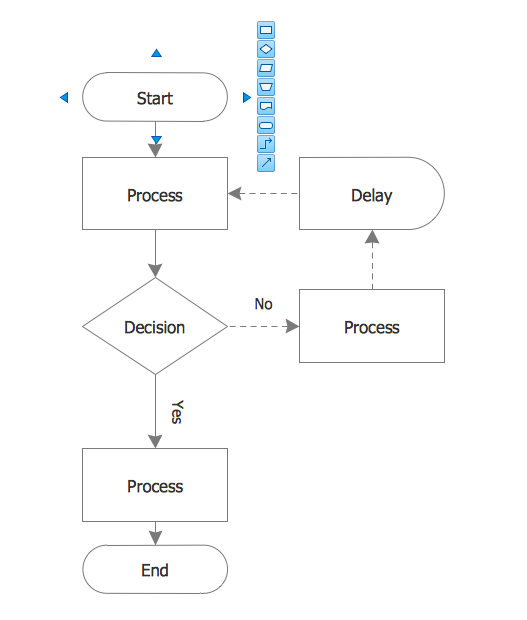
Picture: Flow Chart Template
Related Solution:
How to draw a Process Flow Chart? It's very fast and easy to draw any Process Flow Chart using the tools of special Process Flow Chart software free.
Flowcharts Solution offers wide set of useful drawing tools, collection of samples, ready-to-use template and 2 libraries with predesigned vector elements which will help facilitate drawing process and designing professional looking process flow chart, process flow scheme, process block diagram, etc.
Picture: Process Flow Chart Software Free
Related Solution:
Everything about Bookkeeping: Accounting flowchart process. Which symbols to use, how to make a chart.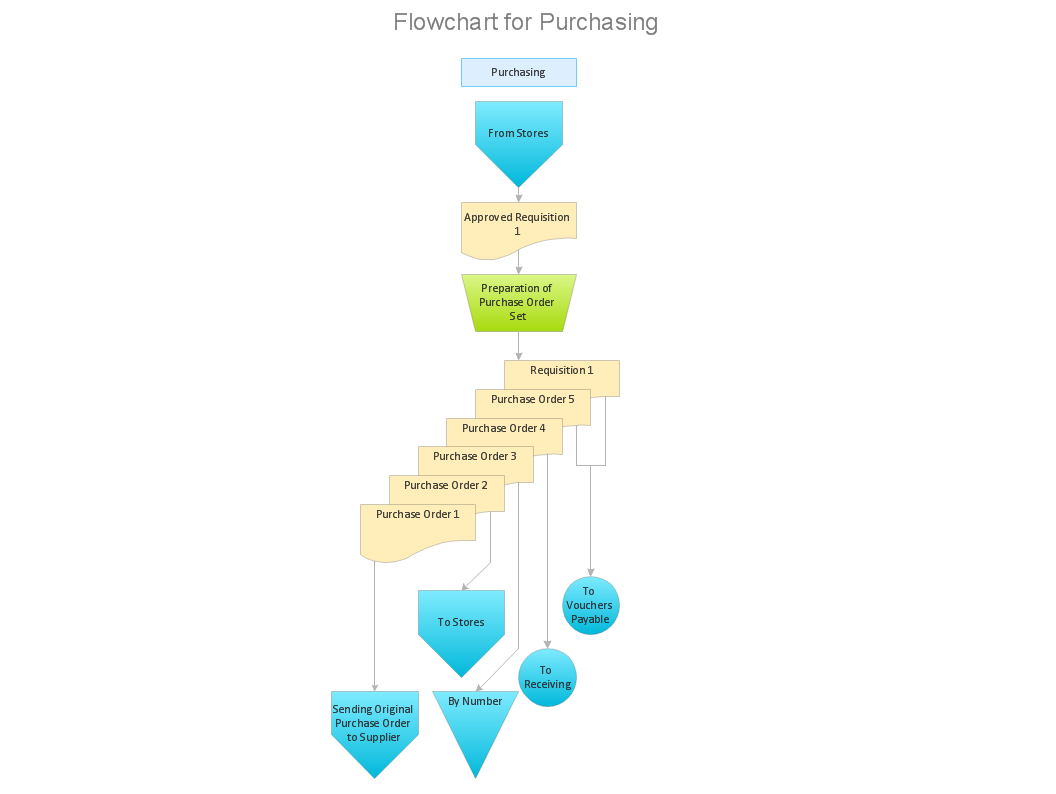
Picture: Introduction to bookkeeping: Accounting flowchart process
Related Solution:
