Making a Histogram
Being is an accurate representation of some distribution of numerical data, any histogram is one of the most commonly used drawings that can be also created with the help of the ConceptDraw DIAGRAM diagramming and drawing software. Having the needed solution from the Graphs and Charts area of ConceptDraw STORE application, making a histogram can be a fun and entertaining process as all that has to be done is editing the already existing templates that were previously created by the team of the It specialists of CS Odessa.
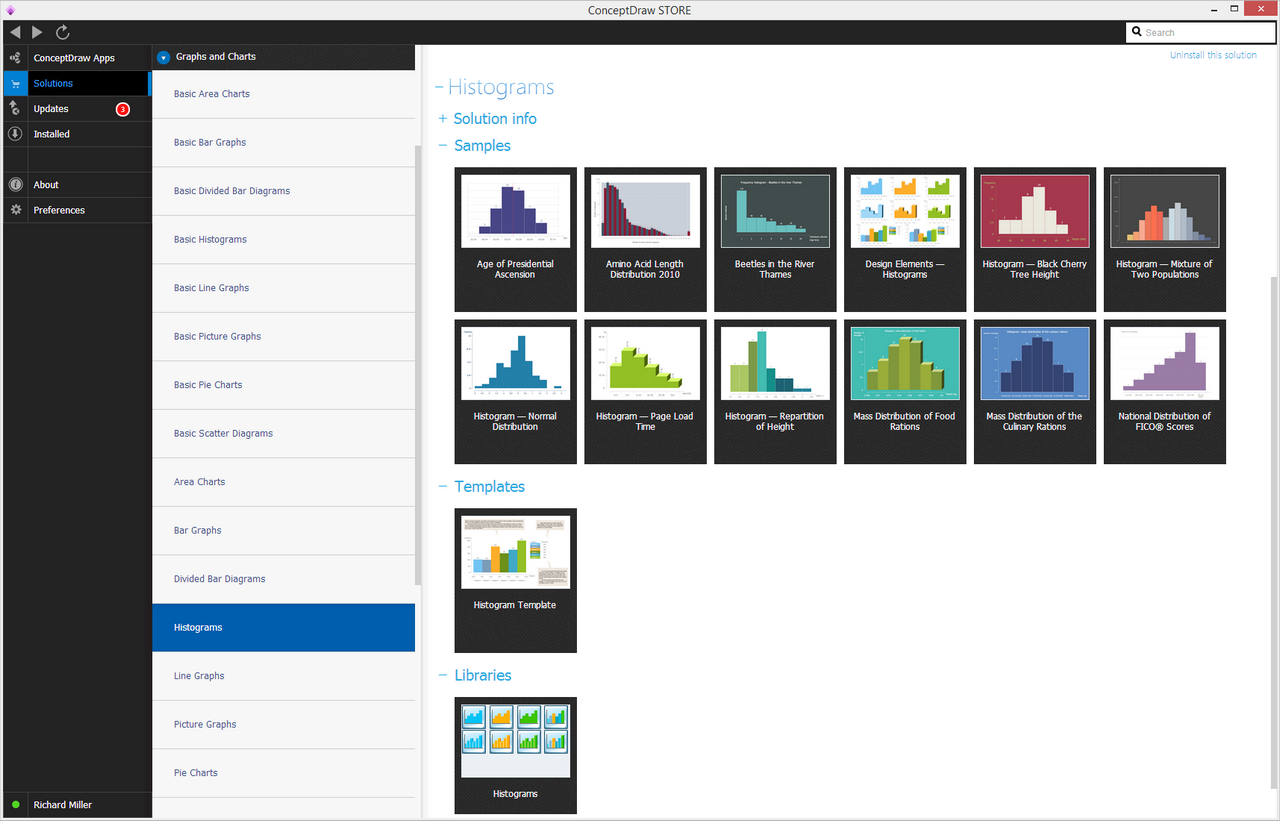
Example 1. Histograms Solution in ConceptDraw STORE
A histogram is also known as an estimate of the probability distribution of some continuous quantitative variable that was first introduced by Karl Pearson as a kind of a bar graph. In order to make a histogram, the first step should be to "bin" the whole range of values. “Binning” means dividing all this range of values into a series of intervals and then counting the exact quantity of how many values fall into each of them. All the bins are known to be usually specified as non-overlapping and consecutive intervals of some variable. It is also important for such bins to be adjacent as well as of equal size.
If the bins are what they are better to be (of equal size), a rectangle can be erected over the bin with the height that is proportional to the frequency or the number of cases in each of the bins. Any histogram may also be normalized in order to display the so-called "relative" frequencies.
Showing the proportion of cases that fall into each of the categories, with the sum of the heights equaling 1, the bins need not be of equal width. In such case, the erected rectangle can be defined to have its area proportional to the whole frequency of cases in the bin. Because of the adjacent bins are known to be leaving no gaps, the rectangles of any histogram touch each other and so indicate that the original variable is continuous.
Usually, the histograms give a rough sense of the density of the underlying distribution of the data for estimating the probability density function of the underlying variable. The total area of any histogram is used for probability density being always normalized to 1. If the length of different intervals on the x-axis are all 1, then such histogram is known to be identical to a relative frequency plot. Being one of the seven basic tools of quality control, any histograms can be sometimes confused with a bar chart, but the difference is that any histogram is created for being used for continuous data, where the previously mentioned bins represent the ranges of data. At the same time, to compare to a histogram, any bar chart is known to be a plot of categorical variables. Some of the authors recommend that bar charts have gaps between the rectangles used for clarifying the distinction.
Any histogram can be treated as a simplistic kernel density estimation. Such estimation can use a kernel in order to smooth the existing frequencies over the bins. The density estimate can be also plotted as an alternative to the histogram, being usually drawn as a curve, not a set of boxes.

Example 3. Making a Histogram — FICO Histogram
Another alternative to a usual histogram may be the shifted histogram, known to be fast to compute, giving a smooth curve estimate of the density without using kernels. No matter which of the mentioned drawings has to be created, making a histogram can be a fun process when the ConceptDraw DIAGRAM diagramming and drawing software is installed to your desktop same as the ConceptDraw STORE application which is another product of CS Odessa developed in order to provide all the users with the opportunity to use all the needed tools for making histograms and other drawings.
If a histogram has to be created within a short period of time, then the examples from one of the solutions available from the Graphs and Charts area can be used as a base for the unique drawings. Thus, there is a wide choice of the solutions that can be found in the ConceptDraw STORE application in its Graphs and Charts area: Basic Area Charts, Basic Bar Graphs, Basic Line Graphs, Basic Picture Graphs, Bar Graphs, Line Graphs, Picture Graphs, Basic Histograms and Histograms one.
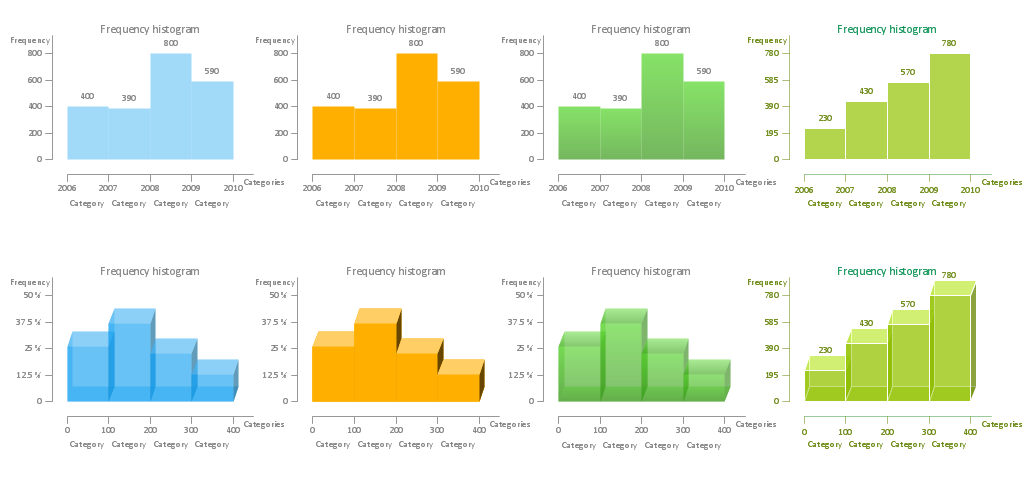
The last mentioned one, the Histograms solution, offers to use all 8 vector objects from its stencil library which are the histograms of different shapes and colours that can be always changed the way the ConceptDraw DIAGRAM user wants them to be. Also, there are the templates of the histograms, such as the “Histogram – Mass Distribution of Food Rations”, “Histogram — Age of Presidential Ascension”, “Histogram — Black Cherry Tree Height”, “Histogram — Normal Distribution”, “Histogram — Repartition of Height”, “Histogram — Page Load Time” and “Histogram — Mixture of Two Populations”.
Example 2. Histograms library — Design Elements
Once there is a need for making some histogram, you can simply, first of all, download the ConceptDraw DIAGRAM diagramming and drawing software as well as the ConceptDraw STORE application from this site, then find the Histograms solution from a list of the solutions that are available in the Graphs and Charts area of ConceptDraw STORE and install it. Once the needed solution is installed it can be found in the ConceptDraw DIAGRAM diagramming and drawing application among other libraries and so any needed example from it can be edited in order to make another — unique, but still smart looking one.
Editing the already existing samples can be simpler rather than creating some histogram from a scratch. The needed data can be inserted and the height of the “bins” can be changed, same as its color. Due to the specificity of your business, you can input any needed data mentioning the category you need to be there on your histogram and so to get the drawing done within only a couple of minutes.


