
Example 1. What Is a Line Chart
The Line Graphs Solution from Graphs and Charts area of ConceptDraw Solution Park provides large quantity of useful drawing tools making your drawing of any line graph simple and fast.

Example 2. Line Chart - Evolution of the population
Use the predesigned objects from the Line Graphs library of Line Graphs solution, templates and samples and you will get the excellent result in minutes.

Example 3. Line Chart - The value of the French franc in 2007 Euros
The samples you see on this page were created in ConceptDraw DIAGRAM using the vector objects from the Line Graphs Solution for ConceptDraw DIAGRAM These samples visually and clear explain what is a line chart. An experienced user spent 5 minutes creating every of these samples.
All source documents are vector graphic documents. They are available for reviewing, modifying, or converting to a variety of formats (PDF file, MS PowerPoint, MS Visio, and many other graphic formats) from the ConceptDraw STORE. The Line Graphs Solution is available for all ConceptDraw DIAGRAM or later users.
TEN RELATED HOW TO's:
Describing the way data flows through an information system might become a subject of a study. One of the kinds on a data flow diagram is called Gane Sarson Diagram after its authors, and it slightly differs from other notations. Process symbols in this notation are depicted as rounded rectangles connected with arrows representing data flows.
This is a sample of data flow diagram. It demonstrates utilization of the Gane-Sarson notation for making DFD on the example of an online appointment system of the Health Centre. This sample is used the vector objects library of Gane-Sarson DFD notation supplied by the ConceptDraw solution for data flow diagramming. It contains all symbols of the Gane-Sarson notation including connectors, jumps, and processes. This solution can be successfully utilized to generate DFDs for business documentation, and presentations.
Picture: Gane Sarson Diagram
How to make histogram in ConceptDraw DIAGRAM?
Picture: How To Make Histogram in ConceptDraw DIAGRAM ?
Related Solution:
Either working for a company or having your own business, you might need to create different drawings from time to time, such as the bar charts. Having the bar charts examples on the Internet usually means you cannot use them as your own drafts and so you cannot create any bar graph by using any of them. At the same time, if you have the ConceptDraw DIAGRAM diagramming and drawings software, it means you can make any needed diagram, flowchart, scheme or chart, such as a bar one, easily having no doubts in getting the smart and the good-looking result.
Picture: Bar Chart Template
Related Solution:
When used in different areas, flowcharts use specific symbols to depict different elements. ConceptDraw DIAGRAM offers libraries of symbols for many areas. One of such libraries is flowchart symbols accounting, which provides symbols for accounting diagrams. Activity-based costing calculates the costs of all products and services based on activities in an organization. A type of accounting flowchart that shows how costs are assigned to products with resources and activities is called Activity-based costing (ABC) flowchart. It can be designed in a digital drawing software such as ConceptDraw DIAGRAM.
Here is an accounting flowchart template and symbols. These flowchart symbols are applied for making accounting flow charts in ConceptDraw DIAGRAM and with its Accounting Flowcharts solution. An accounting flowchart is a specific type of a flow diagram. Practically a number of flowchart-type diagrams commonly utilized to clarify many parts of an accounting department working process. Accounting flowchart assists a process of preparing accounting documentation. It shows who responsible for implementation of each step in the workflow of accounting department.
Picture:
Flowchart Symbols Accounting
Activity-based costing (ABC) flowchart
Related Solution:
There are numerous articles about the advantages of flowcharting, creating business graphics and developing different charts. Nevertheless, these articles are almost useless without the main component - the examples of flowcharts, org charts and without a fine example, it is difficult to get all the conveniences of creating diagrams. You can find tons of templates and vivid examples on Solution Park.
This illustration shows a variety of business diagrams that can be created using ConceptDraw DIAGRAM. It comprises a different fields of business activities: management, marketing, networking, software and database development along with design of infographics and business illustrations. ConceptDraw DIAGRAM provides a huge set of sample drawings including business process modeling diagrams,, network diagrams, UML diagrams, orgcharts, DFD, flowcharts, ERD, geographical maps and more.
Picture: Examples of Flowcharts, Org Charts and More
Related Solution:
Business graphic applications show a special knowledge representations and include many features for creating schematic pictures. These graphic tools are known as flowchart maker or flowchart maker software.
Picture: Flowchart Maker
Related Solution:
ConceptDraw PROJECT is the Gantt chart software that implements critical path method to provide the user with a wide set of project management tools.
Picture: How to Discover Critical Path on a Gantt Chart
ConceptDraw DIAGRAM is the professional business graphic software for drawing diagrams and charts with great visual appeal on Mac OS X.
Picture: The Best Drawing Program for Mac
Related Solution:
Illustrate the Asia continent and explore its parts, geographical features, resources, and economic development through designing various kinds of colorful Asia maps and using them in presentations, reports, educational materials, websites, business documents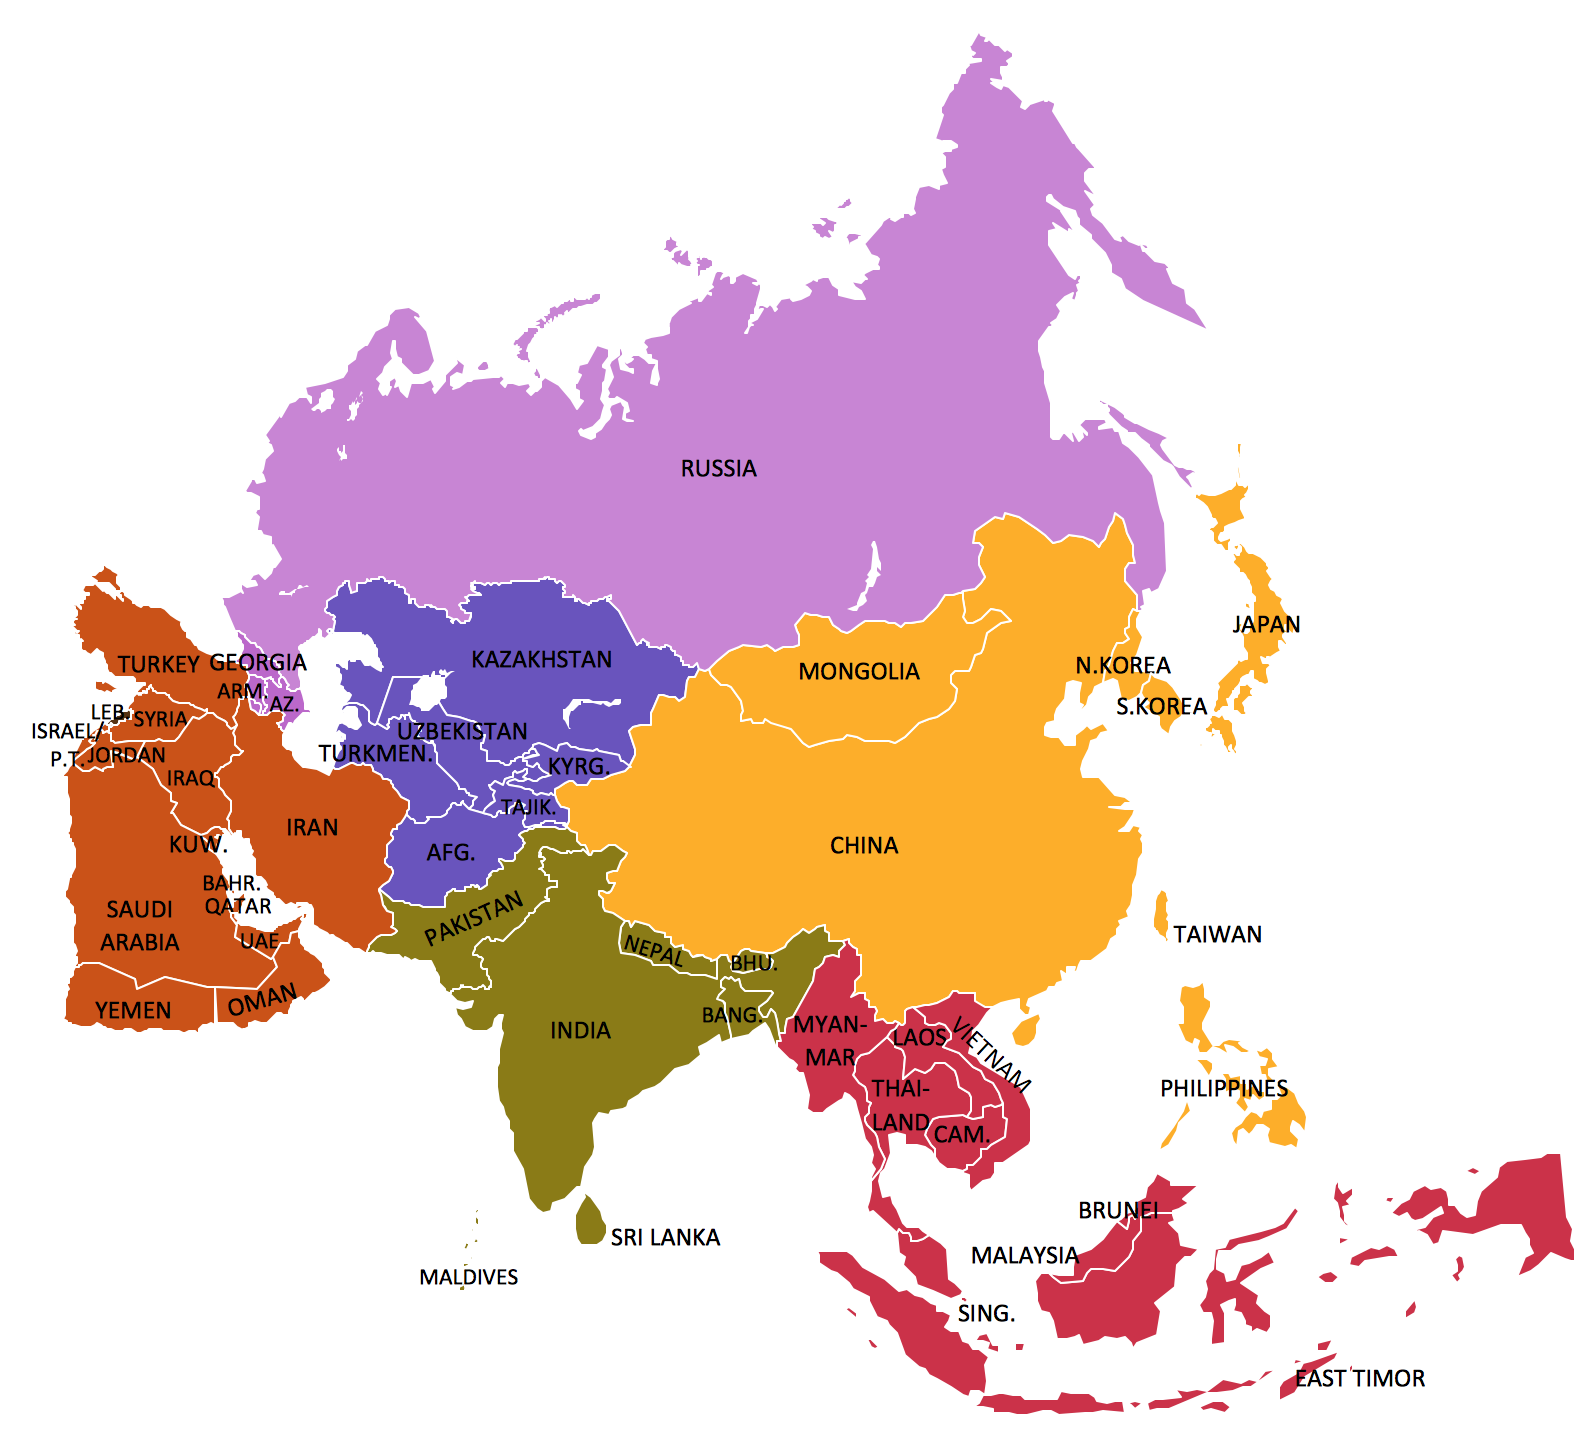
Picture: Geo Map — Asia
Related Solution:
ConceptDraw defines some map types, divided into three categories. Every map type has specific shapes and examples.
Picture: Types of Map - Overview
Related Solution:

