How To Make Histogram in ConceptDraw DIAGRAM ?
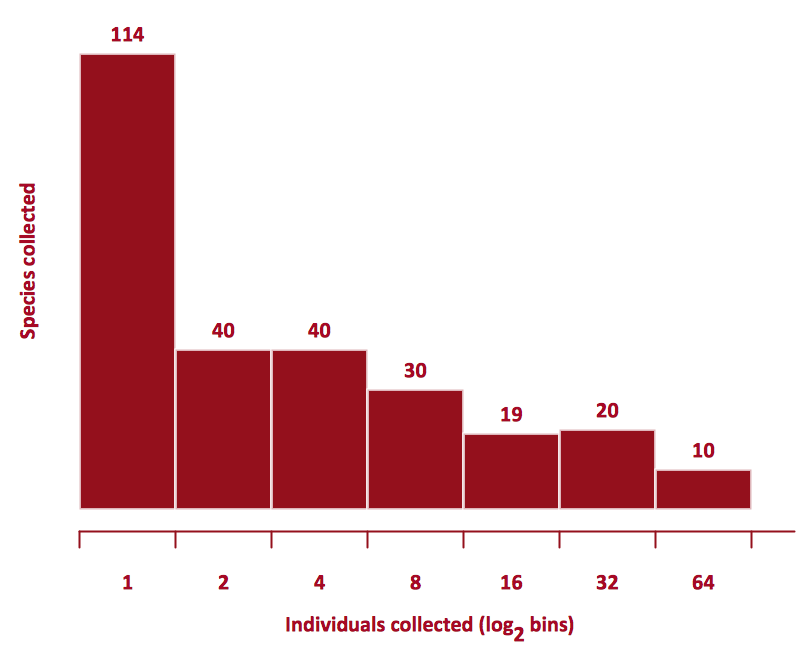
"A histogram is a graphical representation of the distribution of data. It is an estimate of the probability distribution of a continuous variable (quantitative variable) and was first introduced by Karl Pearson. To construct a histogram, the first step is to bin the range of values, and then count how many values fall into each interval. A rectangle is drawn with height proportional to the count and width equal to the bin size, so that rectangles abut each other." [from Wikipedia]
How to make histogram in ConceptDraw DIAGRAM ConceptDraw DIAGRAMdiagramming and vector drawing software is the best choice for making professional looking Histograms. ConceptDraw DIAGRAM provides Histograms solution from the Graphs and Charts Area of ConceptDraw Solution Park.
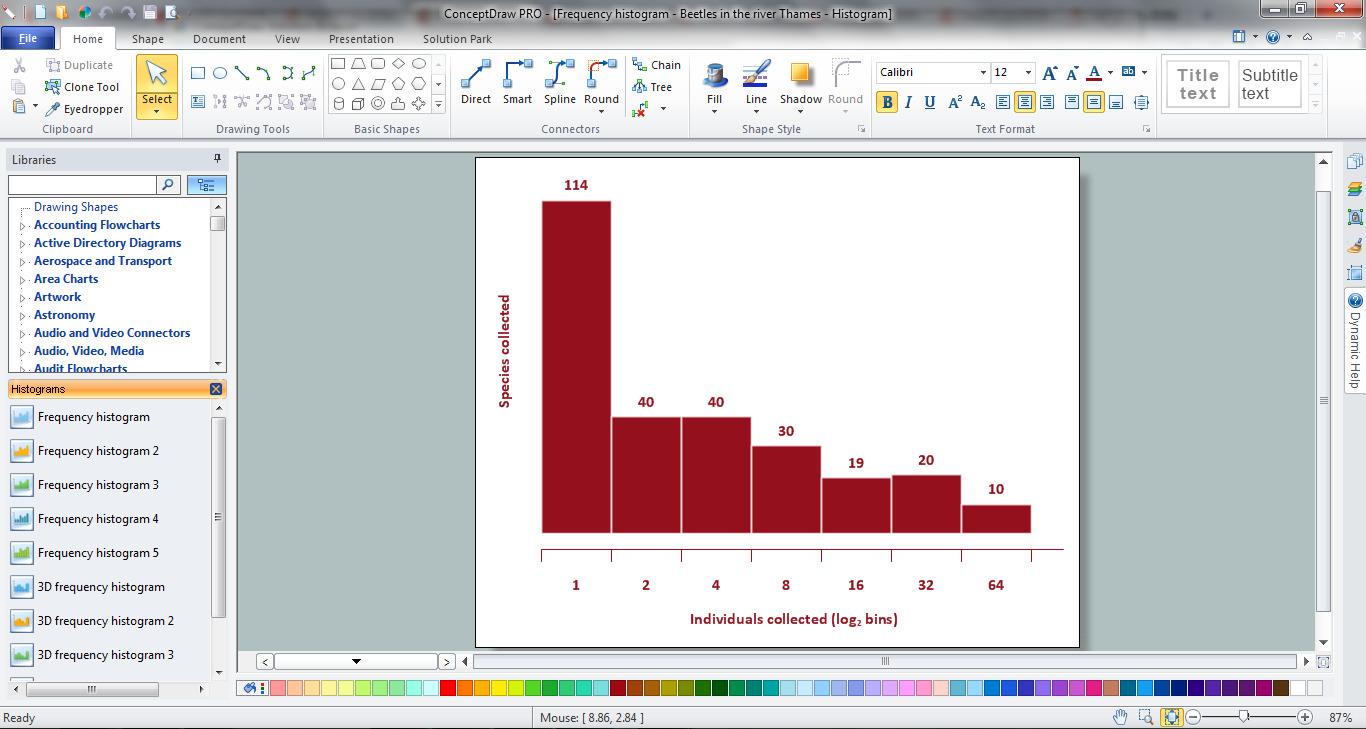
Example 1. How To Make Histogram
The most easier way to make a Histogram in ConceptDraw DIAGRAM is to use the predesigned templates and samples offered by Histograms Solution. They are represented in ConceptDraw STORE and you can open the desired of them, and change it according to your data in minutes.
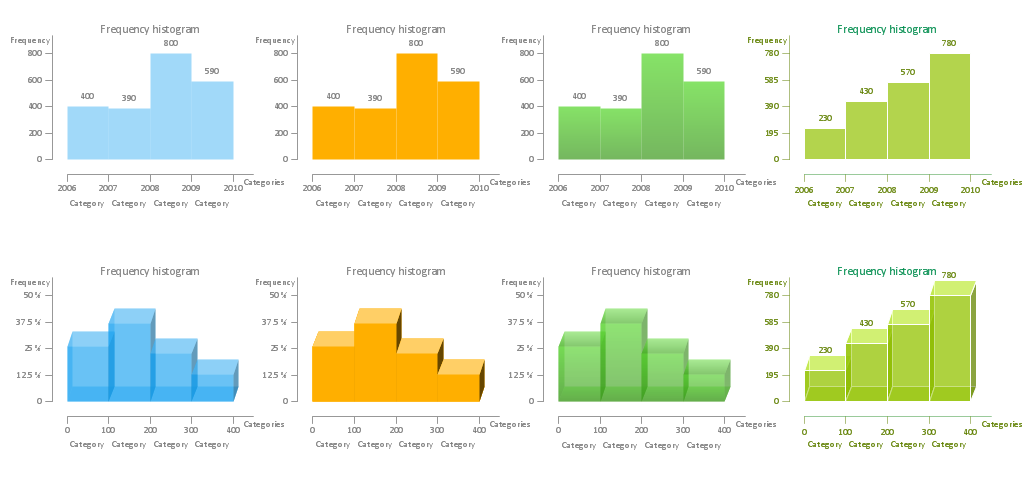
Example 2. How To Make Histogram — Histograms library Design Elements
If you can't find a suitable example among the proposed in ConceptDraw STORE, create a new document and use the Histograms library with ready-to-use objects. They will definitely help you in your histogram chart creating.
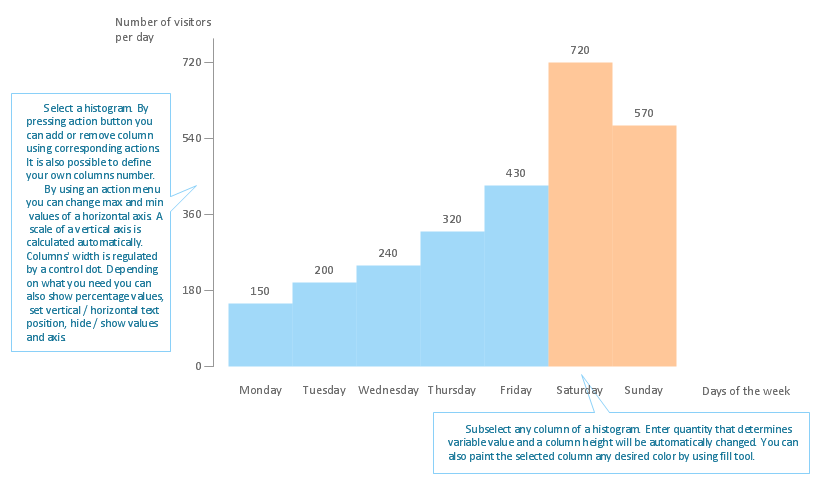
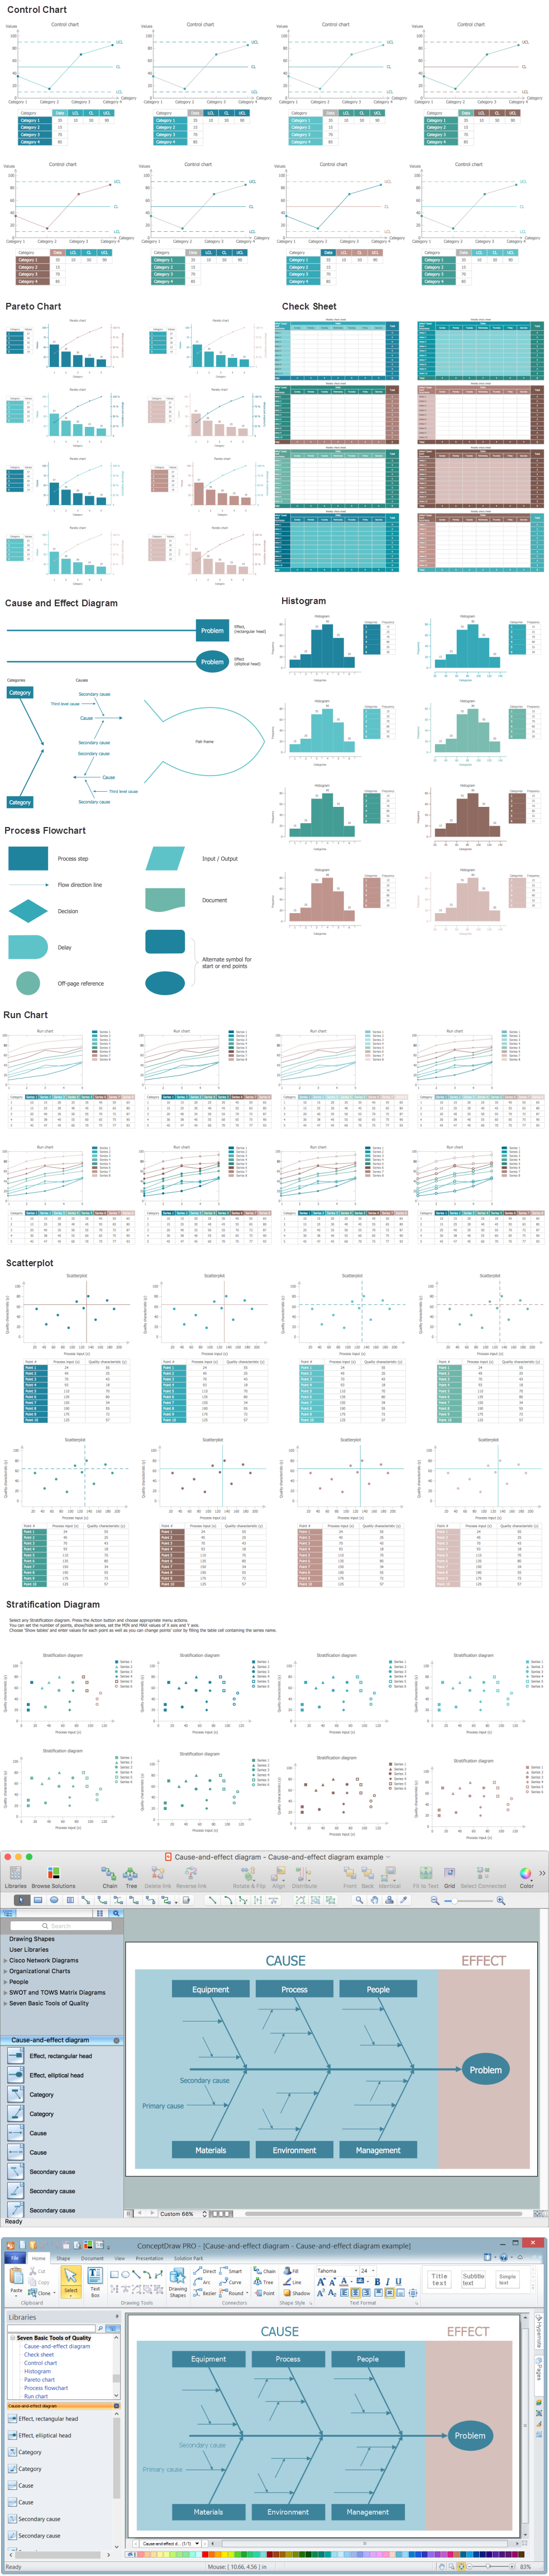
Example 3. Histogram Template
This Histogram template was created in ConceptDraw DIAGRAM and is included to Histograms Solution from the Graphs and Charts Area. It can be opened from ConceptDraw STORE and filled with your data.
Use the tools of Histograms solution to draw your own Histogram Charts quick and easy.
All source documents are vector graphic documents. They are available for reviewing, modifying, or converting to a variety of formats (PDF file, MS PowerPoint, MS Visio, and many other graphic formats) from the ConceptDraw STORE. The Histograms Solution is available for all ConceptDraw DIAGRAM or later users.