Made with
ConceptDraw
DIAGRAM 18

UML Diagramming Software

The UML Diagrams are widely used by software developers and software engineers. They can draw the UML Diagrams manually on the paper, but it is incredibly convenient to use the special UML diagramming software. The UML diagramming software allows you to draw the UML Diagrams in a few minutes.

ConceptDraw DIAGRAM is a powerful diagramming and vector drawing software that helps to design the detailed professional looking UML diagrams quick and easy.

Unified Modeling Language (UML)

Unified Modeling Language (UML) is a language of graphic description for object modeling in the field of software engineering. UML was created for definition, visualization, designing of software systems. UML is an open standard that uses graphic notations for creating visual models of object-oriented software systems.

Two types of diagrams are used in UML: Structure Diagrams and Behavior Diagrams. Behavior Diagrams represent the processes proceeding in a modeled environment. Structure Diagrams represent the elements that compose the system.

There are seven types of Structure Diagrams that must be present in any modeled system:

  • Class Diagram
  • In software engineering, a UML Class Diagrams is a type of static structure diagram that is used both for general conceptual modeling of the systematics of the application, and for detailed modeling translating the models into programming code. It describes the structure of a system by showing the system's classes, their attributes, operations (or methods), and the relationships among the classes.

    UML Class Diagram

  • Component Diagram
  • UML Component Diagram illustrate how components are wired together to larger components and software systems that shows the structure of arbitrarily complex systems.

    UML Component Diagram

  • Composite Structure
  • UML Composite Structure Diagram shows the internal structure of a class and the possible interactions at this structure. It includes internal parts, ports, and connectors between parts or ports. Each element has some defined roles in the collaboration.

    UML Composite Structure

  • Deployment Diagram
  • UML Deployment Diagram depicts the physical deployment of artifacts on nodes: nodes is the existing hardware components and artifacts is the software components running on each node; and how the different pieces are connected.

    UML Deployment Diagram

  • Object Diagram
  • UML Object Diagram shows the structure of a modeled system at a specific time. UML Object Diagram focuses on some particular set of object instances and attributes, and the links between the instances. A correlated set of object diagrams provides insight into how an arbitrary view of a system is expected to evolve over time.

    UML Object Diagram

  • Package Diagram
  • UML Package Diagram illustrates the functionality of a software system. ConceptDraw helps you to start designing your own UML Package Diagrams with examples and templates. You can use the appropriate stencils of UML notation for drawing your own UML Package Diagram.

    UML Package Diagram

The Behavior Diagrams group includes:

  • Activity Diagram
  • UML Activity Diagram illustrates the business and operational step-by-step workflows of components in a system and shows the overall flow of control.

    UML Activity Diagram

  • State Machine Diagram
  • UML state machine's goal is to overcome the main limitations of traditional finite-state machines while retaining their main benefits. UML state machine introduce the new concepts of hierarchically nested states and orthogonal regions, while extending the notion of actions.

    UML State Machine Diagram

  • Use Case Diagram
  • UML Use Case Diagram

    Use case diagrams are used at the development of software and systems for definition of functional system requirements or system of systems. Use case diagram presents the consecution of object’s actions (user’s or system’s) which are executed for reaching the definite result.

  • Interaction Overview Diagram
  • UML Interaction Overview Diagram schematically shows a control flow with nodes and a sequence of activities that can contain interaction or sequence diagrams.

    UML Interaction Overview Diagram

The subgroup of Interaction Diagrams controls the flow of control and data, and includes:

Notation UML

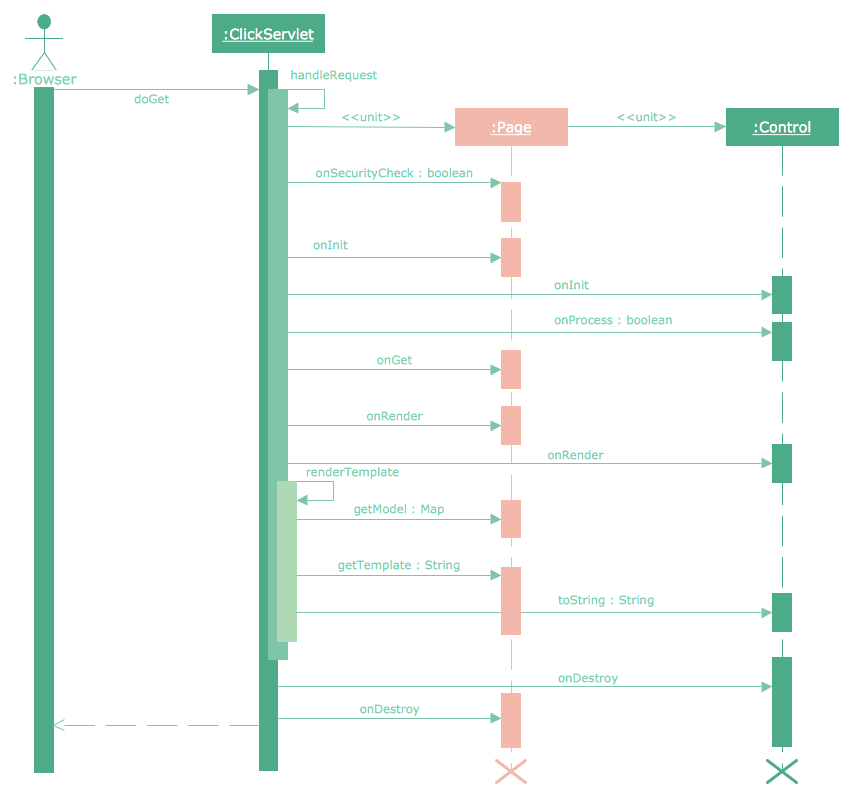
Pic. 1. Notation UML

The Rapid UML Solution for ConceptDraw DIAGRAM presents the intuitive RapidDraw interface that helps you to make the UML Diagrams of all types of UML 1.x and 2.x diagrams quick and easy.

UML Diagramming Software *

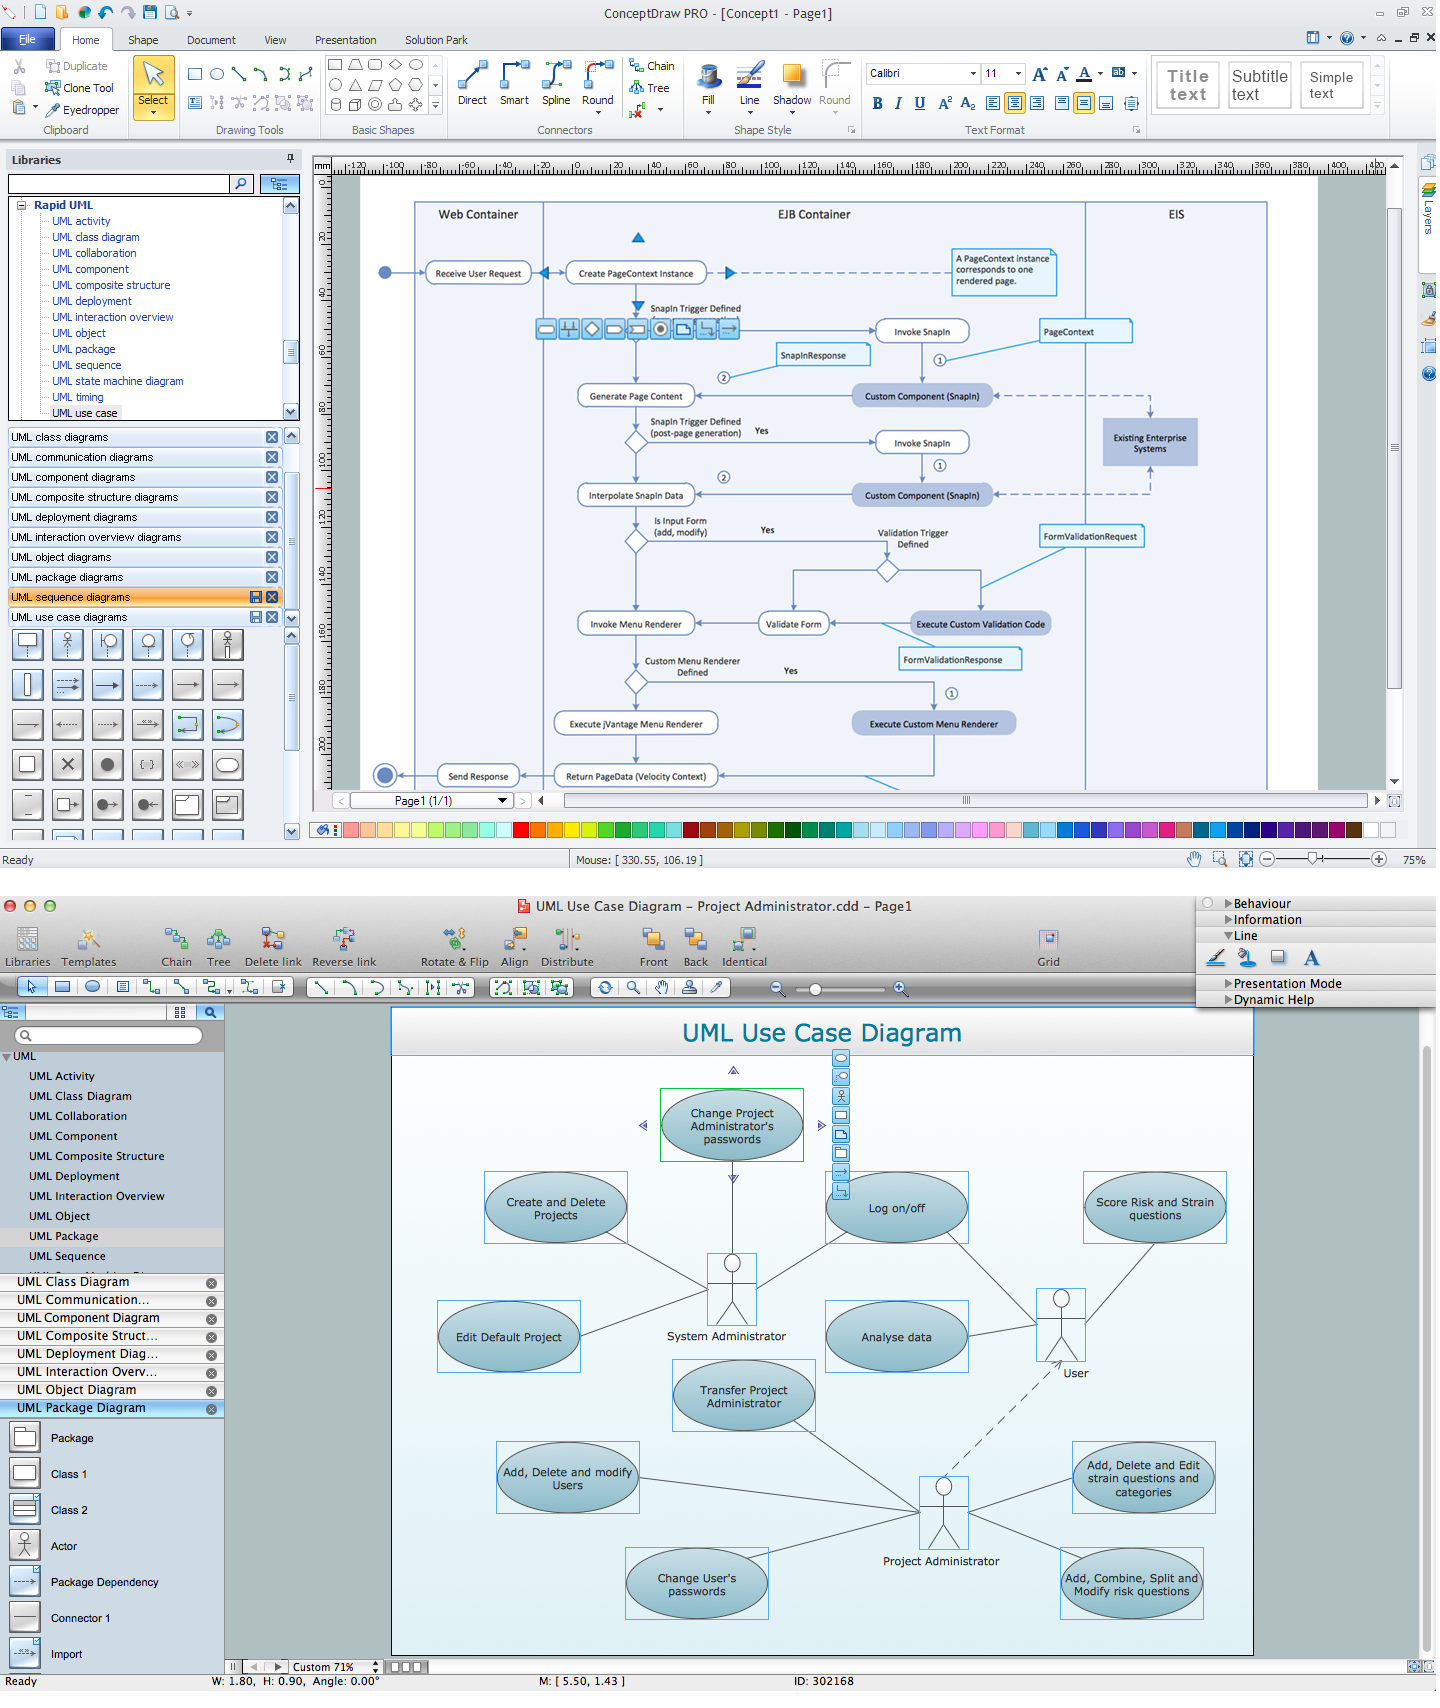
Pic. 2. UML Diagramming Software for Mac and Windows

13 libraries of the Rapid UML Solution of ConceptDraw DIAGRAM make your UML diagramming simple, efficient, and effective. You can simply and quickly drop the ready-to-use objects from libraries into your document to create the UML Diagram.

UML libraries

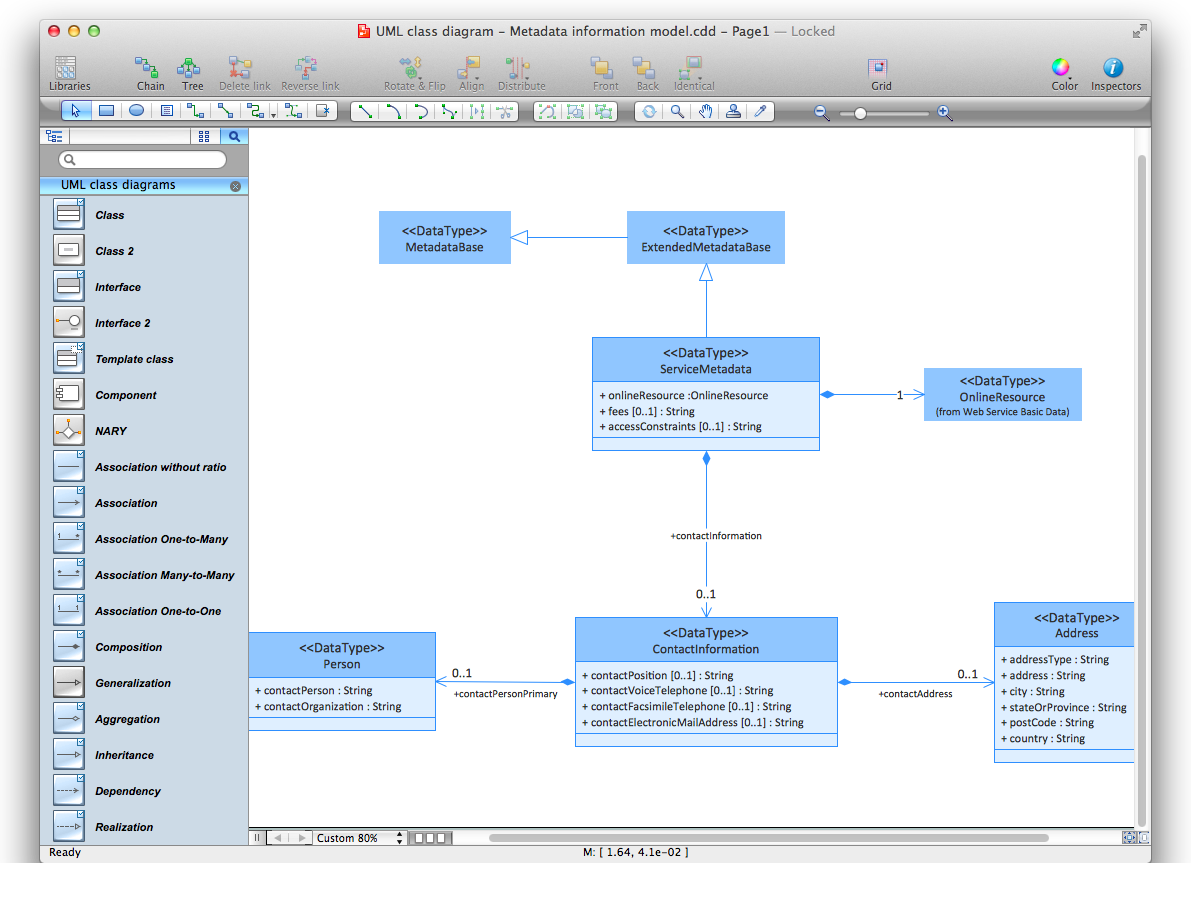
Pic. 3. UML libraries

It's convenient to use templates and samples from the Rapid UML Solution for ConceptDraw DIAGRAM for quickly start drawing your own UML Diagrams.

The Rapid UML Solution provides templates and samples for each type of UML diagrams.

Rapid UML Solution in ConceptDraw STORE

Pic. 3. Rapid UML Solution in ConceptDraw STORE

The documents of ConceptDraw DIAGRAM with UML Diagrams are vector graphic documents. They are available for reviewing, modifying or converting to a variety of formats: image, HTML, PDF file, MS PowerPoint Presentation, Adobe Flash or MS Visio.

Export options from ConceptDraw DIAGRAM title=

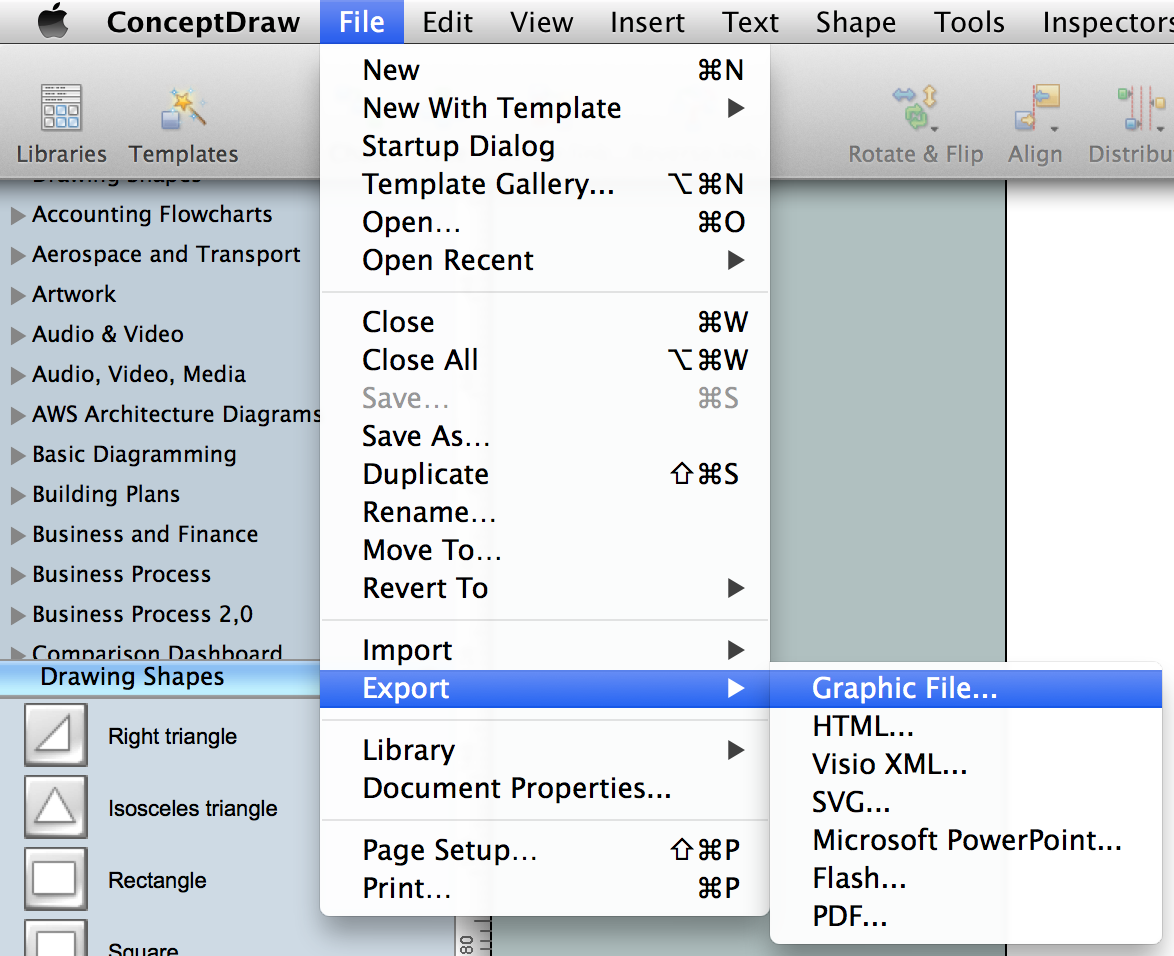
Pic. 3. Export options from ConceptDraw DIAGRAM

ConceptDraw DIAGRAM extended with the Rapid UML solution is perfect for drawing professional UML diagrams.


TEN RELATED HOW TO's:
Lean Six Sigma (LSS) is a well-known in all over the world methodology of quality improvement and business perfection. ConceptDraw DIAGRAM diagramming and vector drawing software is a powerful Lean Six Sigma Diagram Software thanks to the included Value Stream Mapping solution from the Quality Management Area of ConceptDraw Solution Park.Lean Six Sigma Diagram Software *
Picture: Lean Six Sigma Diagram Software
Related Solution:
An event-driven process chain diagram is a flowchart used in business process analysis. It evolved from Architecture of Integrated Information Systems (ARIS) and utilised in the business process improvement and analysis. It is also used to facilitate enterprise resource planning. An EPC diagram is a complex flowchart that shows different business processes through various workflows. The workflows are seen as functions and events that are connected by different teams or people, as well as tasks that allow business processes to be executed. ConceptDraw DIAGRAM is a software for making EPC diagrams that allows managers visually present business process models for making decisions for business.How to Draw EPC Diagram Quickly *
Picture: How to Draw EPC Diagram Quickly
Related Solution:
When we think about programming, we usually imagine sleepless nights spent on writing kilobytes of code. However, from another point of view, Software development with ConceptDraw DIAGRAM makes a programmer's life endlessly easier. This tool is unique to fulfill all your needs in short period of time. Over the recent years object-oriented methodology has become more and more widespread. Thanks to this methodology developers manage to deal with growing complexity of applications. More and more programs are written in such programming languages as C++, Java, Visual Basic and Object Pascal. However, the complexity of the designed systems imposes extended requirements as to design of graphic documentation. ConceptDraw possesses powerful tools for designing of technical documentation for object-oriented projects. The libraries included in the package allow to easily draw class hierarchies, object hierarchies and diagrams of data flows with the use of the most popular notations, including UML and Booch notations. And the library for projecting COM-interfaces will spare developers of ActiveX-servers a headache.Software development with ConceptDraw DIAGRAM  *
Picture: Software development with ConceptDraw DIAGRAM
Automatically create a presentation-quality diagram in one click with ConceptDraw DIAGRAM.Visual Presentations Made Easy <br>with Diagramming Software *
Picture: Visual Presentations Made Easy with Diagramming Software
Related Solution:
The vector stencils library UML Use Case contains specific symbols of the UML notation such as actors, actions, associations and relationships for the ConceptDraw DIAGRAM diagramming and vector drawing software.Jacobson Use Cases Diagram
Picture: Jacobson Use Cases Diagram
Related Solution:
ConceptDraw DIAGRAM diagramming and vector drawing software as a sequence diagram tool provides the Rapid UML Solution from the Software Development Area that contains the UML Sequence library.Sequence Diagram Tool *
Picture: Sequence Diagram Tool
Related Solution:
Compare desktop flowchart software for Mac and Windows. Evaluate templates, symbol libraries, export formats, file control, and workflow fit for long-term documentation.Desktop flowchart editor workspace on Mac and Windows
Picture: Professional Flowchart Software for Mac & Windows
Related Solution:
The UML diagram is a powerful tool which lets visually represent all system's components, the interactions between them and relationships with external user interface. The Rapid UML solution for ConceptDraw DIAGRAM software offers diversity of UML flowchart symbols for drawing all types of UML diagrams.UML Flowchart Symbols *
Picture: UML Flowchart Symbols
Related Solution:
When studying a business process or system involving the transfer of data, it is common to use a Data Flow Diagram (DFD) to visualize how data are processed. Being initially used exclusively in regards to the flow of data through a computer system, now DFDs are employed as the business modeling tools. They are applied to describe the business events and interactions, or physical systems involving data storage and transfer. ConceptDraw DIAGRAM is a powerful Data Flow Diagram software thanks to the Data Flow Diagrams solution from the Software Development area of ConceptDraw Solution Park.Data Flow Diagram Software *
Picture: Data Flow Diagram Software
Related Solution:
In software engineering, a UML Class Diagrams is a type of static structure diagram that is used both for general conceptual modeling of the systematics of the application, and for detailed modeling translating the models into programming code. Use ConceptDraw DIAGRAM with UML class diagram templates, samples and stencil library from Rapid UML solution to show the classes of system, their attributes, operations or methods, and the relationships among the classes.UML Class Diagrams. Diagramming Software for Design UML Diagrams *
Picture: UML Class Diagrams. ConceptDraw DIAGRAM - Diagramming Software for Design UML Diagrams
Related Solution:
ConceptDraw
DIAGRAM 18