UML Class Diagram Example - Social Networking Site
This sample was created in ConceptDraw DIAGRAM diagramming and vector drawing software using the UML Class Diagram library of the Rapid UML Solution from the Software Development area of ConceptDraw Solution Park.
This sample shows the structure of the popular social networking site Linkedin and is used in the business field, in IT, at the projection and creating of the social networking sites.
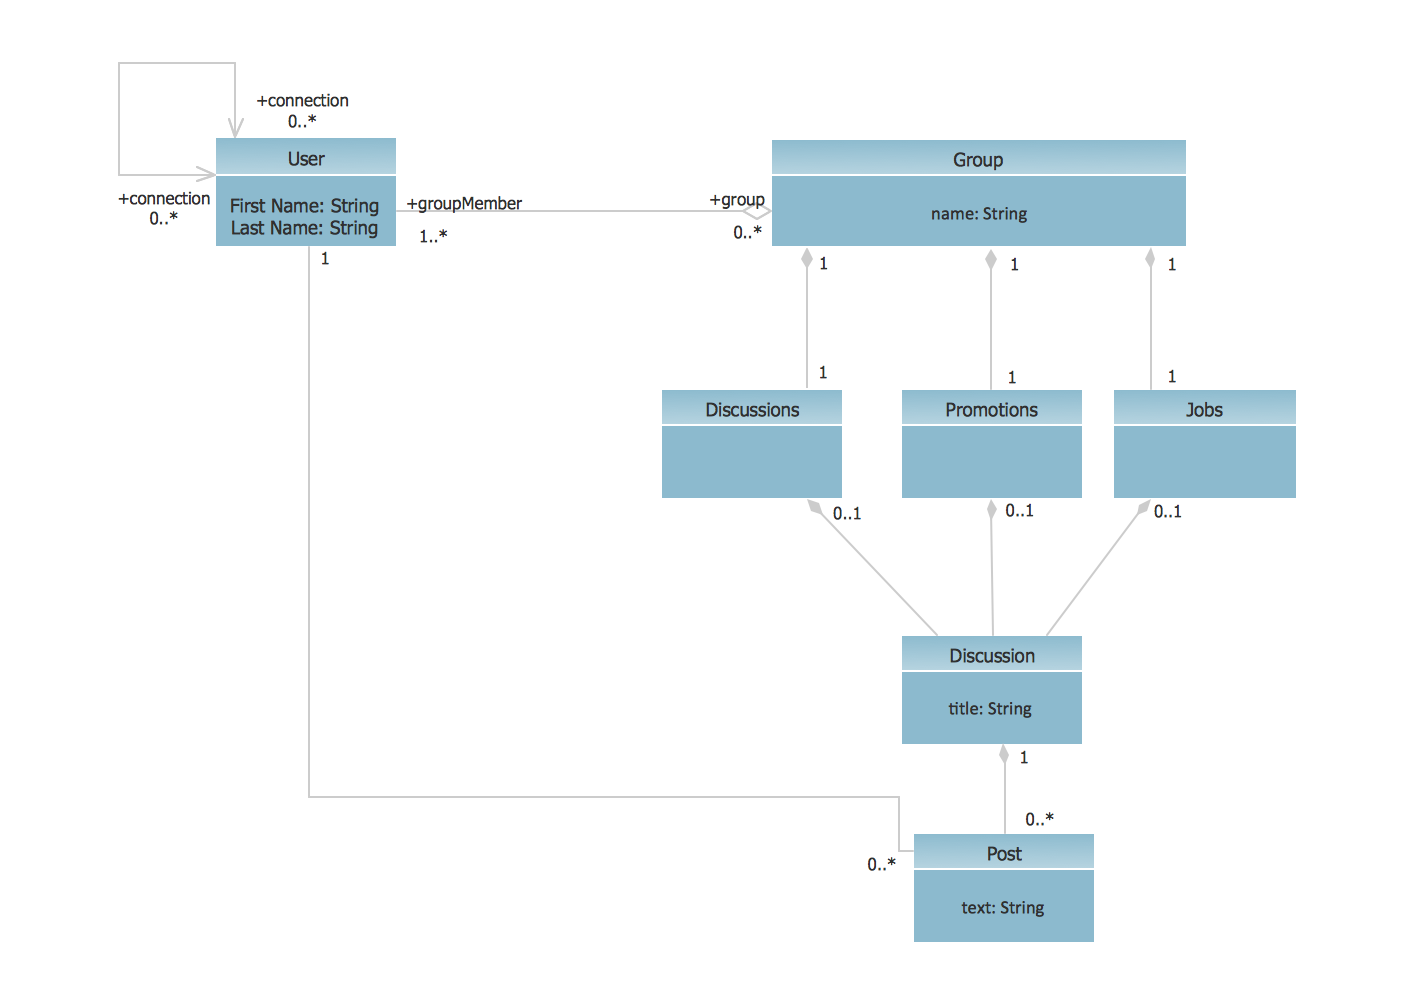
Example 1. UML of the Social Networking Site (Linkedin)
Using the libraries of the Rapid UML Solution for ConceptDraw DIAGRAM you can create your own visual vector UML diagrams quick and easy.
UML Resource:
- UML Software
- How to create a UML Diagram
- UML Diagram Examples
- Class Diagram
- Use Case Diagram
- Timing Diagram
- Interaction Overview Diagram
- Communication Diagram
- State Machine Diagram
- Activity Diagram
- Deployment Diagram
- Package Diagram
- Collaboration Diagram
- Object Diagram
- Sequence Diagram
- Composite Structure
- Component Diagram
TEN RELATED HOW TO's:
Create with our data flow diagram software perfect data flow diagrams. Download data flow diagram software for FREE. Use hundreds of data flow diagram examples.
Picture: Collaboration in a Project Team
This sample shows the OMT method. It was created in ConceptDraw DIAGRAM diagramming and vector drawing software using the Rapid UML Solution from the Software Development area of ConceptDraw Solution Park.
All diagrams produced with ConceptDraw DIAGRAM are vector graphic documents and are available for reviewing, modifying, and converting to a variety of formats (image, HTML, PDF file, MS PowerPoint Presentation, Adobe Flash or MS Visio XML).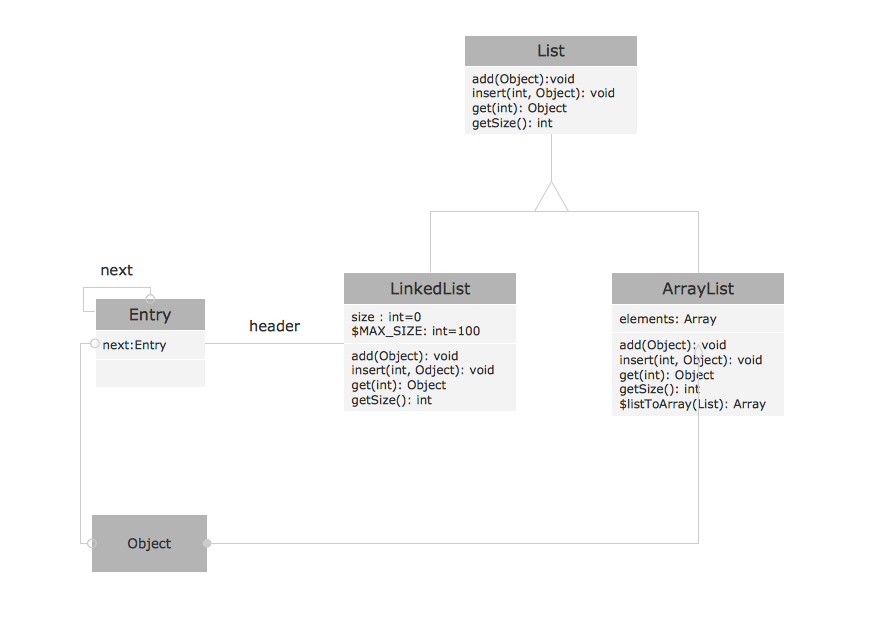
Picture: OMT Method
Related Solution:
The vector stencils library UML Use Case contains specific symbols of the UML notation such as actors, actions, associations and relationships for the ConceptDraw DIAGRAM diagramming and vector drawing software.
Picture: Jacobson Use Cases Diagram
Related Solution:
Samples, templates and libraries contain vector clip art for drawing the Road Transport Illustrations.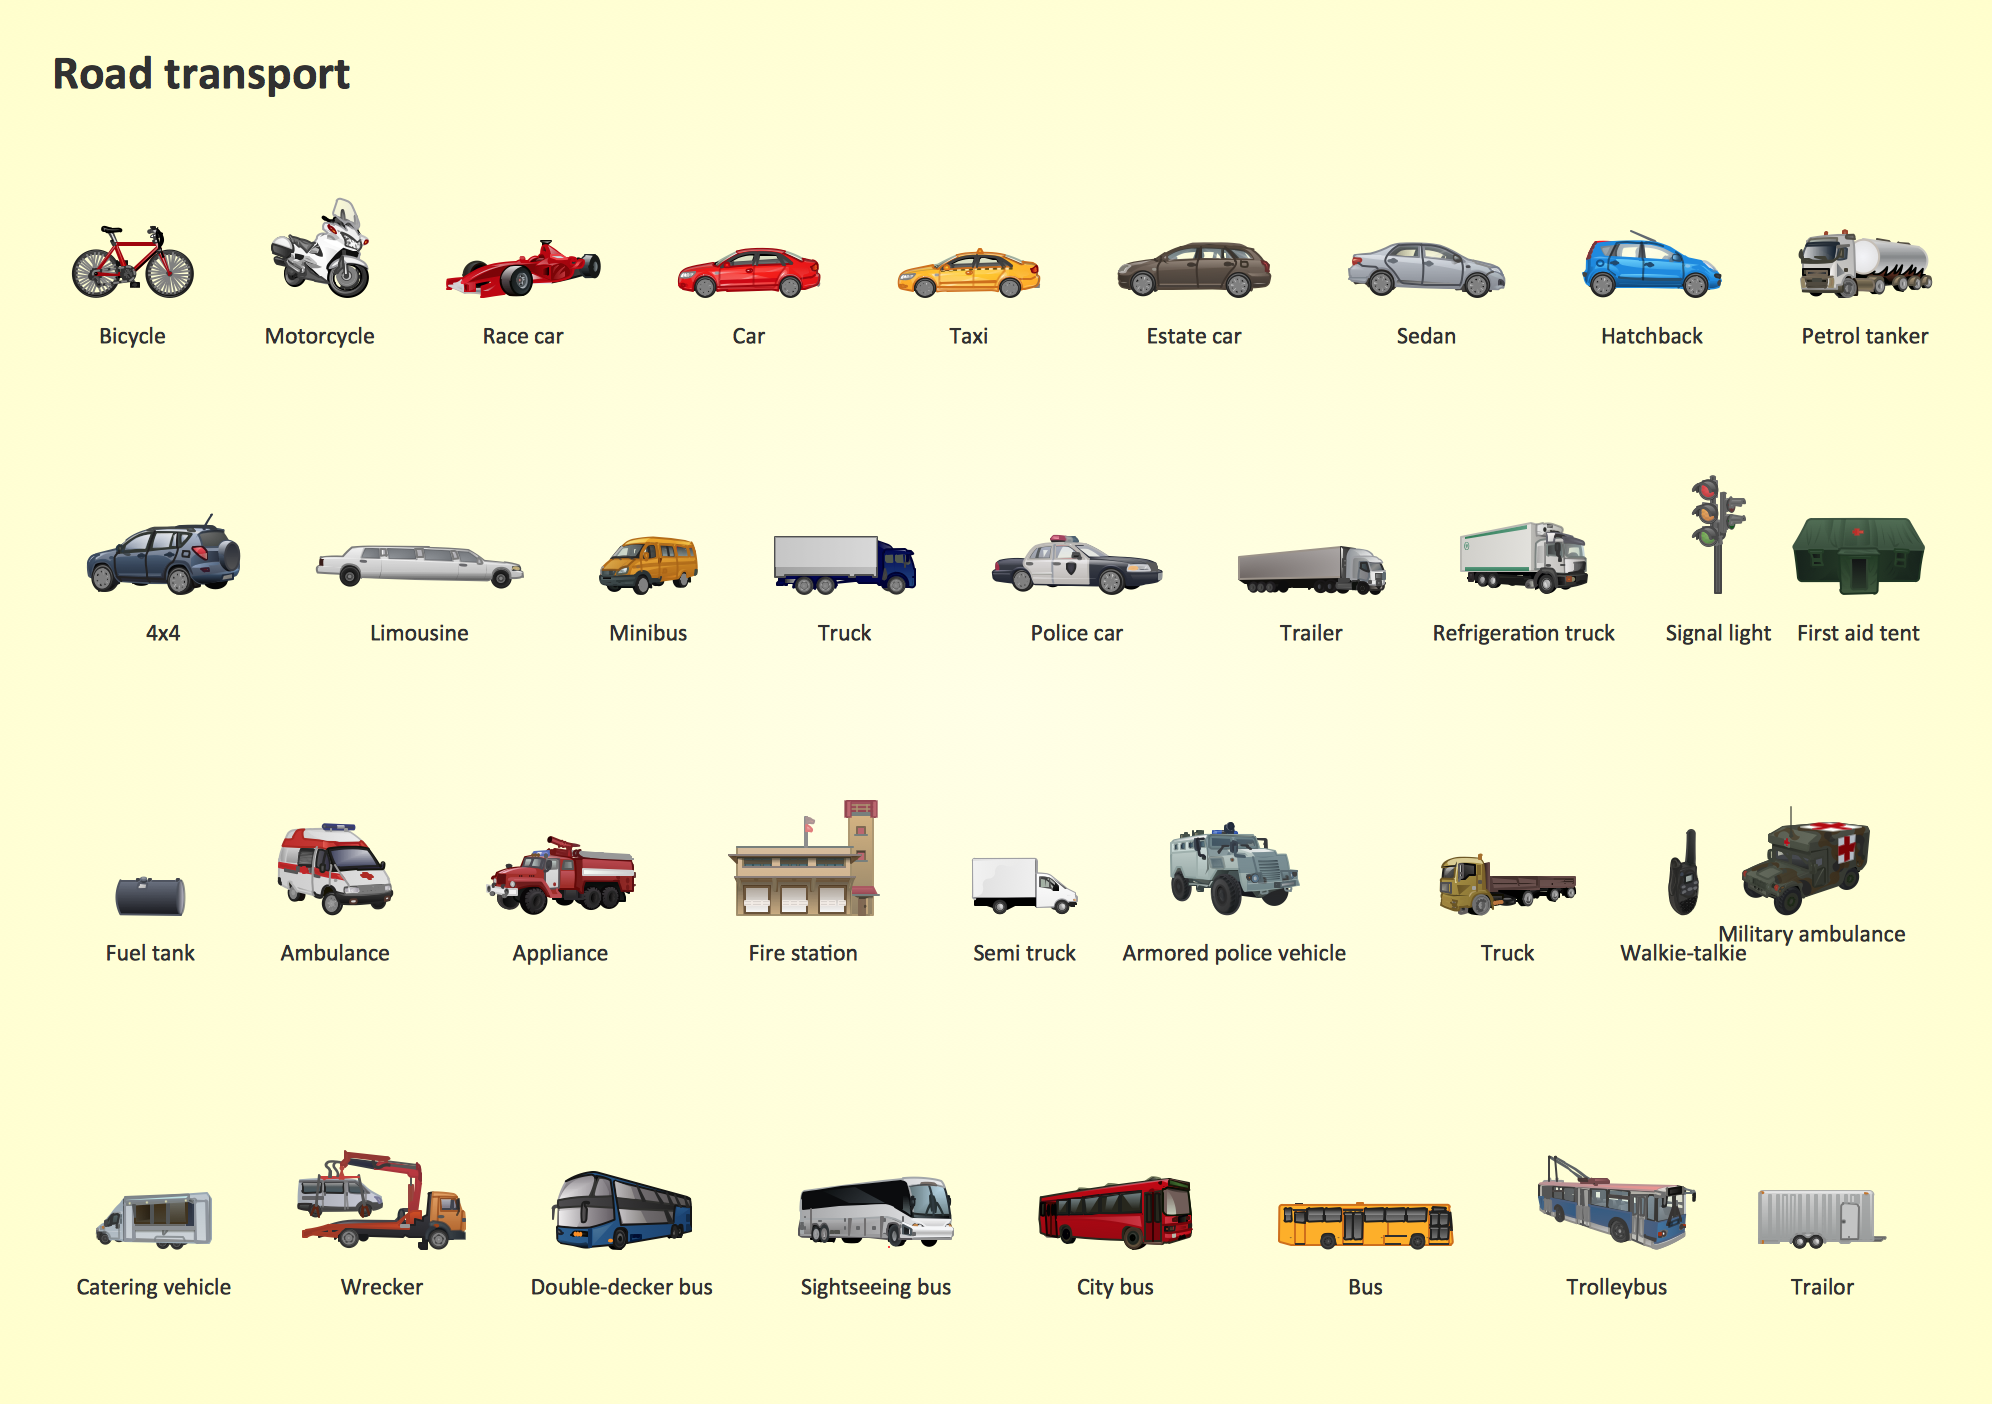
Picture: Road Transport - Design Elements
Related Solution:
AWS →
The AWS diagrams are convenient way for explaining the work of Amazon Web Services. ConceptDraw DIAGRAM diagramming and vector drawing software offers the AWS Architecture Diagrams Solution from the Computer and Networks Area for fast and easy creating the AWS diagrams of any complexity.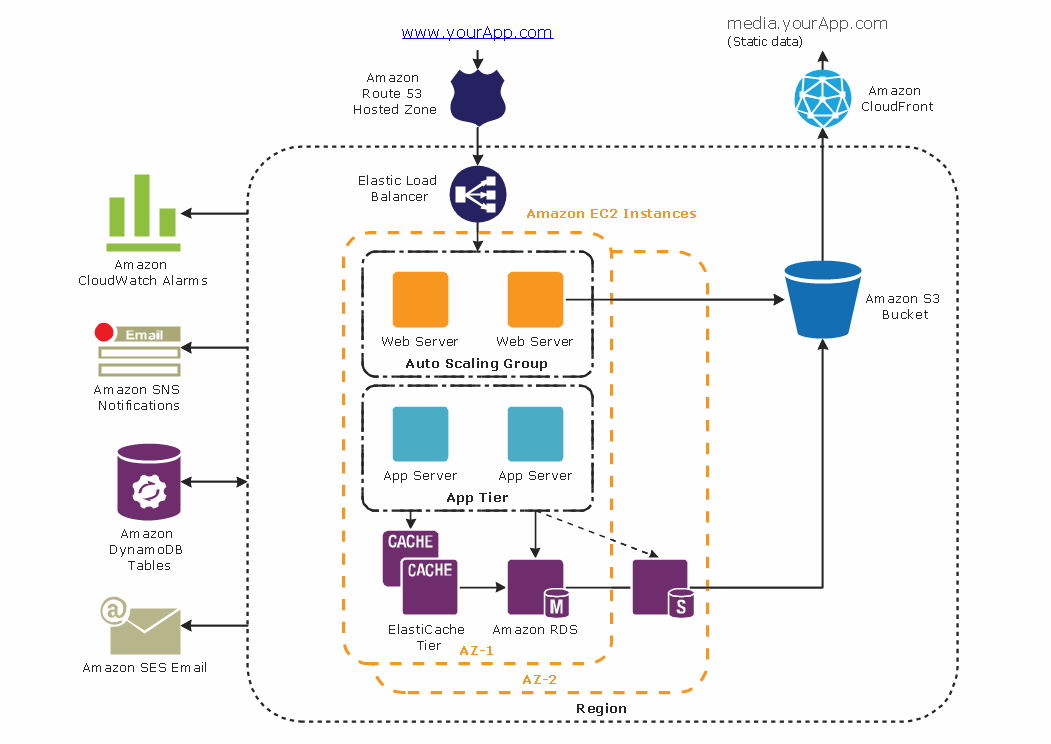
Picture: AWS
Related Solution:
UML Composite Structure Diagram shows the internal structure of a class and the possible interactions at this structure.
ConceptDraw has 393 vector stencils in the 13 libraries that helps you to start using software for designing your own UML Diagrams. You can use the appropriate stencils of UML notation from UML Composite Structure library.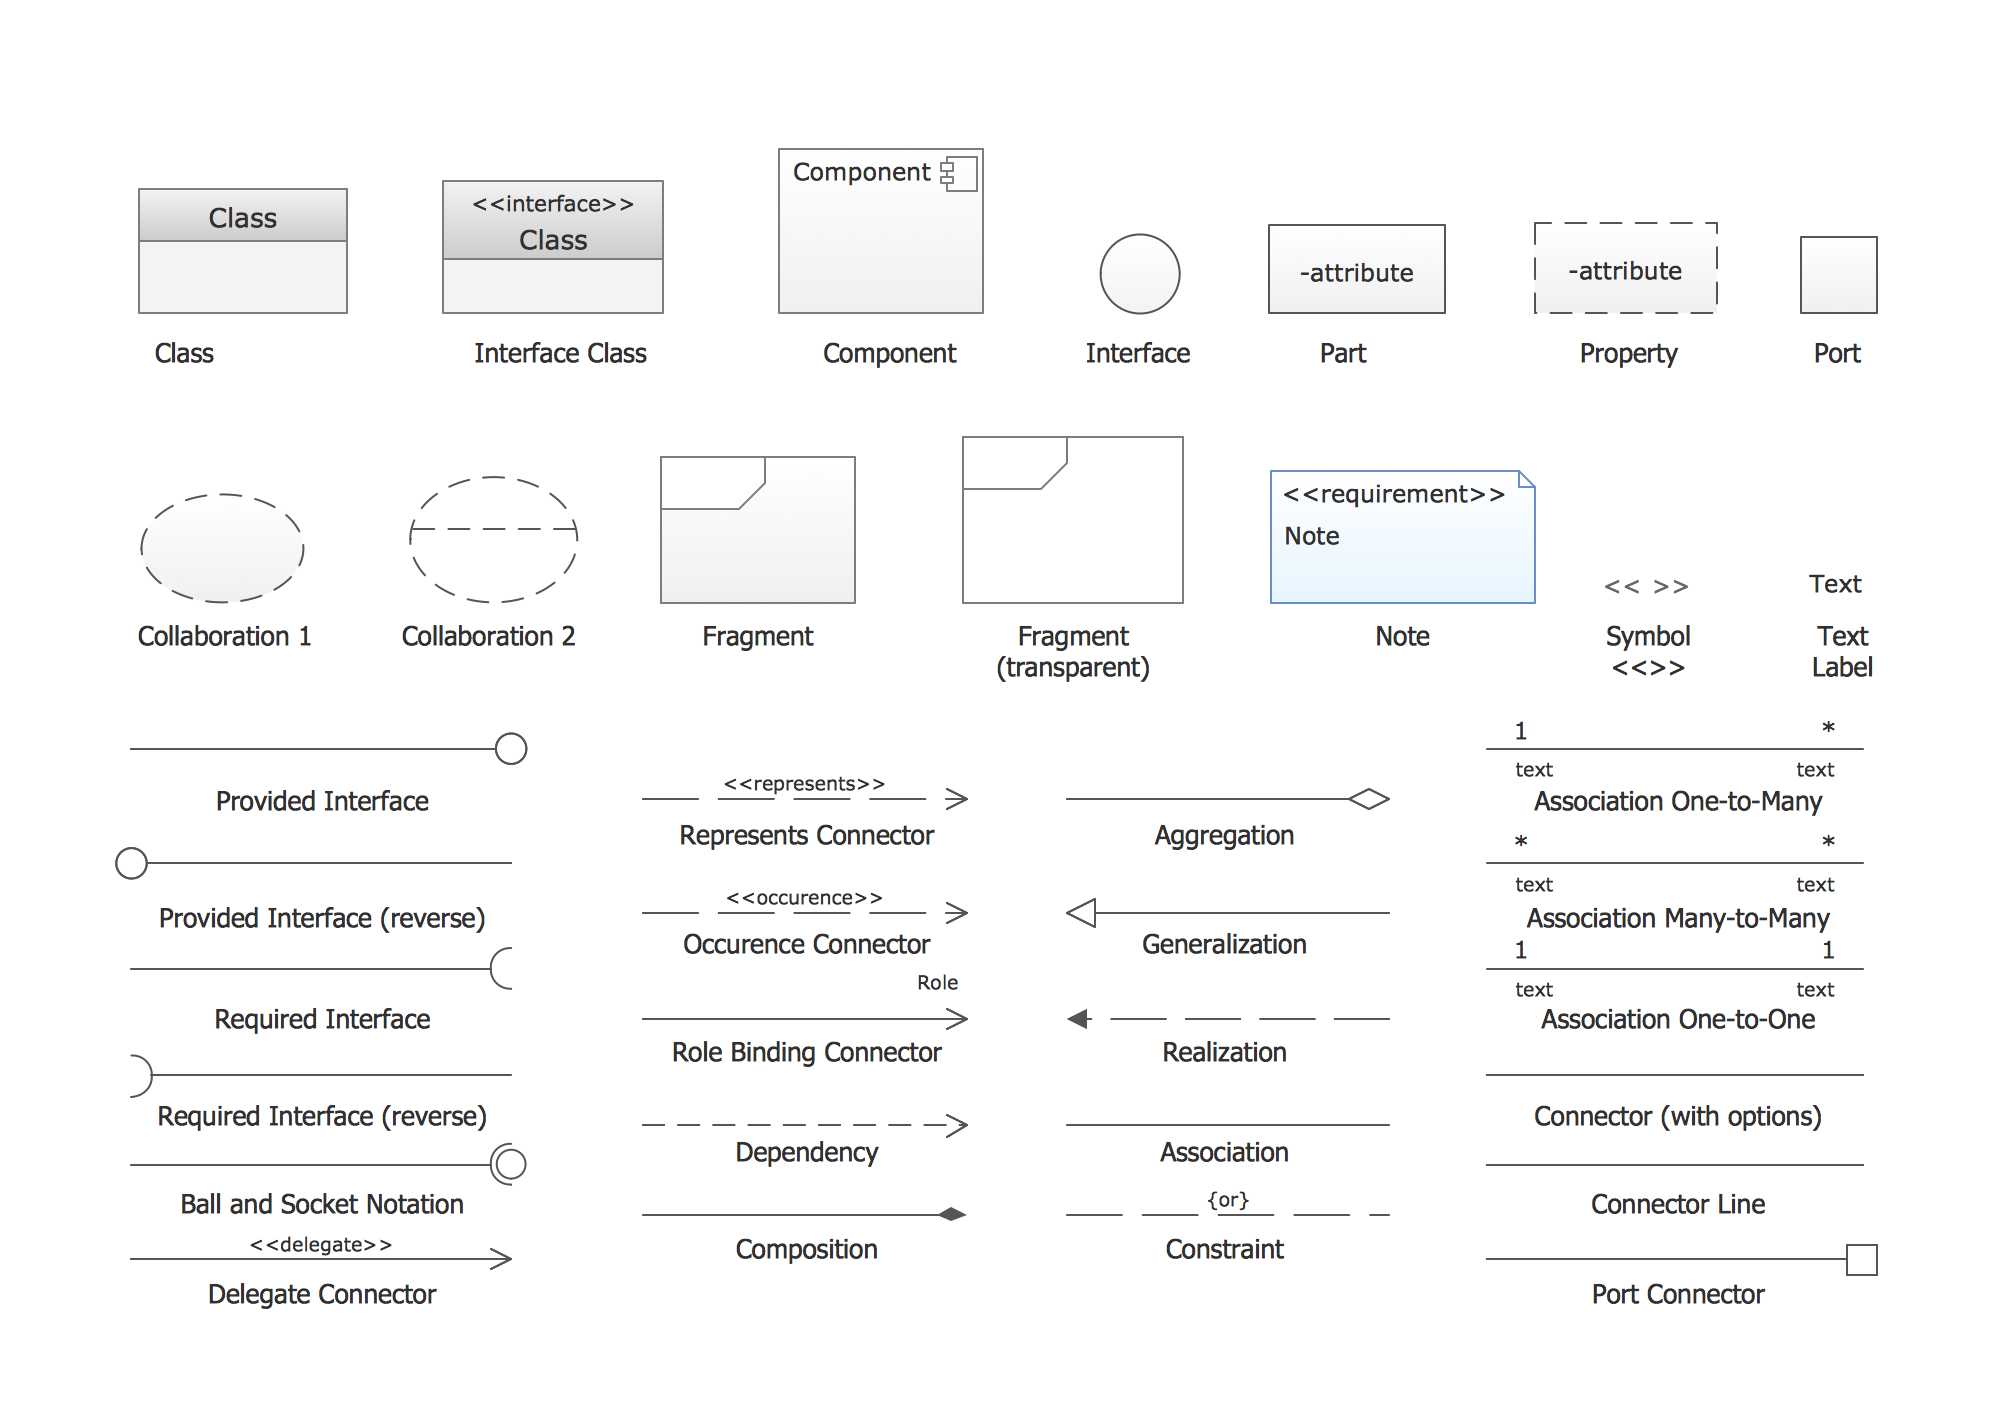
Picture: UML Composite Structure Diagram. Design Elements
Related Solution:
While creating flowcharts and process flow diagrams, you should use special objects to define different statements, so anyone aware of flowcharts can get your scheme right. There is a short and an extended list of basic flowchart symbols and their meaning. Basic flowchart symbols include terminator objects, rectangles for describing steps of a process, diamonds representing appearing conditions and questions and parallelograms to show incoming data.
This diagram gives a general review of the standard symbols that are used when creating flowcharts and process flow diagrams. The practice of using a set of standard flowchart symbols was admitted in order to make flowcharts and other process flow diagrams created by any person properly understandable by other people. The flowchart symbols depict different kinds of actions and phases in a process. The sequence of the actions, and the relationships between them are shown by special lines and arrows. There are a large number of flowchart symbols. Which of them can be used in the particular diagram depends on its type. For instance, some symbols used in data flow diagrams usually are not used in the process flowcharts. Business process system use exactly these flowchart symbols.
Picture: Flowchart Symbols: Meaning and Examples
Related Solution:
UML Component Diagram illustrate how components are wired together to larger components and software systems that shows the structure of arbitrarily complex systems.
ConceptDraw Rapid UML solution delivers libraries contain pre-designed objects fit UML notation, and ready to draw professional UML Component Diagram.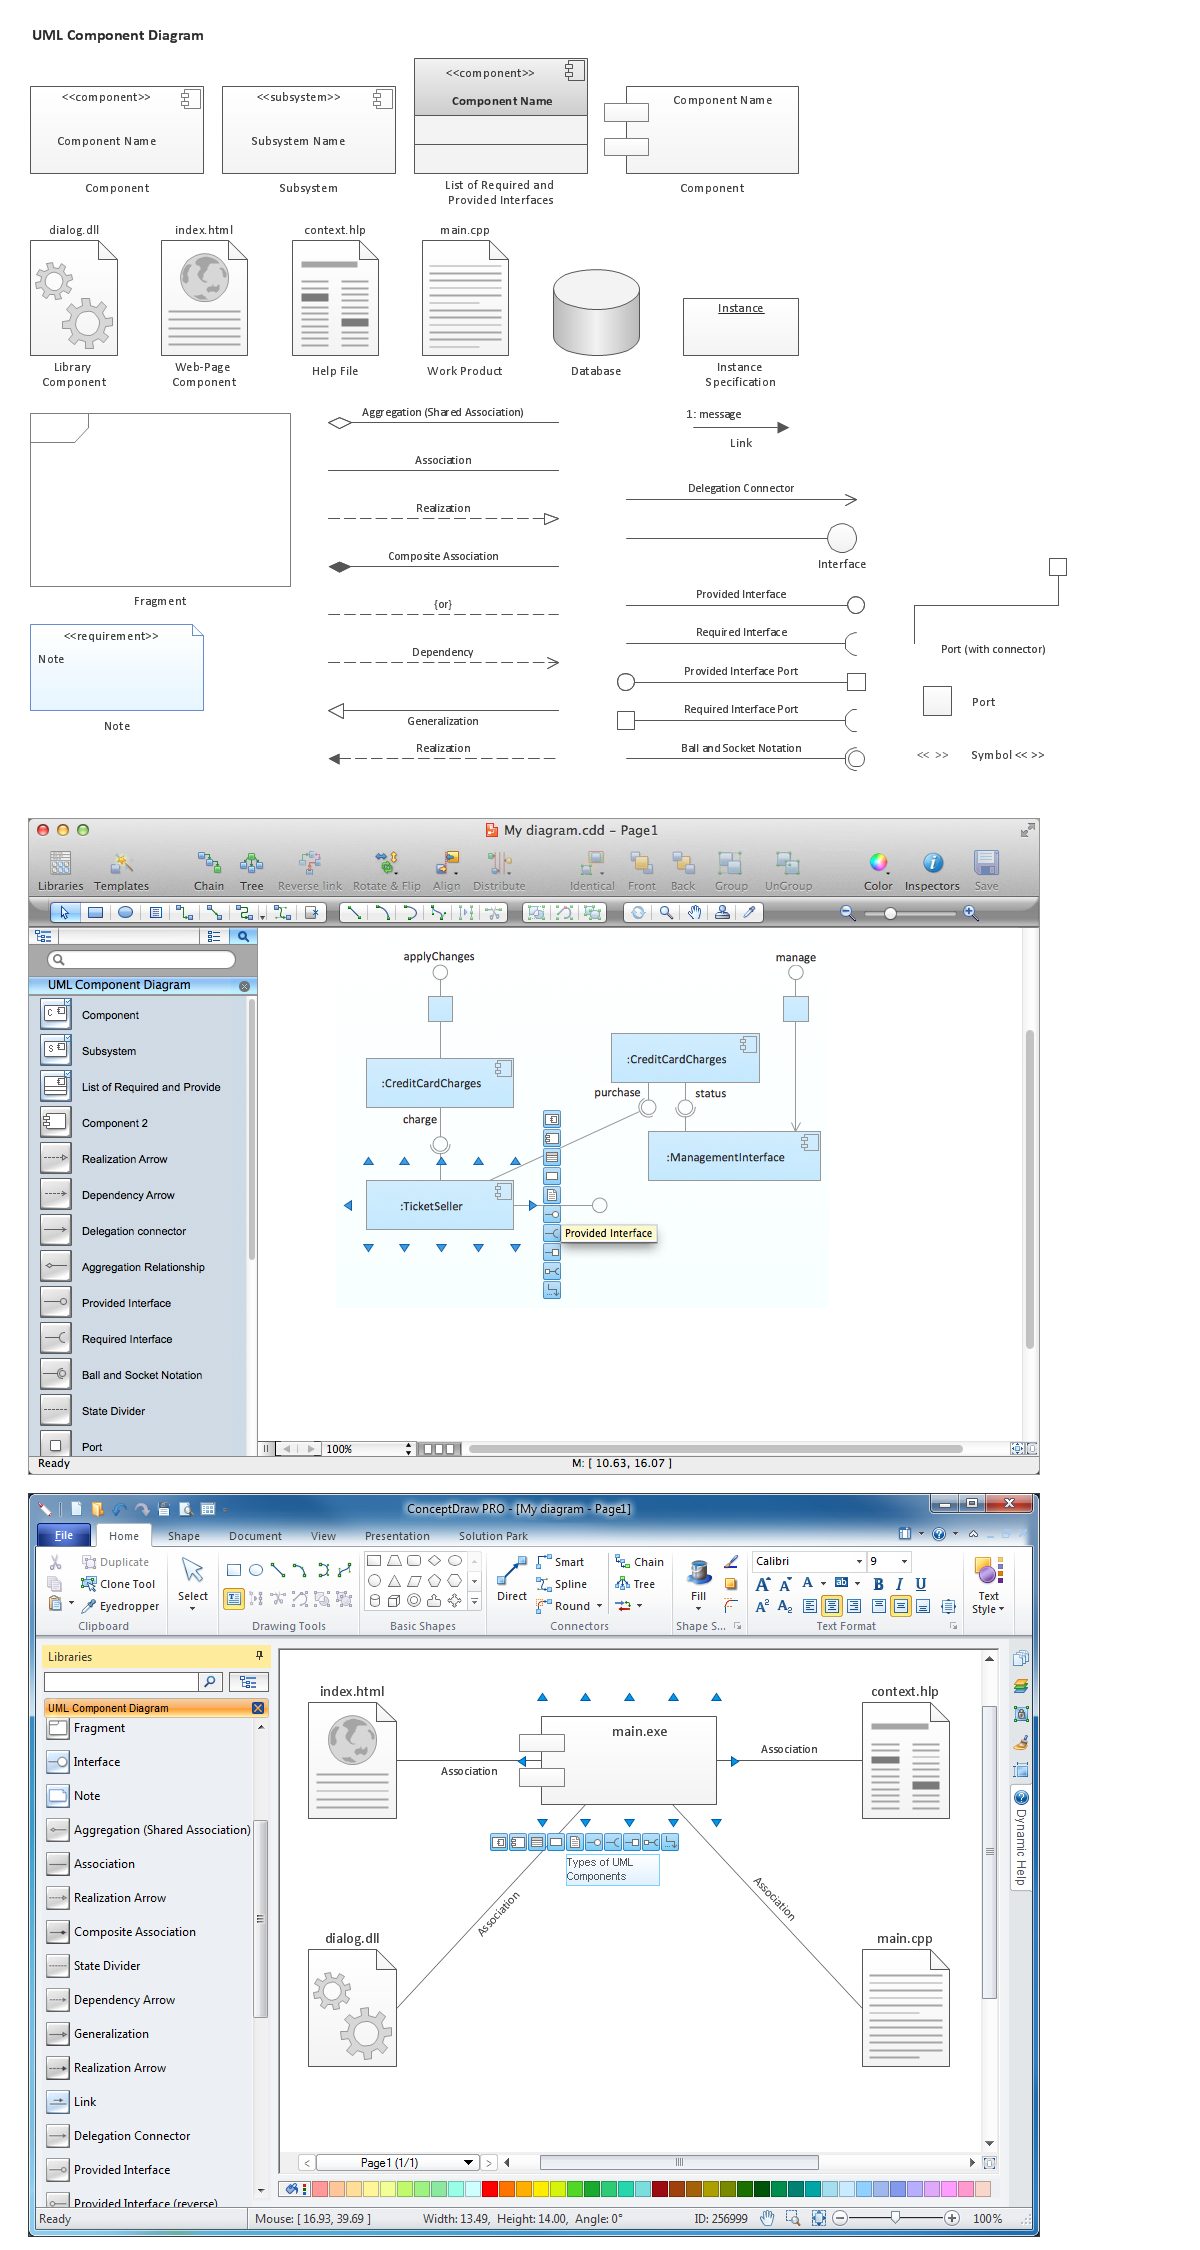
Picture: Diagramming Software for Design UML Component Diagrams
Related Solution:
While creating flowcharts and process flow diagrams, you should use special objects to define different statements, so anyone aware of flowcharts can get your scheme right. There is a short and an extended list of basic flowchart symbols and their meaning. Basic flowchart symbols include terminator objects, rectangles for describing steps of a process, diamonds representing appearing conditions and questions and parallelograms to show incoming data.
This diagram gives a general review of the standard symbols that are used when creating flowcharts and process flow diagrams. The practice of using a set of standard flowchart symbols was admitted in order to make flowcharts and other process flow diagrams created by any person properly understandable by other people. The flowchart symbols depict different kinds of actions and phases in a process. The sequence of the actions, and the relationships between them are shown by special lines and arrows. There are a large number of flowchart symbols. Which of them can be used in the particular diagram depends on its type. For instance, some symbols used in data flow diagrams usually are not used in the process flowcharts. Business process system use exactly these flowchart symbols.
Picture: Flowchart Symbols: Meaning and Examples
Related Solution:
Set of vector cliparts, samples, templates and libraries helps you to create all sorts of new imagesthe for Money Illustrations.
Various styles of money design elements (currency symbols, clipart, money symbols) can be found in ConceptDraw DIAGRAM Business and Finance Solution.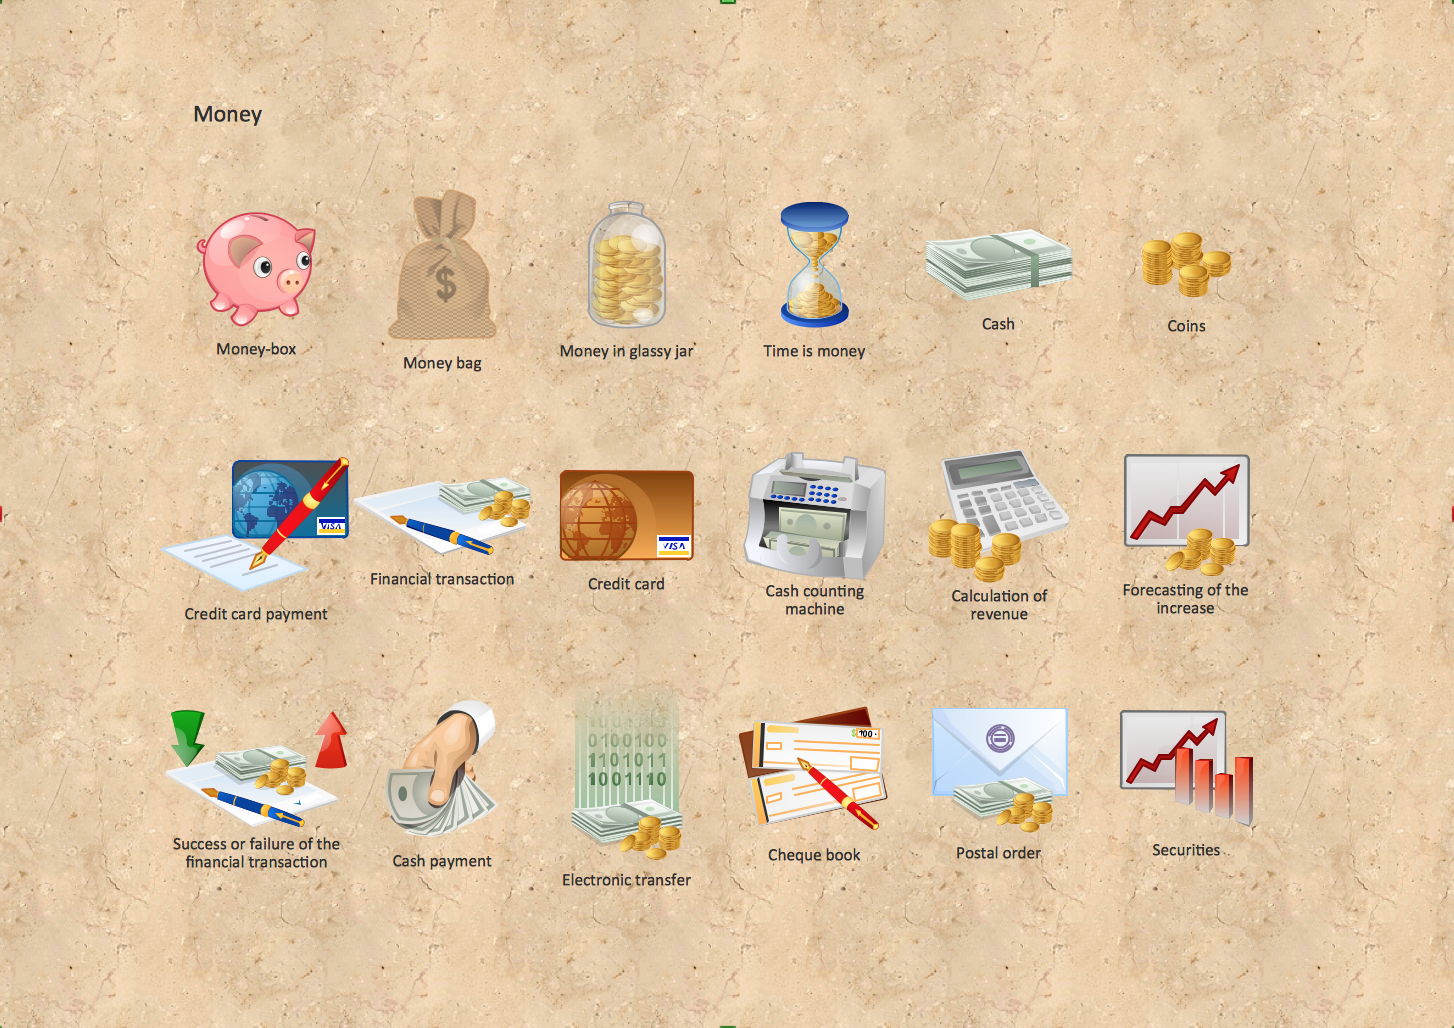
Picture: Money - Design Elements
Related Solution:
ConceptDraw
DIAGRAM 18