Made with
ConceptDraw
DIAGRAM 18

Use Case Diagrams technology with ConceptDraw DIAGRAM

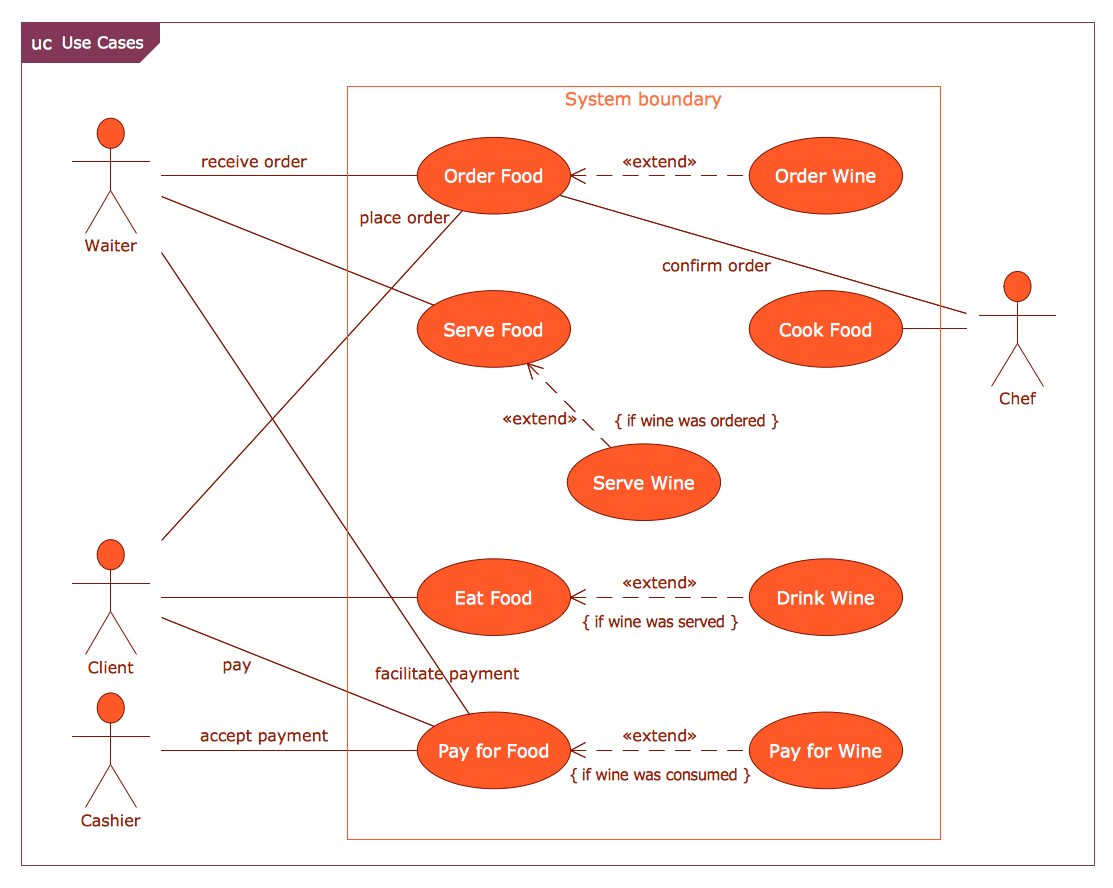
Use case diagrams are used at the development of software and systems for definition of functional system requirements or system of systems. Use case diagram presents the consecution of object’s actions (user’s or system’s) which are executed for reaching the definite result. Besides, the system’s behavior at the interaction with an object is described. The technology of the graphic representation of the use case was firstly proposed by I. Jacobson in 1986. Already in 90th many planners started using of use case diagrams to describe functional system requirements.

Each use case diagram describes the scenario of execution of a definite task or reaching of any goal. For most projects many use case diagrams are created to describe all possible use case for described system. Diagrams may differ in scale and in detailed elaboration of described actions. Diagrams describing business processes describe people actions and objects which take part in business process (E.g. people which settle accounts in banks and tellers which accept money), and diagrams describing software systems are focused on data and the system reaction on this data. Thus use case diagrams of business processes describe what happens in the process and system use case diagrams describe how data interact.

Use case diagram should:

  • Describe the consecution of actions of the object for reaching definite result;
  • Have comprehensible denotations of actions;
  • Have sufficient level of detailed elaboration/.

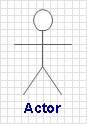
Use case diagrams consist of following objects: actors, actors’ actions variants of use or connections between variants of use. Connections between actors on use case diagrams are not shown.

Actors are objects which execute some actions. On the diagram actors are present in the form of people figures.

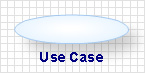
Actors’ actions are called variants of use and depicted in the form of ovals named in verbal form.

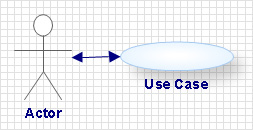
Actors’ connections are presented in the form of two-forked arrows,

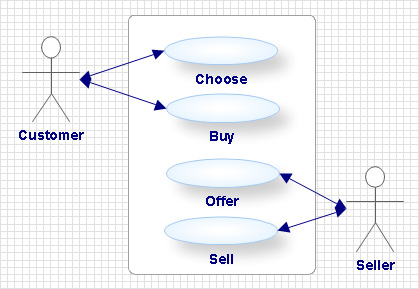
Connections between use cases are depicted in the form of arrows with marks which define connection type. Connections can be of following types:

  • Include – one of the variants of usage includes the other and depends on its results. Connection is represented in the form of a dotted arrow from included use case to including with the mark “include”.
  • Extend – one of the use case supplement the other at definite conditions. Connection is presented in the form of the dotted arrow from the supplemental use case to complemented use case with the mark “extend”.

  • Generalization – presented on the diagram use case can be the particular case of the more general use case. In such case the connection is presented in the form of a solid line with the ending in form of an empty triangle from particular use case to general. Such connections are often used in object-oriented modelling at subclasses description.

The whole system is marked out with rectangle, which denotes boundaries of the described system.

Usage of use case diagrams is considered as the visual way of system requirements. Actions in the system are presented in the form of comprehensible and logical descriptions, which make system requirements obvious.

Use Case Diagrams technology with ConceptDraw DIAGRAM  *

TEN RELATED HOW TO's:
How to design landscape? You can draw it by hand on a sheet of paper, but for this you need to know the bases of the perspective, you need to have good artistic abilities and to know how to depict the natural elements. But it is much easier and convenient to use the modern ConceptDraw DIAGRAM diagramming and vector drawing software extended with Landscape & Garden Solution from the Building Plans Area.How to Design Landscape *
Picture: How to Design Landscape
Related Solution:
ConceptDraw DIAGRAM diagramming and vector drawing software extended with unique SCRUM Workflow solution from the Project Management area of ConceptDraw Solution Park allows fast and easy design professional-looking Scrum Workflow Diagrams and Scrum workflow scheme for projects required when working on projects and managing them, when developing software with cutting-edge Agile methodologies.Scrum workflow *
Picture: Scrum workflow
Related Solution:
ConceptDraw PROJECT is an effective tool for new and experienced users with a fine balance of usability and powerful functionality.ConceptDraw PROJECT Software Overview *
Picture: ConceptDraw PROJECT Software Overview
The PERT Chart is constructed as part of the process in creating a schedule of corrective actions. The PERT Chart shows the logical connections and consequence of tasks to be performed. It displays the time period for problem solving and the implementation of all activities through the critical path. ConceptDraw Office suite is a software for corrective actions planning.CORRECTIVE ACTIONS PLANNING. PERT Chart *
Picture: CORRECTIVE ACTIONS PLANNING. PERT Chart
Monitoring Deployment Management icons - Amazon AWS pro diagrams - AWS diagrams are part of architecturing tools provided with ConceptDraw Solution Park.Diagramming software for Amazon Web Service <br>icon set: Monitoring, Deployment, Management *
Picture: Diagramming software for Amazon Web Service icon set: Monitoring, Deployment, Management
ConceptDraw DIAGRAM is a cross-platform flowcharting tool with extended HTML capabilities. It contains more than 10 000 pre-created objects and many templates, available for PC and Macintosh. Creating great designs and diagrams involves having the right drawing software. ConceptDraw new connectors called Arrows10 Technology is more than enough versatility to draw any type of diagram with any degree of complexity. ConceptDraw is the business diagram software of choice for business professionals who need to quickly and easily visualize, explore, and communicate information.New Connectors Technology *
Picture: New Connectors Technology
The Total Quality Management Diagram solution helps your organization visualize business and industrial processes. Create Total Quality Management diagrams for business process with ConceptDraw software.Probability Quality Control Tools *
Picture: Probability Quality Control Tools
Related Solution:
The UML Diagrams are widely used by developers and software engineers for professionally design and development any bank system or Automated Teller Machine (ATM) system. You need a powerful software for their design? ConceptDraw DIAGRAM extended with ATM UML Diagrams Solution from the Software Development Area of ConceptDraw Solution Park suits the best for this goal.Bank System *
Picture: Bank System
Related Solution:
ConceptDraw DIAGRAM diagramming and vector drawing software extended with Rapid UML Solution from the Software Development Area is a powerful online diagram tool that will help you design any types of UML diagrams simply and fast.Online Diagram Tool *
Picture: Online Diagram Tool
Related Solution:
With ConceptDraw Arrows10 Technology - You can delete a single connector, by using the Delete key. If you need to delete more than a single connector in a complex diagram that contains many relations there is a special Delete Links tool which deletes the connectors only, no other drawing objects are deleted.ConceptDraw Arrows10 Technology *
Picture: ConceptDraw Arrows10 Technology
ConceptDraw
DIAGRAM 18